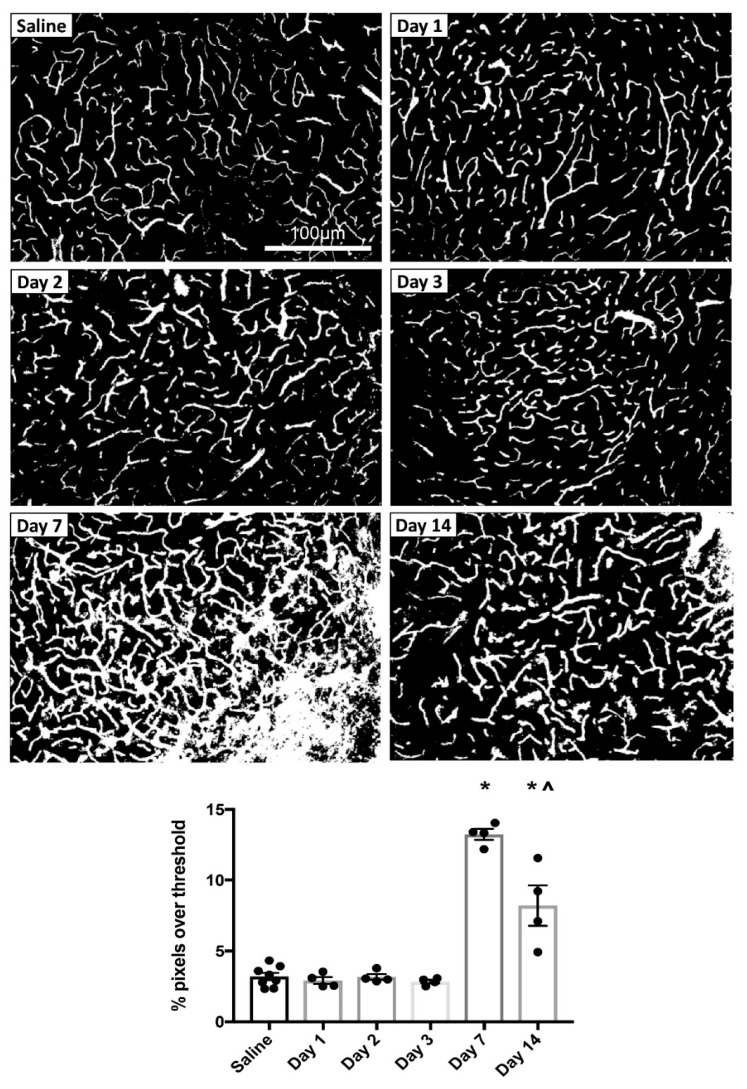
Figure 2.
MPTP-induced vascular leakage in the SNc. Top panels: Representative thresholded images of FITC-LA labelling in the SNc of mice injected with MPTP and perfused at 1, 2, 3, 7 or 14 days post-injection, compared to saline-injected control (top left). Scale bar in the top left image applies to all images. Bottom panel: Quantification of the percentage of pixels above threshold, as determined from thresholded FITC-LA images. Data are presented as mean ± SEM (n = 8 for saline, n = 4 for all other time points). * p < 0.0001 vs. Saline, Day 1, Day 2 and Day 3, ^ p < 0.0001 vs. Day 7.

