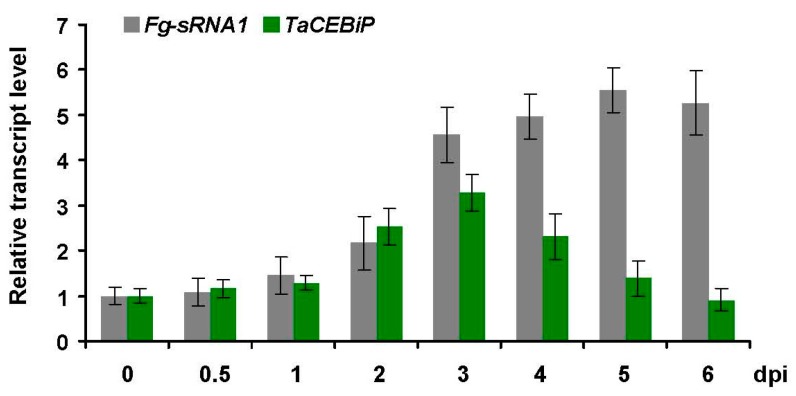
Figure 2.
Expression profiling of Fg-sRNA1 and TaCEBiP. Detection of relative transcript level of Fg-sRNA1 and TaCEBiP from F. graminearum infected lesion area in wheat leaves by real-time quantitative PCR (RT-qPCR) assay. At 0, 0.5, 1, 2, 3, 4, 5 and 6 days post inoculation (dpi) of F. graminearum, wheat leaves were collected for RT-qPCR detection.

