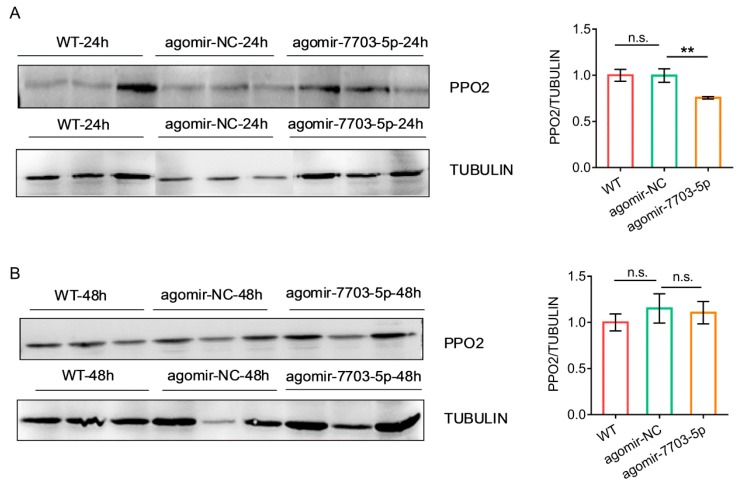
Figure 3.
Changes of the protein level of PPO2 in response to the agomir-7703-5p treatment. (A) and (B). Western blots against PPO2 (left) and normalized PPO2 expression levels (right) at 24 h (A) and 48 h (B) post-injection of agomir-7703-5p. Tubulin was used as a loading control. WT: Untreated larvae; agomir-NC: Larvae treated with control miRNA; agomir-7703-5p: Larvae treated with agomir-7703-5p. Integrated densities of protein bands were calculated using ImageJ and PPO2 levels were normalized against tubulin levels. Data were presented as mean ± SD (Student’s t test, n.s. indicated non-significant, ** p < 0.01).

