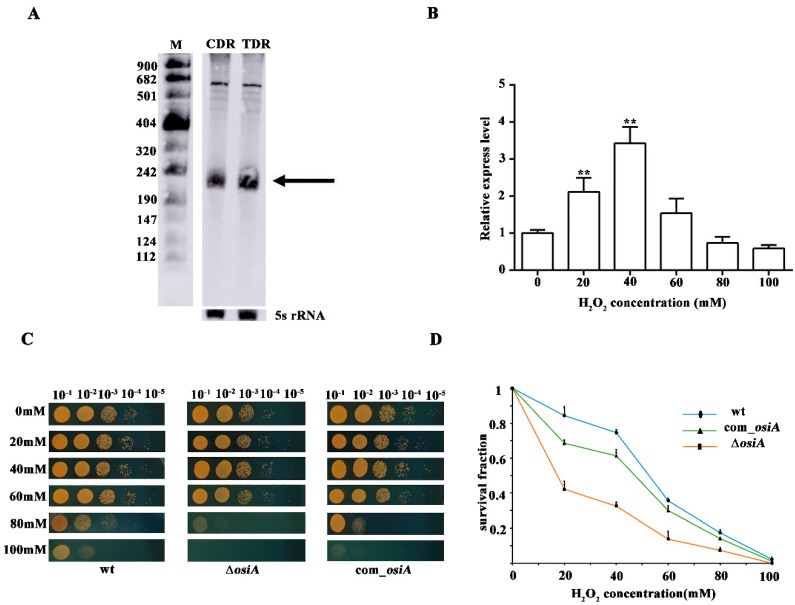
Figure 1.
Stress tolerance analysis of OsiA. (A) Northern blotting identification of OsiA. CDR is the control conditions, while TDR is the H2O2-treated conditions, with the arrow indicating OsiA, while 5S rRNA bands are shown as loading controls. (B) The expression profile of OsiA. ** means that the expression of OsiA is significantly different from that of the wild-type strain, that is, the p value is less than 0.01. (C) The phenotypic analysis of osiA knockout mutant, the osiA complementary strain, and the control under different H2O2-treated conditions. (D) Survival growth analysis of the osiA knockout mutant, osiA complementary strain, and the control under different H2O2-treated conditions.

