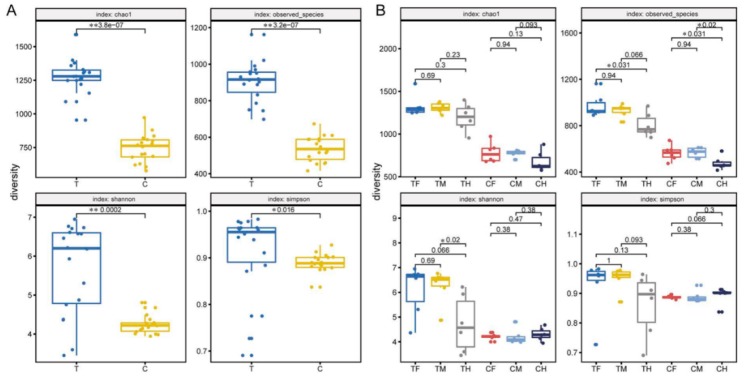
Figure 2.
Differences in alpha diversity between groups (A) and within groups (B). The four indexes of alpha diversity analysis, i.e., the Chao1, observed species, Shannon, and Simpson indexes, were calculated for different samples, and the groups of datawere compared with the Wilcoxon rank sum test.

