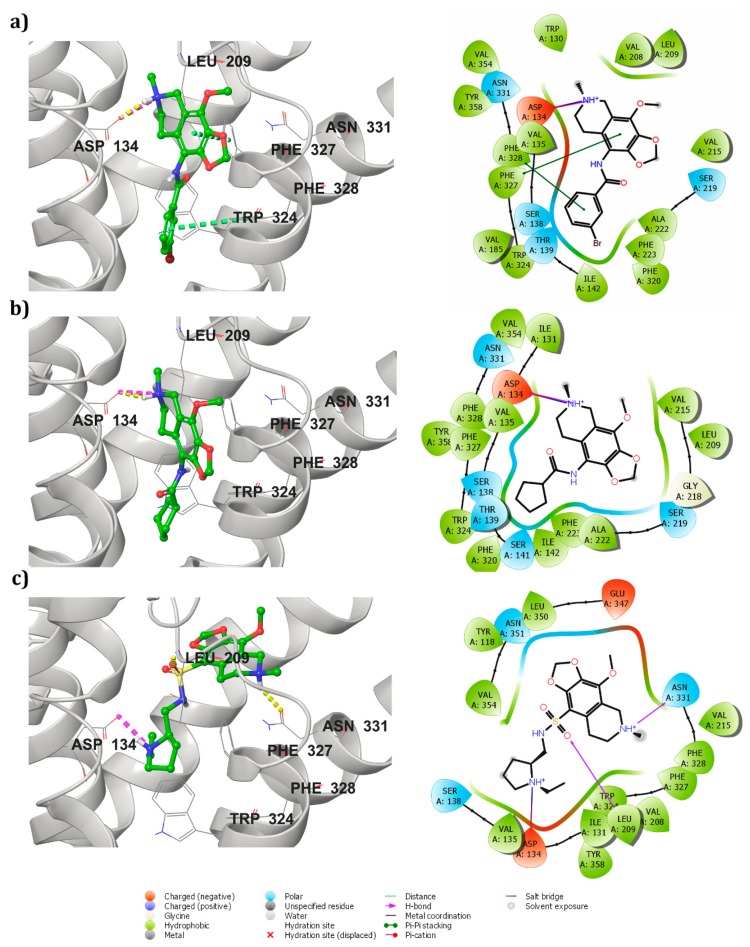
Figure 2.
Interaction profile of molecules with 5HT2C receptor after docking studies depicted in both 3D (left side: Hydrogen bonds (yellow), salt bridge (magenta), and π–π (green) interactions as shown in dotted lines) and 2D (right side) forms (a) 5HT2C receptor-Zinc32123870 complex, (b) 5HT2C receptor-ZINC32124535 complex, and (c) 5HT2C receptor-Zinc40312983 complex.

