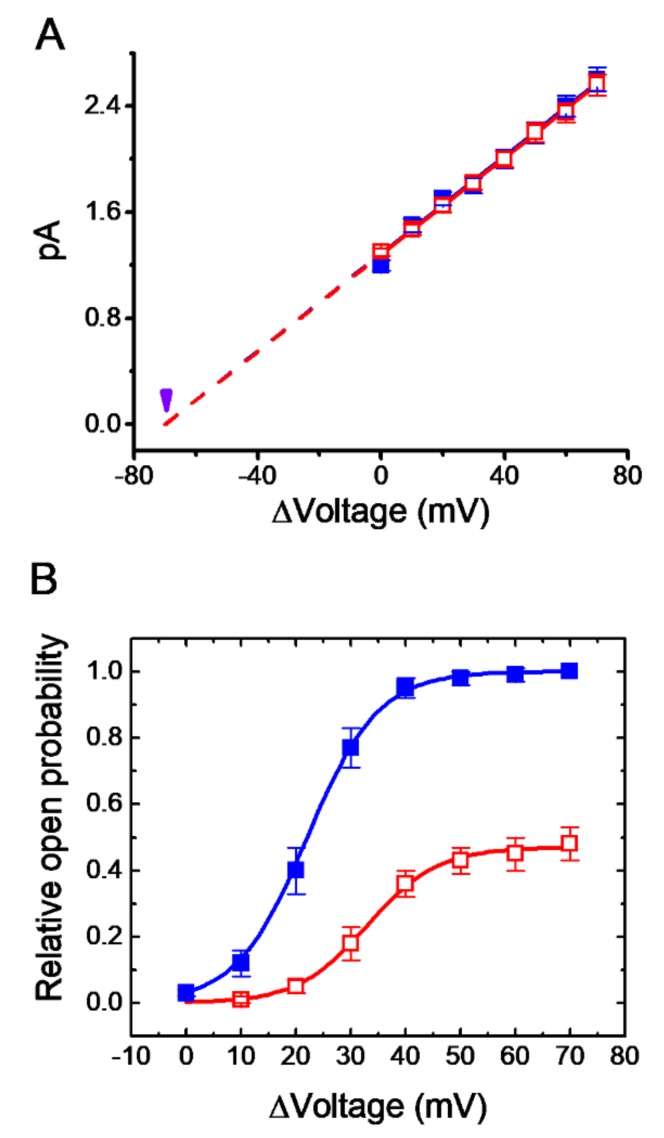
Figure 5.
Effect of PER on current-voltage (I-V) relationships and voltage-dependent activation of KM channels in mHippoE-14 cells. In these single-channel recordings, the cells were bathed in high K+, Ca2+-free solution and the recording pipette was filled with low-K+ solution. (A) The I-V curves of KM channels in the absence (■) and presence (□) of 3 μM PER (mean ± SEM; n = 11 for each point). Each dashed line is pointed toward the level of the resting potential (i.e., −70 mV which is indicated by the arrowhead). Of note, the single-channel conductance (i.e. I-V relationship) of the channel in the controls was virtually overlaid with that during exposure to PER (3 μM). (B) The activation curve (i.e., relative channel open probability versus Δvoltage) of KM channels with or without the addition of 3 μM PER (mean ± SEM; n = 11 for each point). The smooth curve was least-squares fit to a Boltzmann function as described in the Materials and Methods. ■: controls; □: in the presence of 3 μM PER.

