Figure 2.
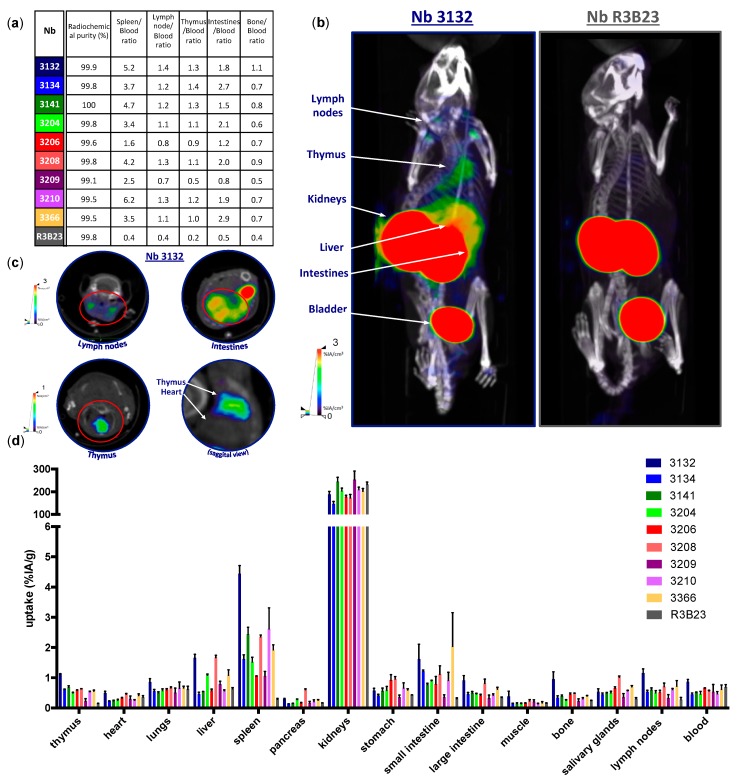
Single photon emission computed tomography (SPECT)/CT imaging and biodistribution of Nbs in naive C57BL/6 mice. (a) Radiochemical purity of in vivo injected 99mTc-Nb conjugates and the ratio between the uptake of the Nbs in the spleen, thymus, intestines, lymph nodes, and bones with the uptake values found in the blood (n = 1). (b,c) SPECT/CT imaging of mice 60 min after intravenous injection of 99mTc-labeled anti-moLAG-3 Nbs 3132 and 3206, showing specific signals in the lymph nodes, intestines, thymus, and bone marrow as compared to control Nb R3B23. The data shown are representative for three mice (n = 1). (d) Ex vivo γ-counting of the isolated organs from healthy C57BL/6 mice 80 min after injection with 99mTc-labeled anti-moLAG-3 Nbs or control Nb R3B23. The graph summarizes the biodistribution of the Nbs in three mice, expressed as mean ± SD of percentage of injected activity per gram of organ or tissue (%IA/g) (n = 1).

