

Abstract
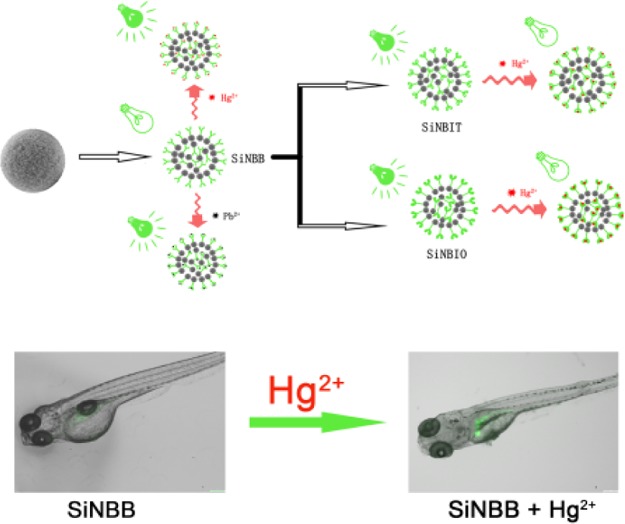
In this work, SiO2 microspheres were first prepared by a conventional Stöber method and then etched by NaOH solution to obtain porous ones. By tuning the degree of etching, specific surface area of SiO2 microspheres could be controlled. Then, small fluorescent molecules are synthesized and incorporated onto the surface and/or pores of the SiO2 via layer-by-layer reaction to obtain fluorescent microspheres, namely, SiO2–NH2–BODIPY (SiNBB), SiO2–NH2–BODIPY–indole–benzothiazole (SiNBIT), and SiO2–NH2–BODIPY–indole–benzoxazole (SiNBIO). The as-prepared microspheres SiNBB exhibit highly sensitive and selective recognition ability for Hg2+ and Pb2+. When SiNBB encounters Hg2+ and Pb2+, the fluorescence intensity of SiNBB is increased up to fivefold. SiNBIT and SiNBIO are solely sensitive to Hg2+, and both have a single high sensitivity to recognize Hg2+. The adsorption efficiency of Hg2+ by the three fluorescent microspheres SiNBB, SiNBIT, and SiNBIO reached 2.91, 0.99, and 0.98 g/g of microspheres, respectively. Experimental results of A549 cells and zebrafish indicate that the fluorescent microspheres are permeable to cell membranes and organisms. The distribution of Hg2+ in the brain of zebrafish was obtained by the fluorescence confocal imaging technique, and Hg2+ was successfully detected in A549 cells and zebrafish.
Introduction
SiO2 microspheres are small spheres with the size of nano- and/or submicron scale. They often have regular shapes, uniform particle size, good dispersion, large pore volume, continuously adjustable pore size, regular pore structure, and good thermal stability.1 Therefore, they have attracted wide attention in the field of adsorption and separation2 because of the large specific surface area. However, they are also prone to agglomeration, so that their adsorption properties are hindered. To overcome this shortcoming, their surfaces are frequently chemically modified.3,4 Usually, functional groups are introduced to the surfaces of microspheres; the dispersion and absorption ability are improved eventually.
Because the surface of SiO2 microspheres have a large amount of −OH groups, it is very suitable for functionalization by modification.5,6 The surface of silica nanoparticles is mostly modified with an organic ligand (such as amino group or sulfhydryl group) for the adsorption of metal substances.7 Further, SiO2 microspheres also have excellent biocompatibility and are selected as carriers for detecting and identifying fluorescent sensors. The composite SiO2 microsphere can detect and recognize metal substances in cells or organisms. Thus, silica particles can be used as carriers for new materials and combined nanomaterials because of their easily modified surface and show broad application prospects in chemical catalysis and cell labeling.8
With the everlasting development of our society, wastewaters are largely discharged into nature. Many harmful substances in wastewater are difficult to be naturally decomposed, and they accumulated, which cause great harm to the entire ecosystem. Heavy metal (HM) ion is one of most toxic issue. HM ions, such as Zn2+ and Fe3+, are essential elements for human body to ensure normal physiological activities within a reasonable range. However, when the concentration of trace elements in water exceeds a reasonable amount, they are harmful.9,10 Furthermore, some HMs are very difficult to be biodegraded. On the other hand, they continuously enriched under the action of the food chain, and finally enter the human body.11,12 Among HM ions, Hg2+ mainly harms the human central nervous system and damages the brain. Once Pb2+ enters the human body, it is extremely harmful to the nerves, hematopoietic system, and kidneys. Therefore, it is necessary to identify and remove harmful HMs. The essential metal ions should be monitored as well.
Instrumental methodology is the best way for the detection of HMs. Typical instrumental methods are atomic absorption spectroscopy (AAS),13 atomic fluorescence spectroscopy,14 ion coupled plasma mass spectrometry (MS),15 and X-ray fluorescence spectroscopy.16 However, these instruments are expensive and difficult to achieve real-time detection. Therefore, it is important to develop recognizing reagents for HM analysis.
Introducing fluorescent moieties to the surfaces of microspheres is a good method for their modification and fictionalization. Fluorescent microspheres emit fluorescence when stimulated by external energy17 as the parts before incorporation methods for preparing fluorescent microspheres include physical adsorption,18 embedding,19 self-assembly,20,21 copolymerization,22 and chemical bonding.23 The as-prepared fluorescent microspheres exhibit both recognition and removal ability to metal ions. At the same time, fluorescent microspheres can be used to label, screen substances, or organisms and as a standard to calibrate optical instruments.24,25
Salinas-Castillo et al.26 have reported a novel imidazole-functionalized microsphere as a fluorescent material and used to develop Cu(II) in water samples. This micromaterial can rapidly determine CN- and Cu(II) in natural water samples. This demonstrates that fluorescent microsphere materials can be used in natural water to detect target ions. Ding et al.27 synthesized a bifunctional fluorescent microsphere sensor using a 2,2-dipyridylamine derivative as a binding receptor immobilized on silica microspheres, which can be used to detect Cd2+, Hg2+, and Pb2+. Moreover, the fluorescent microspheres can also be used as an adsorbent for separating toxic metal ions. The reported data show that the fluorescent microspheres have good application value in detecting and removing HM ions in water.
In this work, mesoporous SiO2 microspheres were prepared by the Stöber method. Then, small fluorescent sensors are incorporated to the surfaces and/or pores to prepare fluorescent microspheres. The as-prepared fluorescent microsphere SiO2–NH2–BODIPY (SiNBB) exhibits high selectivity and sensitivity to Hg2+ and Pb2+. It can remove Hg2+ ions in water with as high efficiency as 2.91 g/g microspheres. The adsorption of Hg2+ by SiNBB is superior to some of the similar fluorescent microspheres that have been reported.28,29 The other fluorescent microspheres SiO2–NH2–BODIPY–indole–benzothiazole (SiNBIT) and SiO2–NH2–BODIPY–indole–benzoxazole (SiNBIO) were synthesized by a layer-by-layer (LBL) reaction method. They also have better selectivity for Hg2+. Through bioimaging tests, these three fluorescent microspheres can be used to monitor Hg2+ in living cells. At the same time, the experimental results of zebrafish also showed that the microsphere SiNBB can perform Hg2+ imaging with high sensitivity in the organism.
Results and Discussion
Preparation and Morphology Analysis of Porous Microspheres
To prepare pristine silica particles, ethanol (150 mL) and aqueous ammonia solution (50 mL) were mixed and added to a 1000 mL four-necked flask. The tetraethyl orthosilicate (TEOS) solution (125 mL, diluted in 150 mL of absolute ethanol) was added dropwise to the flask within 1 h and stirred at 25 °C for 24 h; original SiO2 microspheres were obtained accordingly.30 The silica microspheres were washed with deionized water and centrifuged for further use.
SiO2 microspheres are etched with different concentrations of NaOH at equal time (10 min). The morphologies of the microspheres before and after etching are shown in Figure 1. The surface of the microspheres before etching is smooth (Figure 1a). Figure 1b,c,e shows the morphology of the same original SiO2 etched with 1 M NaOH, 2 M NaOH, and 4 M NaOH solution. It can be seen that the surface of the microspheres gradually became coarse. It can be clearly seen from Figure 1f that the surface of the SiO2 etched by 4 M NaOH solution is severely uneven. At the same time, the specific surface area is larger than that of the microspheres etched by other NaOH concentrations.
Figure 1.

(a) SEM images of original SiO2 microspheres, about 1 μm in size. (b,c) SEM image of original SiO2 microspheres etched by 1 M NaOH, 2 M NaOH, about 0.6 μm in size. (d–f) SEM image of original SiO2 microspheres etched by 4 M NaOH, about 0.65 μm in size.
N2 adsorption/desorption test was performed on the SiO2 microspheres, and the results further showed the relationship between the etching degree and specific surface areas. The greater the etching degree, the larger the specific surface area obtained. However, there is no obvious linear change in the pore width; the average pore width is about 15 nm. When the concentration of NaOH excesses 5 M, the SiO2 microspheres are almost dissolved. Therefore, in order to obtain the microsphere with the largest specific surface area, the concentration of 4 M NaOH is best. The SiO2 (1 g) etched by 4 M NaOH was dispersed in toluene, −NH2 modified SiO2 was obtained by adding 0.2 g 3-aminopropyltriethoxysilane (APTES) and refluxing for 8 h. The Brunauer–Emmett–Teller (BET) and Barrett–Joyner–Halenda (BJH) pore size distribution tests were also carried out on −NH2–SiO2. The results showed that the specific surface area and pore width were not notably affected by the NH2CH2CH2-group (Table 1).
Table 1. Comparison of Specific Surface Area and Pore Width between Amino-Modified Microspheres and Original SiO2 Microspheres with Different Etching Degrees.
| sample | NaOH/M | BET surface area (m2/g) | BJH adsorption average pore width (nm) |
|---|---|---|---|
| original SiO2 | 0 | 5.6 | 15.9 |
| etched SiO2 | 0.5 | 14.4 | 23.2 |
| etched SiO2 | 1 | 22.2 | 18.3 |
| etched SiO2 | 2 | 50.5 | 11.8 |
| etched SiO2 | 3 | 54.5 | 22.5 |
| etched SiO2 | 4 | 139.0 | 9.7 |
| SiO2–NH2 | 4 | 125.3 | 12.2 |
Preparation of Fluorescent Microspheres
In order to connect NH2–SiO2 microspheres with fluorescent small molecules, B1 and BB were synthesized. Figures S1–S3 shows the Fourier transform infrared (FTIR), 1H NMR, and MS structure characterization of the synthesized B1 and BB. Through LBL reaction method, SiNBB, SiO2–NH2–BODIPY–indole (SiNBI), SiNBIT, and SiNBIO were successfully prepared separately. The infrared spectrum of the four fluorescent microspheres can be seen from Figure 2a. The stretching vibration peak of Schiff base C=N– was observed at 1632 cm–1 in SiNBB, indicating that the Schiff base reaction of SiO2–NH2 and BB was successful. The −C=O characteristic peak of 1727 cm–1 in the SiNBI infrared spectra can be seen. It was confirmed that 5-bromoindole-3-carboxaldehyde (BC) was successfully assembled onto the microspheres. The −C=O characteristic peak of SiNBIT and SiNBIO disappeared, and a new band corresponding to the −C–S–C bond appeared at 924 cm–1. This demonstrates that 2-mercaptobenzothiazole (MBT) and 2-mercaptobenzoxazole (MBX) are assembled onto the microspheres. The characteristic peaks of the four fluorescent microspheres appear as expected.
Figure 2.

(a) FTIR spectra of SiNBB, SiNBI, SiNBIT, and SiNBIO. (b) TGA weight loss curve for six different microspheres, residual quality, and graft ratio table.
The amount of organic compound grafted onto the microspheres can be inferred by thermogravimetric analysis (TGA). Figure 2b shows the TGA curves for six different microspheres. The residue after a high temperature of 650 °C is SiO2, and the amount of BB, BC, MBT, and MBX grafted onto the microspheres can be calculated accordingly. From the table of grafting ratio in Figure 2b, it can be found that the grafting ratio of fluorescent molecules on the microspheres is gradually increased.
In order to further confirm the successful introduction of fluorescent small molecules, X-ray photoelectron spectroscopy (XPS) measurements were performed, as shown in Table S1. Original SiO2 contains three elements: C (284 eV), Si (102 eV), and O (532 eV). The presence of the N (398 eV) in SiO2–NH2 indicates the successful introduction of the NH2CH2CH2-group. The XPS of SiNBB exhibited new elemental peaks F (685 eV) and B (191 eV), indicating that BB was successfully grafted onto SiO2–NH2. Table 2 shows the proportion of each element in different microspheres. The S element peak appeared, confirming that MBT and MBX were successfully assembled. This demonstrates that it is feasible to introduce fluorescent small molecules into the microspheres by the LBL reaction method.
Table 2. Proportion of Elements in the Microsphere.
| atomic % |
||||||
|---|---|---|---|---|---|---|
| elements | original SiO2 | SiO2–NH2 | SiNBB | SiNBI | SiNBIT | SiNBIO |
| C | 24.13 | 40.02 | 29.86 | 26.27 | 41.97 | 33.06 |
| Si | 22.48 | 18.07 | 20.63 | 18.26 | 9.88 | 12.35 |
| O | 53.39 | 39.11 | 31.47 | 33.43 | 21.83 | 23.14 |
| N | 2.80 | 4.53 | 5.65 | 3.57 | 4.11 | |
| F | 9.56 | 13.53 | 16.58 | 20.09 | ||
| B | 3.95 | 2.86 | 5.89 | 7.04 | ||
| S | 0.28 | 0.21 | ||||
A reference compound BBB was synthesized to demonstrate the correctness of the fluorescent small molecule structure on the microspheres. The synthetic route is shown in Scheme 1. Figure S1b shows the FTIR structural characterization of the BBB and confirms the product. BBB is insoluble in dimethylformamide (DMF), tetrahydrofuran, dimethyl sulfoxide, methanol, and a series of common solvents of Suzuki coupling reaction, resulting in the failure to continue to connect BC and the termination of the reaction. This also proves the superiority of the LBL reaction method in microsphere grafting. The advantage of the LBL reaction method is not only that the desired fluorescent microspheres can be prepared but also the process of preparing the microspheres becomes simpler. At the same time, compared with the reference compound BBB, the fluorescent microspheres can avoid a large loss of the fluorescent intermediate. After the reaction is completed, only the microspheres need to be washed to avoid using time-consuming column chromatography. More importantly, fluorescent microspheres can be prepared in large quantities.
Scheme 1. Synthetic Route of Fluorescent Small Molecules (B1, BB, BC, BBB) and Microspheres (Silica–NH2, SiNBB, SiNBI, SiNBIT, and SiNBIO).

Performance of the Fluorescent Microsphere SiNBB to Metal Ions
Detection and Recognition of Metal Ions by Fluorescent Microspheres SiNBB
The sensing properties of SiNBB fluorescent microspheres were measured on a large number of metal ions. First, metal ion solution Cu2+, Ag+, Zn2+, Cd2+, Hg2+, Ni2+, Mn2+, Co2+, Pb2+, Fe2+, Fe3+, Na+, K+, Mg2+, Ca2+, Al3+, Ba2+, Sn4+, and Sn2+ are added to the mixed solution of SiNBB (in glycerol/ethanol = 2:1, v/v). UV–vis and fluorescence spectra were recorded. As shown in Figures 3a and S5a, both fluorescence and UV–visible absorption spectra indicate that SiNBB is sensitive to Hg2+ and Pb2+ ions. Figure S6 also shows that other ions do not cause visible color changes in SiNBB.
Figure 3.

(a) Fluorescence spectra of the fluorescent microspheres SiNBB (2 mg/mL) dissolved in a mixed solvent (glycerol/ethanol = 2:1, v/v) when excited by λex = 360 nm. Metal ions Cu2+, Ag+, Zn2+, Cd2+, Hg2+, Ni2+, Mn2+, Co2+, Pb2+, Fe2+, Fe3+, Na+, K+, Mg2+, Ca2+, Al3+, Ba2+, Sn4+, Sn2+ (10 equiv). (b) Addition of single-metal ions to SiNBB. (c) SiNBB is added with Hg2+, others metal ions and albumin. (d) SiNBB is added with Pb2+, others metal ions and albumin. The fluorescence intensity of SiNBB varies with the change of Hg2+ (e) and Pb2+. (f) Concentrations from 0 to 20 equiv.
Figure 3a shows the fluorescence SiNBB upon the addition of metal ions (λex = 360 nm). It can be seen that the presence of other metal ions other than Hg2+ and Pb2+ does not cause a change in the emission spectra of SiNBB. After the addition of Hg2+ and Pb2+, the fluorescence intensity of SiNBB increased by about fivefold. Adding Hg2+ shifted the emission wavelength of SiNBB from 530 to 517 nm. Similarly, the addition of Pb2+ shifted the emission wavelength of SiNBB from 530 to 512 nm. The data show that SiNBB have selective recognition effect on Hg2+ and Pb2+ ions. This may be due to the fact that C=N bond and C=N isomerization is a very strong excited state decay process, which results in the weak fluorescence of SiNBB.31,32 When Hg2+ or Pb2+ is coordinated with C=N to inhibit isomerization, the rigidity of SiNBB is enhanced and the fluorescence intensity is significantly enhanced.
Figure S6b showed the images taken under UV light (365 nm). It could be seen that by SiNBB color change, Hg2+ and Pb2+ could be detected. In addition, as shown in Figure S6a, even under natural light, the color change of SiNBB is obvious upon the addition of Hg2+ and Pb2+. Therefore, SiNBB can be used as a “naked eye” detection reagent for Hg2+ and Pb2+.
Interference of Other Ions and Albumin on Fluorescent Microspheres SiNBB
Figure 3b shows the effect of SiNBB in identifying each ion in the form of histogram. It can be seen that only Hg2+ and Pb2+ can significantly enhance the fluorescence intensity of SiNBB. As shown in Figure 3c,d, the interference of other ions and albumin on the recognition of Hg2+ and Pb2+ by SiNBB microspheres was studied. By comparison of Figure 3b–d, it can be seen that when other metal ions and albumin are added, fluorescence intensity of SiNBB increases as the same as contacting with Hg2+ and Pb2+ only. This indicates that SiNBB is not significantly interfered by other metal ions. That is to say, Hg2+ and Pb2+ could be detected in the presence of other interfering metal ions and albumin.
Sensitivity of Fluorescent Microspheres SiNBB to Hg2+ and Pb2+
To determine the detection limits of Hg2+ and Pb2+ ions, the fluorescence spectra of SiNBB in the presence of different equivalents of Hg2+ and Pb2+ were tested. As shown in Figure 3e, as the Hg2+ concentration was increased from 0 to 8 equiv, the fluorescence intensity of SiNBB increased accordingly, and the final emission spectra curves have a blue shift of about 15 nm. Figure 3f shows that when the Pb2+ concentration increases from 0 to 11 equiv, the fluorescence intensity of SiNBB increases. When the Pb2+ concentration is 9 equiv, the emission spectra instantaneously blue shifts by about 18 nm. The concentration-dependent fluorescence signal transduction of SiNBB to Hg2+ and Pb2+ is obtained from Figure 3 and plotted in Figure 4a,b.
Figure 4.

Concentration-dependent fluorescence signals of fluorescent microspheres for Hg2+ and Pb2+. (a) SiNBB, (c) SiNBIT, and (d) SiNBIO toward Hg2+ using the fluorescence spectroscopy technique (b) SiNBB, toward Pb2+ using the fluorescence spectroscopy technique.
The limit of detection (LOD) of sensors is obtained by using the following equation
| 1 |
where α is the standard deviation of the blank sensor solution; K is the slope of the calibration curve.
Figure 4a shows K = 18.58 for the LOD of SiNBB for Hg2+ and K = 11.126 for LOD of SiNBB for Pb2+. Through calculation, the LOD of SiNBB for Hg2+ is 1.09 μM and for Pb2+ is 1.82 μM. Furthermore, it can be seen from Figure 4a,b that the linear concentration range of Hg2+ begins from 1.09 to 40 μM, and the fluorescence intensity of SiNBB changes linearly when Hg2+ is added. Similarly, the linear concentration range of Pb2+ is from 1.82 to 50 μM, and the fluorescence intensity also changes linearly when SiNBB contacts with Pb2+.
Adsorption Properties of Fluorescent Microspheres SiNBB for Hg2+
AAS is a common elemental (HM) analysis method. In order to determine the difference of Hg2+ adsorption performance SiO2 microspheres, the adsorption performance of different microspheres for Hg2+ was tested by AAS. From Table 3, it can be seen that an ion solution containing 150 mg of Hg2+ and the original SiO2 (50 mg) were subjected to an adsorption test for 1 h to remove 28.2 mg of Hg2+. Under the same conditions, the microsphere SiNBB can absorb 145.7 mg of Hg2+, which is close to complete adsorption. The efficiency of SiNBB to adsorb Hg2+ for is fivefold as original SiO2. When the adsorption time is 1 h, 0.56 g of mercury ions can be removed per gram of the original SiO2 microspheres, and 2.91 g of mercury ions can be removed per gram of SiNBB microspheres. The adsorption efficiency of microspheres SiNBB is much better than that of Original SiO2.
Table 3. Comparison of the Capacity of Original SiO2 and Fluorescent Microspheres in Adsorption of Hg2+a.
| original SiO2 | SiNBB | SiNBIT | SiNBIO | |
|---|---|---|---|---|
| initial Hg2+/mg | 150 | 150 | 150 | 150 |
| adsorption quality m1 mg/50 mg·1 h | 28.2 | 145.7 | 49.9 | 49.4 |
| adsorption quality m2 mg/50 mg·5 h | 69.3 | 149.6 | 108.6 | 128.4 |
| adsorption efficiency Y1/50 mg·1 h | 18.8% | 97.1% | 33.2% | 32.9% |
| adsorption efficiency Y2/50 mg·5 h | 46.2% | 99.7% | 72.4% | 85.6% |
| absolute adsorption quality M | 0.56 g | 2.91 g | 0.99 g | 0.98 g |
Performance of original SiO2 and fluorescent microspheres for adsorption of Hg2+ by AAS (“M” is the mass of Hg2+ that can be adsorbed by per gram of microspheres).
Performance of the Fluorescent Microsphere SiNBIT to Metal Ions
Detection and Recognition of Metal Ions by Fluorescent Microspheres SiNBIT
A series of metal ion solutions were added to SiNBIT solution, and the fluorescence spectra of the mixture were recorded. As shown in Figure 5a, SiNBIT is only sensitive to Hg2+ ions. That is to say, except for Hg2+ ions, the presence of other metal ions does not induce changes in the SiNBIT fluorescence emission spectra. After adding Hg2+, the fluorescence of SiNBIT quenched notably, the fluorescence intensity decreased by threefold, and the fluorescence peak did not shift significantly.
Figure 5.

(a) Fluorescence spectra of the fluorescent microspheres SiNBIT (2 mg/mL) dissolved in a mixed solvent (glycerol/ethanol = 2:1, v/v) when excited by λex = 320 nm. Metal ions Cu2+, Ag+, Zn2+, Cd2+, Hg+, Ni2+, Mn2+, Co2+, Pb2+, Fe2+, Fe3+, Na+, K+, Mg2+, Ca2+, Al3+, Ba2+, Sn4+, Sn2+ (10 equiv). (b) Addition of single-metal ions to SiNBIT. (c) Other ions and albumin interfere with SiNBIT. (d) Fluorescence intensity of SiNBIT varies with the change of Hg2+ concentrations from 0 to 20 equiv.
SiNBIT also has a C=N bond, but when SiNBIT coordinated with Hg2+, it shows a phenomenon completely different from SiNBB in terms of fluorescence intensity. This may be due to the fact that mercury is a chalcophile element with strong binding force to C–S bonds; compared with C=N bonds, Hg2+ is easier to coordinate with C–S bonds in this situation.33,34
The SiNBB image before and after the addition of Hg2+ also confirmed that Hg2+ could weaken the luminescence intensity of the SiNBIT solution. Similarly, the recognition of Hg2+ by SiNBIT and SiNBB can both achieve an instantaneous effect.
Interference of Other Ions and Albumin on Fluorescent Microspheres SiNBIT
Figure 5b shows the effect of SiNBIT in detecting metal ions in the histogram. It can be seen that only Hg2+ can significantly quench the fluorescence intensity of SiNBIT. When other interfering metal ions and albumin are added, the ability of SiNBIT to recognize Hg2+ is not affected, and the fluorescence intensity quenching remains unchanged.
Sensitivity of Fluorescent Microspheres SiNBIT to Hg2+
The fluorescence spectra of microsphere SiNBIT in the presence of Hg2+ with different equivalents were tested. As shown in Figure 5d, when the concentration of Hg2+ increases, the fluorescence intensity of SiNBIT decreases. Finally, when the Hg2+ concentration is higher than 12 equiv, the fluorescence intensity of SiNBIT does not change. Concentration-dependent fluorescence signaling of SiNBIT to Hg2+ was obtained from Figure 5 and plotted in Figure 4c. Figure 4c shows K = 6.6615 for calculating the detection limit of SiNBIT for Hg2+.
By using the LOD equation, the LOD of SiNBIT for Hg2+ is 2.23 μM. Furthermore, it can be seen from Figure 4c that when the concentration of Hg2+ is in the range of 2.23–12 μM, the fluorescence intensity changes linearly when SiNBIT contacts Hg2+.
Adsorption Properties of Fluorescent Microspheres SiNBIT for Hg2+
Table 3 shows the adsorption performance of SiNBIT for Hg2+ at different adsorption times. A solution containing 150 mg of Hg2+ was subjected to SiNBIT (50 mg) for 1 h, and 49.9 mg of Hg2+ was absorbed. The adsorption efficiency of Hg2+ on SiNBIT microspheres for 1 h is 2-fold of the original SiO2, and 0.99 g of mercury ions can be removed by 1 g of SiNBIT. SiNBIT is slightly weaker than SiNBB. However, the adsorption performance of SiNBIT is still better than that of the original SiO2.
Performance of the Fluorescent Microsphere SiNBIO to Metal Ions
Detection of Metal Ions by Fluorescent Microspheres SiNBIO
Fluorescence spectra of SiNBIO upon addition of metal ions were recorded. Figure 6a shows that SiNBIO, like SiNBIT, is only sensitive to Hg2+ ions. Other metal ions do not cause significant changes in the emission spectra. After the addition of Hg2+, the fluorescence of SiNBIO quenched threefold, and the fluorescence peak did not shift significantly. At the same time, SiNBIO and SiNBIT have a sole recognition ability of Hg2+, while SiNBIO, SiNBIT, and SiNBB can achieve the transient effect on Hg2+ recognition. SiNBIO and SiNBIT exhibit similar performance in fluorescence, which might be attributed to the same coordination mechanism of SiNBIT with Hg2+.
Figure 6.

(a) Fluorescence spectra of the fluorescent microspheres SiNBIO (2 mg/mL) dissolved in a mixed solvent (glycerol/ethanol = 2:1, v/v) when excited by λex = 310 nm. Metal ions Cu2+, Ag+, Zn2+, Cd2+, Hg+, Ni2+, Mn2+, Co2+, Pb2+, Fe2+, Fe3+, Na+, K+, Mg2+, Ca2+, Al3+, Ba2+, Sn4+, and Sn2+ (10 equiv). (b) Addition of single-metal ions to SiNBIO. (c) Other ions and albumin interfere with SiNBIO. (d) Fluorescence intensity of SiNBIO varies with the change of Hg2+ concentrations from 0 to 20 equiv.
Interference of Other Ions and Albumin on Fluorescent Microspheres SiNBIO
Interference of other ions and albumin on the recognition of Hg2+ by SiNBIO was also investigated. As shown in Figure 6b, only SiNBIO has notable fluorescence quenching when contacting with Hg2+. By comparison of Figure 6c with Figure 6b, it can be seen that when other metal ions and albumin were added, the degree of fluorescence quenching is the same as Hg2+ is added alone. This indicates that SiNBIO could not be interfered in recognizing Hg2+ in the presence of other interfering metal ions and albumin. This is as expected because the material structure of SiNBIT and SiNBIO is very similar.
Sensitivity of Fluorescent Microspheres SiNBIO to Hg2+
As shown in Figure 6d, the fluorescence spectra of SiNBIO in the presence of Hg2+ with different equivalents were tested. As the concentration of Hg2+ increases, the fluorescence intensity of SiNBIO decreases and eventually quenches almost completely. Finally, when the Hg2+ concentration is higher than 15 equiv, the fluorescence intensity of SiNBIO does not change. Concentration-dependent fluorescence signaling of SiNBIO to Hg2+ was obtained from Figure 6d and plotted in Figure 4d. Figure 4d shows K = 6.3267 for calculating the detection limit of SiNBIO for Hg2+.
By using the equation, LOD of SiNBIO to Hg2+ is 2.34 μM. Similar to SiNBIT, it can be seen from Figure 4d that when the concentration of Hg2+ is in the range of 2.34–14 μM, the fluorescence intensity changes linearly to recognize Hg2+.
Adsorption Properties of Fluorescent SiNBIO for Hg2+
The structure of SiNBIO is very similar to that of SiNBIT, which is also reflected in the adsorption performance of SiNBIO for Hg2+. The experimental results of Hg2+ adsorption by SiNBIO are shown in Table 3. SiNBIO (50 mg) can absorb 49.4 mg of Hg2+ in 1 h, and the efficiency of adsorbing Hg2+ in 1 h is also twofold of original SiO2. These performance data are very close to that of SiNBIT, as expected. Each gram of SiNBIO microspheres can remove 0.98 g Hg2+ ion, which shows a better performance than the original SiO2.
Detection Mechanism of SiNBB, SiNBIT, and SiNBIO by FTIR
To demonstrate the binding mechanism of SiNBB, SiNBIT, and SiNBIO to Hg2+ and Pb2+, Figure 7 shows the FTIR characterization of SiNBB, SiNBIT, and SiNBIO combining with Hg2+ and Pb2+. In Figure 7a, SiNBB, SiNBIT, and SiNBIO all have a characteristic peak of C=N bond at 1638 cm–1. The infrared spectra of SiNBB + Hg2+, SiNBB + Pb2+, SiNBIT + Hg2+, and SiNBIO + Hg2+ clearly show the vibrational band of the C–O (H) bond at 1380 cm–1.35,36 This may be because while Hg2+ or Pb2+ is coordinated to the nitrogen on C=N, the carbon on C=N interacts with water to form C–O (H) and N bonds Hg2+ ions. This confirms that SiNBB selectively recognizes the binding sites of Hg2+ and Pb2+ on the C=N bond. At the same time, the FTIR spectra of SiNBIT + Hg2+ and SiNBIO + Hg2+ exhibited a moderately strong peak at 800 cm–1 due to the binding of the C–S bond to Hg2+. The combining site is proposed and shown in Figure 7b–d.
Figure 7.

(a) FTIR spectrum verification mechanism analysis of fluorescent microspheres SiNBB, SiNBIT, and SiNBIO combined with Hg2+ and Pb2+. Structural representation of the binding sites of SiNBB (b), SiNBIT (c), and SiNBIO (d).
Cell Imaging Study
Cell imaging of SiNBB, SiNBIT, and SiNBIO was done by using A549 cells. A549 cells were propagated in Dulbecco’s modified Eagle medium supplemented with 10% (v/v) fetal bovine serum, 1% penicillin (100 μg/mL), and 1% streptomycin (100 μg/mL). The cells were maintained in a humidified atmosphere of 5% CO2 and 37 °C incubator. Cellular fluorescence imaging was taken by using a confocal microscope.
To demonstrate the use of fluorescent microspheres in cell imaging applications, their ability to detect Hg2+ in A549 cells was tested. As shown in Figure 8b,c, cells were imaged in a green channel. Fluorescence images showed that SiNBB could penetrate A549 cells through the cell membrane, which indicated that SiNBB had good cell membrane permeability. In Figure 8, SiNBB shows green emission in cells. Addition of Hg2+ caused a slight increase in emission intensity, and the fluorescence turn-on is observed. Figure 8c shows that cells treated with only SiNBB showed very weak fluorescence. However, when Hg2+ (100 μM) were also treated in these cells, intracellular fluorescence was significantly enhanced (Figure 8f). The changes in bioimaging of SiNBB at different concentrations of Hg2+ (200 μM) were also investigated (Figure 8g–i). These data demonstrate that microsphere SiNBB can be used to monitor Hg2+ in living cells. In addition, SiNBIT and SiNBIO cell imaging is shown in Figure S7. When Hg2+ was treated into cells, intracellular fluorescence was significantly weakened (Figure 8f,i), which further confirmed the potential use of SiNBIT and SiNBIO for cell imaging.
Figure 8.

Live cell image (a–c) A549 cells were treated with SiNBB (10 μM) for 1 h. (d–f) A549 cells were treated with Hg(NO3)2 (100 μM) for 30 min, and then SiNBB (10 μM) was added for 1 h. (g–i) A549 cells were treated with Hg(NO3)2 (200 μM) for 30 min, then SiNBB (10 μM) was added for 1 h. (a,d,g) Bright-field images; (b,e,h) green channel; (c,f,i) merged images of corresponding bright-field images and green channels; excitation wavelength is 420 nm.
Hg2+ Imaging in Zebrafish
The 3–7-day-old zebrafishes post-fertilization were obtained from China Zebrafish Resource Center (Wuhan, China). The zebrafishes were cultured in 5 mL medium supplemented with 1-phenyl-2-thiourea in 6-well plates for 24 h at 30 °C. Five zebrafishes were first incubated with 10 μM SiNBB for 2 h. After washing three times by distilled water, the zebrafishes were imaging in green channel. Then, 100 μM Hg(ClO)2 was added into the zebrafishes for another 2 h. Zebrafishes were imaging in a green channel after washing three times by distilled water. All of the fluorescence images were acquired with microscopy (Olympus SZX16, Japan).
In order to further confirm whether SiNBB was suitable for imaging and detecting of Hg2+ in vivo, zebrafish was chosen as the animal models. As shown in Figure 9, the control group (no Hg2+ was added) exhibited nearly no fluorescence. It demonstrated that the microspheres SiNBB showed low background for imaging in vivo. Additionally, after incubated with Hg2+, the green fluorescence displayed obviously enhancement which could be observed by naked eyes. These results forcefully indicated that microspheres SiNBB could perform Hg2+ imaging in living organisms with high sensitivity.
Figure 9.

Images of zebrafish. (a–c) Zebrafish were incubated with SiNBB (10 μM) for 2 h. (d–f) Hg(ClO)2 (100 μM) was added to the zebrafish for an additional 2 h. (a,d) Bright-field image; (b,e) green channel; (c,f) corresponding merged image of bright-field image and green channel.
Conclusions
In summary, pristine SiO2 microspheres were prepared and etched by NaOH to obtain mesoporous microspheres. Then, −CH2CH2CH2NH2 groups were introduced into the porous microspheres, and small fluorescent molecules were grafted by the LBL reaction method through −C=N– formation reaction between −NH2 and −CHO groups. Finally, three fluorescent microspheres SiNBB, SiNBIT, and SiNBIO with excellent fluorescent and sensing properties were obtained. The fluorescent microspheres SiNBB can selectively recognize Hg2+ and Pb2+, SiNBIT and SiNBIO are selectively sensitive to Hg2+ ions. They all can remove Hg2+ ions from the water with high efficiency. Meanwhile, all of the three fluorescent microspheres can be used to monitor Hg2+ in living cells, and the microspheres SiNBB can perform Hg2+ imaging with high sensitivity in organisms. This work provides a facile method to prepare microspheres for scientific research and real application.
Experimental Section
Materials
4-Formylphenylboronic acid, 2,4-dimethylpyrrole, boron trifluoride etherate (BF3·Et2O), trifluoroacetic acid, 2,3-dichloro-5,6-dicyano-1,4-benzoquinone, phosphorus oxychloride (POCl3) and trimethylamine (Et3N), 5-bromine indole, MBT, and MBX were purchased from J & K China Chemical.
APTES, TEOS, dichloromethane (DCM), 1,2-dichloroethane (DCE), absolute ethanol, ethyl acetate, petroleum ether, and glacial acetic acid were bought from Aladdin Chemical Co., Ltd. Et3N, DMF, DCM, DCE, and ethanol were purified by distillation for further use. All of the metal salts (Cu2+, Ag+, Zn2+, Cd2+, Hg2+, Ni2+, Mn2+, Co2+, Pb2+, Fe2+, Fe3+, Na+, K+, Mg2+, Ca2+, Al3+, Ba2+, Sn4+, Sn2+) were purchased from Aladdin Chemical Co. Ltd. and used as received.
Characterization
FTIR spectroscopy was measured by a Nicolet-6700 FTIR (Thermo) instrument in the range of 4000–400 cm–1. 1H NMR was measured by AVANCE III 600 MHz (Bruker). SiO2 microspheres were analyzed by TGA (209F3 Tarsus [NETZSCH] Instrument, Frankfurt, Germany). The morphologies of SiO2 before and after etching were obtained by scanning electron microscopy (SEM, JEOL JSM-7600F; Tokyo, Japan).The element and band diagrams were determined by XPS (PHI-5300; ESCA). Fluorescence spectra were performed on a Shimadzu F-4500 fluorescence spectrophotometer. UV–visible absorption spectra were measured on a UV-5900PC spectrophotometer (METASH). Specific surface area and pore size distribution of the microspheres were calculated by using the BET and BJH methods, respectively. Adsorption of Hg2+ on different fluorescent SiO2 microspheres was tested by atomic absorption spectrometry ICE 3500 (Thermo Fisher Scientific).
Synthesis of Fluorescent Microspheres
BODIPY derivatives B1 and BB were prepared according to the literature.37 BC was prepared from 5-bromoindole by the Vilsmeier–Haack reaction. SiO2 microspheres are prepared, etched, and −NH2 group functionalized. Finally, fluorescent porous silica particles were obtained by introducing fluorophores through the reaction between −NH2 and BODIPY derivatives. The synthetic route is shown in Scheme 1.
Acknowledgments
The authors would like to thank the financial support of National Natural Science Foundation of China (NSFC, no. 41573106) and China–Romania bilateral research collaboration project (43-12) of the Ministry of Science and Technology of China.
Supporting Information Available
The Supporting Information is available free of charge on the ACS Publications website at DOI: 10.1021/acsomega.9b02647.
1H NMR and FTIR spectra of B1, BB, and BC, mass spectrum of B1, BB, and BC, UV–visible spectrum of SiNBB, cell imaging of SiNBIT and SiNBIO, and XPS spectral distribution of different microspheres (PDF)
The authors declare no competing financial interest.
Supplementary Material
References
- Wang M.; Sun Z.; Yue Q.; Yang J.; Wang X.; Deng Y.; Yu C.; Zhao D. An Interface-Directed Coassembly Approach To Synthesize Uniform Large-Pore Mesoporous Silica Spheres. J. Am. Chem. Soc. 2014, 136, 1884–1892. 10.1021/ja4099356. [DOI] [PubMed] [Google Scholar]
- Ciraci S.; Batra I. P. Metallization of Silicon upon Potassium Adsorption. Phys. Rev. Lett. 1987, 58, 1982–1985. 10.1103/physrevlett.58.1982. [DOI] [PubMed] [Google Scholar]
- Sassi W.; Dhouibi L.; Berçot P.; Rezrazi M. The effect of SiO2 nanoparticles dispersion on physico-chemical properties of modified Ni–W nanocomposite coatings. Appl. Surf. Sci. 2015, 324, 369–379. 10.1016/j.apsusc.2014.10.142. [DOI] [Google Scholar]
- Nakahara Y.; Hayashizaki M.; Watanabe M.; Tamai T.; Kimura K. Synthesis of Spherical SiO2@TiO2 Core-Shell Nanoparticles with Anatase-Type Crystallinity and High Aqueous Dispersibility and Their Photocatalytic Properties. Bull. Chem. Soc. Jpn. 2015, 88, 133–138. 10.1246/bcsj.20140236. [DOI] [Google Scholar]
- Collodetti G.; Gleize P. J. P.; Monteiro P. J. M. Exploring the potential of siloxane surface modified nano-SiO2 to improve the Portland cement pastes hydration properties. Constr. Build. Mater. 2014, 54, 99–105. 10.1016/j.conbuildmat.2013.12.028. [DOI] [Google Scholar]
- Griffin M.; Nayyer L.; Butler P. E.; Palgrave R. G.; Seifalian A. M.; Kalaskar D. M. Development of mechano-responsive polymeric scaffolds using functionalized silica nano-fillers for the control of cellular functions. Nanomed.: Nanotechnol. Biol. Med. 2016, 12, 1725–1733. 10.1016/j.nano.2016.02.011. [DOI] [PMC free article] [PubMed] [Google Scholar]
- Grigoropoulou G.; Stathi P.; Karakassides M. A.; Louloudi M.; Deligiannakis Y. Functionalized SiO2 with N-, S-containing ligands for Pb(II) and Cd(II) adsorption. Colloids Surf., A 2008, 320, 25–35. 10.1016/j.colsurfa.2008.01.007. [DOI] [Google Scholar]
- Maurice V.; Slostowski C.; Herlin-Boime N.; Carrot G. Polymer-Grafted Silicon Nanoparticles Obtained Either via Peptide Bonding or Click Chemistry. Macromol. Chem. Phys. 2012, 213, 2498–2503. 10.1002/macp.201200326. [DOI] [Google Scholar]
- Ekmekcioglu C.; Prohaska C.; Pomazal K.; Steffan I.; Schernthaner G.; Marktl W. Concentrations of seven trace elements in different hematological matrices in patients with type 2 diabetes as compared to healthy controls. Biol. Trace Elem. Res. 2001, 79, 205–219. 10.1385/bter:79:3:205. [DOI] [PubMed] [Google Scholar]
- Schümann K.; Elsenhans B. The impact of food contaminants on the bioavailability of trace metals. J. Trace Elem. Med. Biol. 2002, 16, 139–144. 10.1016/s0946-672x(02)80015-3. [DOI] [PubMed] [Google Scholar]
- Corbi J. J.; Froehlich C. G.; Strixino S. T.; Santos A. D. Bioaccumulation of metals in aquatic insects of streams located in areas with sugar cane cultivation. Quim. Nova 2010, 33, 644–648. 10.1590/s0100-40422010000300030. [DOI] [Google Scholar]
- Guo X.; Wei Z.; Penn C. J.; Xu T.; Wu Q. Effect of Soil Washing and Liming on Bioavailability of Heavy Metals in Acid Contaminated Soil. Soil Sci. Soc. Am. J. 2013, 77, 432–441. 10.2136/sssaj2011.0371. [DOI] [Google Scholar]
- Porento M.; Sutinen V.; Julku T.; Oikari R. Detection of Copper in Water Using On-Line Plasma-Excited Atomic Absorption Spectroscopy (AAS). Appl. Spectrosc. 2011, 65, 678–683. 10.1366/10-06051. [DOI] [PubMed] [Google Scholar]
- Hohimer J. P.; Hargis P. J. Picogram detection of cesium in aqueous solution by nonflame atomic fluorescence spectroscopy with dye laser excitation. Appl. Phys. Lett. 1977, 30, 344–346. 10.1063/1.89393. [DOI] [Google Scholar]
- Hsu K.-C.; Hung C.-C.; Lee C.-F.; Hsu P.-F.; Huang Y.-L. Combining microdialysis sampling and inductively coupled plasma mass spectrometry for dynamic monitoring of trace metal ions during bacterial growth periods. RSC Adv. 2014, 4, 51716–51721. 10.1039/c4ra07941h. [DOI] [Google Scholar]
- Klockenkämper R.; Becker M.; Bubert H. Determination of the heavy-metal ion-dose after implantation in silicon-wafers by total reflection X-ray fluorescence analysis. Spectrochim. Acta, Part B 1991, 46, 1379–1383. 10.1016/0584-8547(91)80187-8. [DOI] [Google Scholar]
- Wu W.-B.; Wang M.-L.; Sun Y.-M.; Huang W.; Cui Y.-P.; Xu C.-X. Fluorescent polystyrene microspheres with large Stokes shift by fluorescence resonance energy transfer. J. Phys. Chem. Solids 2008, 69, 76–82. 10.1016/j.jpcs.2007.07.132. [DOI] [Google Scholar]
- Lian Q.; Zheng X.-F.; Hu T.-F. Preparation and adsorption properties of magnetic CoFe2O4–chitosan composite microspheres. Russ. J. Phys. Chem. A 2015, 89, 2132–2136. 10.1134/s0036024415110096. [DOI] [Google Scholar]
- Lv C.; Bai S.; Wen S. Preparation of novel magnetic fluorescent microspheres from copperas and fluorescence enhancement with zinc ions. J. Sol-Gel Sci. Technol. 2014, 69, 520–527. 10.1007/s10971-013-3252-x. [DOI] [Google Scholar]
- Qiu T.; Song J.; Fan L.-J. Preparation of fluorescent microspheres via layer-by-layer self-assembly. J. Controlled Release 2015, 213, e103–e104. 10.1016/j.jconrel.2015.05.173. [DOI] [PubMed] [Google Scholar]
- Wang H.; Sun L.; Li Y.; Fei X.; Sun M.; Zhang C.; Li Y.; Yang Q. Layer-by-Layer Assembled Fe3O4@C@CdTe Core/Shell Microspheres as Separable Luminescent Probe for Sensitive Sensing of Cu2+ Ions. Langmuir 2011, 27, 11609–11615. 10.1021/la202295b. [DOI] [PubMed] [Google Scholar]
- Shen Q.; Liu M.; Yu D.; Gao H.; Liu Y.; Liu X.; Zhou J. Preparation of Fluorescent Thiol Group-Functionalized Silica Microspheres for the Detection and Removal of Silver Ions in Aqueous Solutions. J. Chin. Chem. Soc. 2018, 65, 591–596. 10.1002/jccs.201700307. [DOI] [Google Scholar]
- Lv C.; Wen S. M.; Bai S. J.; Wang Y. J. Preparation of Novel Magnetic Fluorescent Microspheres Obtained by Chemical Method. Adv. Mater. Res. 2013, 726–731, 1591–1595. 10.4028/www.scientific.net/amr.726-731.1591. [DOI] [Google Scholar]
- Cline J. P.; Mendenhall M. H.; Black D.; Windover D.; Henins A. The Optics and Alignment of the Divergent Beam Laboratory X-ray Powder Diffractometer and its Calibration Using NIST Standard Reference Materials. J. Res. Natl. Inst. Stand. Technol. 2015, 120, 173–222. 10.6028/jres.120.013. [DOI] [PMC free article] [PubMed] [Google Scholar]
- Beier H. T.; Coté G. L.; Meissner K. E. Modeling whispering gallery modes in quantum dot embedded polystyrene microspheres. J. Opt. Soc. Am. B 2010, 27, 536–543. 10.1364/josab.27.000536. [DOI] [Google Scholar]
- Álvarez-Diaz A.; Salinas-Castillo A.; Camprubi Robles M. A.; Costa-Ferna Ndez J. M.; Pereiro R.; Mallavia R.; Sanz-Medel A. Conjugated Polymer Microspheres for “Turn-Off”/“Turn-On” Fluorescence Optosensing of Inorganic Ions in Aqueous Media. Anal. Chem. 2011, 83, 2712–2718. 10.1021/ac103268r. [DOI] [PubMed] [Google Scholar]
- Ding Y.; Zhu W.; Xu Y.; Qian X. A small molecular fluorescent sensor functionalized silica microsphere for detection and removal of mercury, cadmium, and lead ions in aqueous solutions. Sens. Actuators, B 2015, 220, 762–771. 10.1016/j.snb.2015.05.113. [DOI] [Google Scholar]
- Wang W.; Zhang Y.; Yang Q.; Sun M.; Fei X.; Song Y.; Zhang Y.; Li Y. Fluorescent and colorimetric magnetic microspheres as nanosensors for Hg2+ in aqueous solution prepared by a sol–gel grafting reaction and host–guest interaction. Nanoscale 2013, 5, 4958–4965. 10.1039/c3nr00580a. [DOI] [PubMed] [Google Scholar]
- Wang Z.; Wu D.; Wu G.; Yang N.; Wu A. Modifying Fe3O4 microspheres with rhodamine hydrazide for selective detection and removal of Hg2+ ion in water. J. Hazard. Mater. 2013, 244–245, 621–627. 10.1016/j.jhazmat.2012.10.050. [DOI] [PubMed] [Google Scholar]
- Peng C.; Cheng X.; Chen S.; Li X.; Li T.; Zhang D.; Huang Z.; Zhang A. A Facile method to Prepare Monodispersed CdS/SiO2 Composite Microspheres and Investigation on Their Photocatalytic Properties. Photochem. Photobiol. 2012, 88, 1433–1441. 10.1111/j.1751-1097.2012.01188.x. [DOI] [PubMed] [Google Scholar]
- Sun Y.-Q.; Wang P.; Liu J.; Zhang J.; Guo W. A fluorescent turn-on probe for bisulfite based on hydrogen bond-inhibited CN isomerization mechanism. Analyst 2012, 137, 3430–3433. 10.1039/c2an35512d. [DOI] [PubMed] [Google Scholar]
- Song Z.-K.; Dong B.; Lei G.-J.; Peng M.-J.; Guo Y. Novel selective fluorescent probes for sensing Zn2+ ions based on a coumarin Schiff-base. Tetrahedron Lett. 2013, 54, 4945–4949. 10.1016/j.tetlet.2013.07.015. [DOI] [Google Scholar]
- She M.; Wu S.; Wang Z.; Ma S.; Yang Z.; Yin B.; Liu P.; Zhang S.; Li J. Exploration of congeneric Hg(II)-mediated chemosensors driven by S–Hg affinity, and their application in living system. Sens. Actuators, B 2017, 247, 129–138. 10.1016/j.snb.2017.03.015. [DOI] [Google Scholar]
- Zhou Y.; Deng M.; Du Y.; Yan S.; Huang R.; Weng X.; Yang C.; Zhang X.; Zhou X. A novel cationic triazatetrabenzcorrole: selective detection of mercury(II) by nucleic acid-induced aggregation. Analyst 2011, 136, 955–961. 10.1039/c0an00927j. [DOI] [PubMed] [Google Scholar]
- Shan Z.; Hui-ping H.; Ji-yuan L.; Fang H. The Coordination Structure of the Extracted Nickel(II) Complex with a Synergistic Mixture Containing Lix63 and Versatic10. J. Chin. Chem. Soc. 2017, 64, 205–216. 10.1002/jccs.201600825. [DOI] [Google Scholar]
- Colthup N. B. Spectra-Structure Correlations in the Infra-Red Region. J. Opt. Soc. Am. 1950, 40, 397–400. 10.1364/josa.40.000397. [DOI] [Google Scholar]
- Sun W.; Chen R.; Cheng X.; Marin L. Bodipy-based chemosensors for highly sensitive and selective detection of Hg2+ ions. New J. Chem. 2018, 42, 19224–19231. 10.1039/c8nj04817g. [DOI] [Google Scholar]
Associated Data
This section collects any data citations, data availability statements, or supplementary materials included in this article.