

Summary
The brains of humans and other mammals are highly vulnerable to interrupted blood flow and decreased oxygen levels. Here, we describe the restoration and maintenance of microcirculation and molecular and cellular functions of the intact porcine brain under ex vivo normothermic conditions up to 4-hours postmortem. We developed an extracorporeal pulsatile-perfusion system and a hemoglobin-based, acellular, non-coagulative, echogenic, and cytoprotective perfusate that promotes recovery from anoxia, reduces reperfusion injury, prevents edema, and metabolically supports the energy requirements of the brain. Employing this system, we observe preservation of cytoarchitecture; attenuation of cell death; and restoration of vascular dilatory and glial inflammatory responses, spontaneous synaptic activity, as well as active cerebral metabolism in the absence of global electrocorticographic activity. These findings demonstrate that under appropriate conditions the isolated, intact large mammalian brain possesses a yet underappreciated capacity for restoration of microcirculation and molecular and cellular activity after a prolonged postmortem interval.
Many mammalian species have large, energy-demanding brains that are highly susceptible to anoxia and cessation of blood flow1–3. Both human and experimental animal studies have shown that oxygen stores, global electrical activity, and consciousness are lost within seconds of interrupted blood flow, while glucose and ATP stores are depleted within minutes4–8. Unless perfusion is quickly restored, multiple deleterious mechanisms lead to widespread membrane depolarization, loss of ionic homeostasis, mitochondrial dysfunction, and excitotoxic accumulation of glutamate9,10. Convergence of these factors has been widely proposed to initiate a progressive, and largely irreversible, cascade of apoptosis, necrosis, and axonal damage4–9.
However, several observations have questioned the inevitability of neural cell death minutes, or even hours, after cessation of brain perfusion. Firstly, tissue specimens with sufficient viability for cell and organotypic slice cultures11–13, as well as for electrophysiological recordings14, have been harvested from human and other mammalian brains hours postmortem. Secondly, mitochondria remain functional for up to 10 hours postmortem in human cerebral cortical tissue15. Thirdly, in cats and macaques, one hour of complete global ischemia can be followed by neuronal, electrophysiological, and metabolic recovery after reperfusion16–19. Lastly, full neurological recovery from prolonged asystole has been reported in the case of hypothermia20, and recent clinical findings suggest that thrombectomies performed up to 16-hours post-ischemic insult can result in favorable patient outcomes21. These data suggest that the initiation and duration of cell death after anoxia/ischemia may span a longer temporal interval than is currently appreciated, allowing for a multifaceted intervention that could halt the progression of damaging cellular programs initiated by the global insult. Therefore, we postulate that under the appropriate conditions, certain molecular and cellular functions in the intact brain may retain at least partial capacity for ex vivo restoration after a prolonged postmortem interval (PMI).
To test this hypothesis, we developed a surgical procedure, perfusate, and custom-pulsatile perfusion device that can restore and maintain microcirculation and cellular viability in the large mammalian brain under ex vivo normothermic condictions (37°C) after an extended PMI. This system is herein referred to as BrainEx (BEx). To determine whether restoration and maintenance of cell viability is possible, we simultaneously engineered a hemoglobin-based, acellular, echogenic, and non-coagulative cytoprotective. In order to develop all aspects of this technology, we reasoned that a prudent approach would be to utilize post-mortem brain specimens from USDA-regulated food processing facilities, which would otherwise be discarded. Therefore, we applied this technology to the isolated, and largely ex cranio, 6–8 month old porcine (Sus scrofa domesticus) brain 4-hours (h) postmortem. Employing this technological approach, we observed attenuation of cell death and preservation of anatomical and neural cell integrity. We also found restoration of specific cellular functions as indicated by vascular and glial responsiveness to pharmacological and immunogenic interventions, spontaneous synaptic activity, and active cerebral metabolism in the absence of global electrocorticographic activity.
These findings demonstrate that with the appropriate intervention, the large mammalian brain retains a previously underappreciated capacity for restoration of certain molecular and cellular functions multiple hours after circulatory arrest. Additionally, this platform potentially offers investigators the latitude to conduct prospective, functional ex vivo studies in the intact brain that would otherwise be limited to static histological, biochemical, or structural investigation.
Results
Overview of BEx technology
The technology consists of a perfusion system that circulates either a control (CP) or BEx perfusate (Supplementary Table 1, 2) under physiological waveforms (Fig. 1a). Due to their acellularity, the perfusates were supplemented with echogenic particles, allowing for ultrasonographical assessment of perfusion dynamics. The system is amenable to any custom waveform within 20–140 mmHg and 40–180 pulsations per minute, as well as temperatures ranging from 3–42°C (Fig. 1a; Extended Data Fig. 1; Supplementary Table 3). Moreover, the platform supports organ homeostasis through the use of continuous hemodiafiltration (Supplementary Table 4) and gas infusion mechanisms. We also developed a surgical procedure for isolating the brain and its vascular supply above the medulla oblongata (Extended Data Fig. 2a-c). After 4h postmortem, referred to as length prior to perfusion (4h LPP), the carotids were connected to the BEx system (Fig 1b; Extended Data Fig. 2d, e) and ex vivo circulation was maintained for a length of perfusion of 6h (6h LOP), totaling 10h postmortem.
Figure 1 |. BEx perfusion system and experimental workflow.
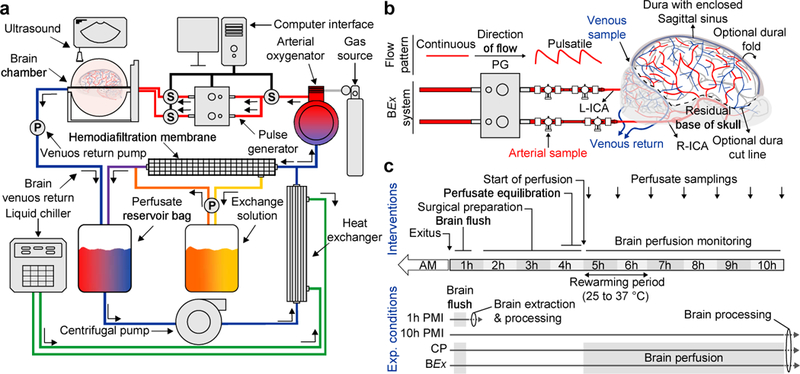
a, Simplified schematic of the closed-circuit perfusion system. S, Sensor; P, Pump. b, Connection of the porcine brain to the perfusion system via the arterial lines. The pulse generator transforms continuous flow to pulsatile perfusion. Ports for arteriovenous sampling are delineated. In this preparation, the dura can be carefully cut and flapped medially to access brain for experimentation; surgical care is taken to ensure cortical bridging veins remain intact. Right (R)- and left (L)-internal carotid arteries (ICA); PG, Pulse Generator. c, Schematic depicting the experimental workflow and conditions. AM, ante-mortem.
Overall, our study consisted of 4 experimental groups: (1) perfusion with CP; (2) perfusion with BEx perfusate; (3) unperfused control maintained in cranio at room temperature for 10h PMI, replicating the total PMI of groups 1 and 2; and, (4) flushed 1h PMI, representing the shortest tissue processing times under current logistics (Fig. 1c). Global electrophysiological monitoring was performed throughout the experimental timeline.
Microcirculation and vascular dilatory functionality
We first sought to determine whether the methodology could reintroduce flow within the brain after an extended PMI, and, if so, the maximum LOP that could be sustained utilizing the CP under normothermic conditions. We observed 4 phases of flow dynamics, representing a progressive deterioration of the low-resistance waveform structure and decrease in mean flow velocity (Extended Data Fig. 3a). Invariantly, after a 6h LOP, brains subjected to CP exhibited no-flow (Extended Data Fig. 3a-c), high vascular resistance (Extended Data Fig. 3d, e), and severe tissue destruction and edema. Since we could not maintain perfusion without incurring further brain damage, we concluded that this 6h perfusion timeframe would be most appropriate to conduct the experiments described herein.
Color Doppler analysis of BEx-perfused brains revealed robust flow through the major arteries of the brain (Fig. 2a-c). Waveform analysis of the pericallosal artery under BEx perfusion demonstrated a biphasic, low-resistance structure (Fig. 2d; Extended Data Fig. 3c) that was maintained throughout the 6h LOP (Extended Data Fig. 3c-e). These findings suggest that the microvasculature under BEx perfusion is patent and maintaining flow, which was substantiated by the presence of BEx perfusate in the extensive cortical vasculature (Fig. 2e). To assess capillary flow, we tested vessel refill by compression and release of the central cortical vein, observing prompt refilling (Fig. 2e). Global micro-computed tomography angiography (CTA) revealed the presence of contrast agent in major arteries and smaller arterioles (Fig. 2f-h; Video 1; Extended Data Fig. 4). High-resolution scanning of the hippocampus further corroborated the patency of pre-capillary arterioles (Extended Data Fig. 5a).
Figure 2 |. Ex vivo restoration of microcirculation and vascular dilatory functionality.

a-c, Composite Doppler ultrasound demonstrating perfusion of large cerebral arteries: ICA, Internal Carotid Artery; PCoA, Posterior Communicating Artery; ACA, Anterior Cerebral Artery; PA, Pericallosal Artery; MCA, Middle Cerebral Artery; PCA, Posterior Cerebral Artery; BA, Basilar Artery. d, Power waveform analysis of the PA. PSV, Peak Systolic Velocity; EDV, End Diastolic Velocity; RI, Resistance Index. Data are from the representative brain in (a-c). e, Gross anatomical inspection of the cortical vessels before central vein compression (precompression; arrow) and swift venous refilling (arrowhead) after release. f-h, Maximum intensity projections of global computed tomography angiography in BEx conditions. Scale bar, 1 cm. i, Color Doppler analysis demonstrating flow increase in PA after administration of nimodipine (0.3 mg). j, Quantification of relative percentage flow change pre- and post-nimodipine administration from brains in (i). Ratio paired t-test; (*P=0.034); t=5.275; df=2. n=3 independently run brains. Data are means ± SEM. Reproducibility information is found in Methods.
We hypothesized that if the BEx system successfully reperfused microcirculation, the hemoglobin fluorescent signal within the vessels would be comparable to the 10h PMI conditions, which involved no flushing and retained sequestered whole blood within the vasculature. We found robust hemoglobin signal throughout the entire vascular tree, including capillaries, in the hippocampus and prefrontal neocortex of both BEx and 10h PMI brains. Contrastingly, there was negligible fluorescence in CP and 1h PMI controls, precluding the possibility that the intravascular signal observed in the BEx perfusate was a result of residual blood (Extended Data Figs. 5b; 6a). Additionally, utilizing electron microscopy (EM), we found that nearly all vessel lumens identified were filled with BEx perfusate in both the hippocampus and prefrontal neocortex (Extended Data Figs. 5c, d; 6b, c). An analogous pattern of reperfusion was observed within the occipital neocortex and cerebellar cortex, indicating successful reperfusion throughout the brain via cannulation of the bilateral carotid arteries (Extended Data Fig. 7a-c).
We next sought to investigate whether the brain vasculature remained responsive to pharmacological intervention. To test this hypothesis, we administered a bolus of nimodipine, an L-type voltage-gated calcium channel antagonist that increases cerebral blood flow22, while maintaining arterial pressure constant. We observed a significant and sustained increase in flow velocity post-intervention, indicating that the vasculature retained dilatory functionality in response to pharmacological stimulation (Fig. 2i, j). Overall, these data demonstrate restoration and maintenance of microvascular patency and dilatory functionality for 6h following a 4h LPP.
Preservation of tissue integrity
We next assessed global anatomical integrity via T1-weighted MRI. Under BEx-perfused conditions, the neuroanatomical structure remained intact as demonstrated by normal ventricular size, preserved gray-white matter contrast, and delineation among anatomical landmarks (Fig. 3), which were comparable to in vivo brains23–25. We next measured the length of the corpus callosum (LCC) and anterior-posterior diameter (APD) as proxies of ventricular size, and observed differences across conditions. As compared to BEx perfusion, 10h PMI brains exhibited a deterioration of gray-white matter contrast, reduction in LCC and APD, as well as collapse of the lateral ventricles (Fig. 3) indicative of decreased water content26; we also found dropout signals commonly observed in scans of postmortem brains undergoing decomposition27. CP brains demonstrated pervasive tissue damage, decreased global signal intensity, ventricular expansion, along with increased LCC, APD, and gray-white matter contrast, indicating the presence of edema (Fig. 3). To assess the extent of edema, we measured the wet-to-dry weight of cerebral samples (Fig. 3b), and observed a decrease in water content in 10h PMI controls and an increase in CP conditions, with no significant difference between 1h PMI and BEx perfusate brains (Fig. 3c).
Figure 3 |. Magnetic resonance imaging of brains.
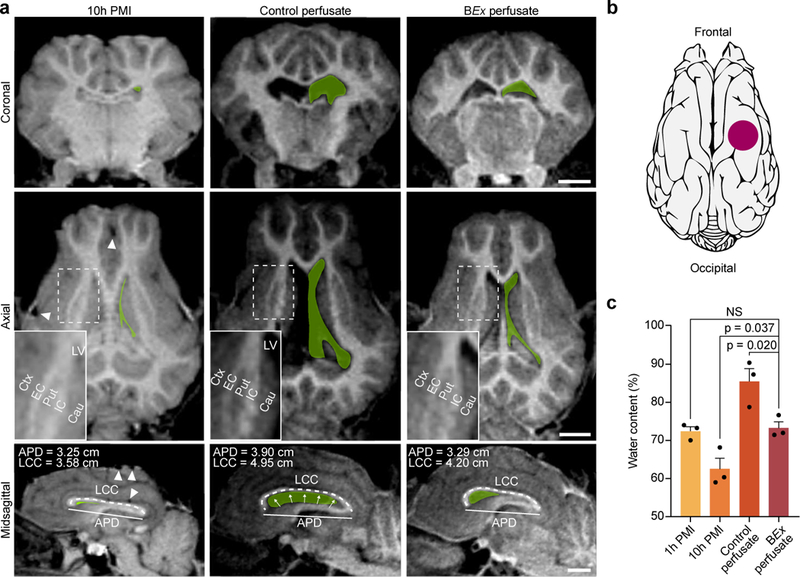
a, T1-weighted MRI scans of perfused and unperfused porcine brains. In all three planes, the contours of the lateral ventricles (LV) are traced in green. Arrowheads indicate drop-out signals due to gas accumulation. Insets depict subcortical anatomical landmarks as well as gray-white matter contrast. Length of Corpus Callosum (LCC) and Anterior-Posterior Diameter (APD) are measured as proxies for brain swelling and ventricular morphology. Cau, caudate; Ctx, cerebral cortex; EC, external capsule; IC, internal capsule; Put, putamen. Scale bar, 1 cm. b, Schematic representing the location of tissue sampling for wet-to-dry mass analysis. c, Quantification of tissue water content across experimental groups. One-way ANOVA (P=0.001, F[3,8]=14.55) with post-hoc Dunnett’s adjustment; n=3 brains per condition; All data are means ± SEM. Reproducibility information is found in Methods.
We subsequently asked whether the observed anatomical preservation was reflected in the cytoarchitectonic integrity of brain regions highly susceptible to anoxia/ischemia, such as the hippocampus, neocortex, and cerebellum28–30. In BEx specimens, Nissl staining of these areas revealed preserved integrity, which were most comparable to 1h PMI controls (Fig. 4a; Extended Data Fig. 7d, e; Extended Data Fig. 8a). Additionally, hippocampal subregions (Fig. 4a, b), neocortical layers (Extended Data Figs. 7d; 8a), and cerebellar laminae (Extended Data Fig. 7e) remained structurally intact with the histological appearance of the porcine brain31,32; contrastingly, 10h PMI and CP conditions exhibited stark deterioration.
Figure 4 |. Analysis of neuronal cell morphology, density, and caspase 3 activation.

a, Hippocampal Nissl stains depicting regional cytoarchitectural integrity. Insets display an example of a vessel filled with BEx perfusate, as compared to control perfusate conditions. b, Representative fields of view (left), with a higher magnification field (right) corresponding to the boxed area of the CA1 and dentate gyrus regions. Scale: 200 μm (left), 50 μm (right). c, d, Quantification of neuronal cell density in both the CA1 and dentate gyrus. One-way ANOVA (CA1 P<0.001, F[3,20] = 65.03; Dentate gyrus P<0.001, F[3,20] = 49.7) with post-hoc Dunnett’s adjustment; P-values specified within; n=6 brains per condition. e, Quantification of the percentage of cells that exhibit swollen morphology in the CA1 region. One-way ANOVA (P<0.001, F[3,20] = 113.6) with post-hoc Dunnett’s adjustment; P-values specified within; n=6 brains per condition. f, Confocal images of immunofluorescent staining for the pan-neuronal marker NeuN (green) and activated caspase 3 (actCASP3; green) with DAPI counterstain (blue), in the CA1 field (left) and dentate gyrus (right). For actCASP3 images, the right image depicts an enlargement of the boxed area. Scale bar, 50 μm (NeuN DAPI), 50 μm (actCASP3 DAPI; left), 10 μm (actCASP3 DAPI; right). g, h, Normalized quantification of the percentage of actCASP3 positive nuclei in the CA1 and dentate gyrus. CA1: One-way ANOVA (P<0.001, F[3,20] = 117.1) with post-hoc Dunnett’s adjustment; P-values specified within; n=6 brains per condition. Dentate gyrus: One-way ANOVA (P<0.001, F[3,20] = 31.19) with post-hoc Dunnett’s adjustment; P-values specified within; n=6 brains per condition. All data are means ± SEM. Reproducibility information is found in Methods.
Next, we examined the ultrastructure of the hippocampal CA1 field, a region selectively vulnerable to anoxia/ischemia and other of insults28,29. We observed preservation of robust structures such as myelin, adherence junctions, and post-synaptic density across all conditions, while also finding evidence of vacuolization, cytoplasmic lysis, and membrane disruption in all groups, even in 1h PMI controls (Extended Data Fig. 9). However, we found that some mitochondria in 1h PMI tissue, and the vast majority of mitochondria in 10h PMI and control-perfused specimens, displayed swollen morphology with damaged cristae. In contrast, mitochondria in BEx perfusion conditions demonstrated normal ultrastructure (Extended Data Fig. 9a, b). We also observed continuity of the cellular membrane covering ependymal ciliary structures along with well-defined nuclei in BEx specimens, which were most comparable to 1h PMI controls (Extended Data Fig. 9a, b). Examination of myelin revealed relatively well-preserved ultrastructure in all conditions, yet with evidence of axonal vacuolization. However, oligodendrocytes in BEx-perfused brains contained structurally normal cytoplasm with demarcated rough endoplasmic reticulum and mitochondria with electron-dense matrices; this was in contrast to the more marked cellular damage observed in control tissues (Extended Data Fig. 9b).
Neuronal viability and myelinated axons
As assessed by Nissl staining, CA1 neurons from BEx conditions exhibited classical pyramidal cell structure, whereas neurons from 1h PMI controls demonstrated an overall swollen morphology, suggesting that BEx perfusion mitigated the signs of cytotoxic edema-associated ischemic injury (Fig. 4b). This is in contrast to neurons from 10h PMI and CP brains, which underwent atrophy and disintegration. Quantification of the proportion of cells in the CA1 field exhibiting a swollen morphology revealed a decrease under BEx perfusion, as compared to other groups (Fig. 4e). This same pattern of cytoarchitectonic integrity was observed in the dentate gyrus (Fig. 4b). Assessment of neuronal density also revealed comparable values between BEx and 1h PMI controls in both CA1 and dentate gyrus, with a reduction in 10h PMI and CP conditions (Fig. 4c, d). Immunostaining for the pan-neuronal marker NeuN/RBFOX3 independently confirmed the same pattern of neuronal integrity in both hippocampal regions (Fig. 4f).
Given that the BEx perfusate comprises anti-apoptotic agents, we next examined the extent of apoptosis by assessing nuclear localization of activated caspase 3 (Fig. 4f; actCASP3). As compared to BEx samples, we found an increase in the percentage of nuclei positive for actCASP3 in CA1 and dentate gyrus across all control groups, indicating that the BEx formulation diminished caspase 3 activation (Fig. 4g, h). However, in comparison to 1h PMI controls, we also observed a reduction in caspase 3 activation in both 10h PMI and CP samples. A time-course analysis in the hippocampus and prefrontal neocortex with increasing PMI’s revealed a robust nuclear localization of actCASP3 in both regions after a 1h PMI in the unperfused brain, comparable to 1h PMI flushed controls (Extended Data Fig. 10c; Fig. 4f). This staining pattern decreased with longer PMI’s, which coincided with the progressive cellular degeneration in both 10h PMI and CP brains. Therefore, we conclude that the observed decrease in actCASP3 in these conditions is likely caused by protein degradation following extensive cellular disintegration (Extended Data Fig. 10c).
Analysis of the prefrontal neocortex also provided evidence for preservation of both neuronal cell morphology and density under BEx conditions (Extended Data Fig. 8a-h). Moreover, despite having undergone axotomy, Betz cells in the primary motor cortex retained their magnopyramidal morphology only under BEx conditions (Extended Data Fig. 8b). Staining for the excitatory neuronal marker, neurogranin (NRGN), also revealed preserved excitatory neuron density between BEx and 1h PMI controls, as compared to other conditions which demonstrated clear cellular destruction (Extended Data Fig. 8e, i). Immunofluorescent analysis for the inhibitory neuronal marker, GAD1, revealed preserved cell density among BEx, 1h PMI, and 10h PMI controls as compared to CP conditions. While we did not find a decrease in GAD1-positive neurons in the 10h PMI condition, these cells displayed contracted cytoplasmic morphology and a loss of somal GAD1-positive axonal contacts (Extended Data Fig. 8f, j). Similar to the hippocampus, we also observed increased nuclear localization of actCASP3 in all control conditions as compared to BEx (Extended Data Fig. 10a, b).
We next examined whether neocortical axons remained intact by examining single myelinated fiber orientation and bundling. Myelinated fibers are normally organized into a rectilinear lattice in which the most prominent fibers are oriented orthogonally to the pial surface, forming bundles33; ischemic injury is known to disrupt fiber orientation, at least in part through edema-related displacement34. Analysis of myelin basic protein (MBP) revealed a greater proportion of fibers in 1h PMI and CP conditions that formed angles between 0–60° to the pial surface as compared to BEx specimens (Extended Data Fig. 11a, b). Given the absence of edema, we expected and observed no difference in fiber orientation between 10h PMI and BEx samples (Extended Data Fig. 11a, b). We next examined the number of fiber bundles per unit area in cortical specimens, and found a decrease in the bundle density under 10h PMI and CP conditions, demonstrating an overall deterioration of axonal architecture; in contrast, there was no difference in bundle density between 1h PMI and BEx perfusion (Extended Data Fig. 11a, c).
Glial structure and inflammatory functionality
We next asked whether glial cells maintained their structural and functional properties. Staining for astrocytic (GFAP) and microglial (IBA1) markers evidenced fragmented signal with signs of cellular destruction in 10h PMI brains and CP brains; however, under BEx-perfusion conditions, we observed robust GFAP and IBA1 staining throughout the neocortex, most similar to 1h PMI controls (Fig. 5a, b). We also observed evidence of microgliosis (i.e. phagocytic-like microglia with shortened, thickened processes) compared to 1h PMI conditions (Fig. 5a, b). Overall quantification of IBA1- and GFAP-positive cells in the neocortex demonstrated preservation of glial cell numbers in BEx perfusion conditions (Fig. 5c, d). Consistent with the neocortex, GFAP and IBA1 staining was similarly conserved in the hippocampal CA1 and dentate gyrus (Extended Data Fig. 12).
Figure 5 |. Analysis of glial cells and inflammatory response.

a, Confocal tile scans of immunofluorescent stains for astrocytes (GFAP; red) and microglia (IBA1; green) in the prefrontal neocortex. L1, layer 1; L2–6, layers 2–6; WM, white matter. Scale bar: 200 μm. b, Confocal maximum intensity projections of GFAP- and IBA1-positive cells. Scale bar: 50 μm. c, d, Quantification of IBA1+ and GFAP+ cell density, respectively. One-way ANOVA (IBA1+; P<0.001, F[3,20]=38.77; GFAP+; P<0.001, F[3,20]=28.09) with post-hoc Dunnett’s adjustment. P-values are specified within; n=6 brains per group. e, Schematic representing the location of LPS injection. f, Multiplex inflammatory cyto/chemokine profile analysis in the prefrontal neocortex following intracortical LPS injection. One-way ANOVA (IL-8 P=0.016, F[2,6]=8.793; IL-6 P=0.013, F[2,6]=9.709; IL-1β P=0.015, F[2,6]=9.312) with post-hoc Dunnett’s adjustment; P-values are specified within. Kruskal-Wallis (IL-1α P=0.036; KW = 6.563) with post-hoc two-stage step-up method of Benjamini, Krieger, and Yekutieli; P-values are specified within; n=3 brains per group. All data are means ± SEM. Reproducibility information is found in Methods.
Previous studies have shown that in vivo injection of lipopolysaccharide (LPS), a toll-like receptor-4 agonist and immunogenic agent, into the neocortex leads to glial cell activation and release of inflammatory molecules35,36. To test whether glial cells were functionally viable under each experimental condition, we injected LPS into the prefrontal neocortex of 10h PMI, CP, or BEx brains (Fig. 5e). We then processed the injected area for multiplex analysis of inflammatory chemokines and cytokines after 6h of perfusion. Under BEx conditions, we observed an increase in interleukin (IL)-1α, IL-1β, IL-6, and IL-8 relative to other conditions (Fig. 5f). Taken together, these findings indicate that BEx perfusion is not only capable of maintaining astroglial and microglial cell numbers, but also restoring their inflammatory responses.
Synaptic organization and neuronal activity
We next examined the ultrastructural organization of synapses, and neuronal activity in the hippocampus. EM analyses indicated preservation of pre-synaptic vesicular structure in BEx conditions as compared to 1h PMI, with substantial degradation in 10h PMI and CP brains (Fig. 6a). Quantification of the number of presynaptic vesicles revealed a maintenance of the vesicular pool only in BEx and 1h PMI conditions, in contrast to 10h PMI and CP (Fig. 6b).
Figure 6 |. Analysis of neurons and global cerebral metabolism.

a, EM microphotographs of the synapses within stratum oriens of the hippocampal CA1 field. Arrows represent the post-synaptic density while orange shading depicts the presynaptic terminal. Scale bar, 1μm. b, Quantification of the number of synaptic vesicles present in presynaptic terminal. One-way ANOVA (P<0.001, F[3,8]=27.13) with post-hoc Dunnett’s adjustment, P-values specified within; each data point is a mean of n=9 synapses per brain; 3 brains per condition; NS, not significant. All data are means ± SEM. c-e, Electrophysiological properties of pyramidal neurons following 6h LOP with BEx perfusate after 4h LPP. c, Representative sub- and supra-threshold voltage traces in response to hyperpolarizing and depolarizing rectangular pulses of current from a resting potential of −70 mV. Stimulus size is indicated on the left. d, Family of inward and outward currents mediated by voltage-dependent sodium and potassium channels. e, Representative traces of spontaneous excitatory postsynaptic currents (sEPSCs) recorded at a holding potential of −70mV. f, Electrocorticograph (ECoG) recording traces of BEx-perfused brain, representative isoelectric signals presented from the designated surface electrodes are displayed to the right. g, Arteriovenous gradients and cerebral rate of oxygen consumption from BEx-perfused brains. n=4 brains; n=4 paired measurements per time-point per arterial and venous sample. Two-tailed paired t-test with df=3 for each time point; *P<0.05, **P<0.01, ***P<0.001. CMRO, One-way ANOVA (P=0.014, F[2,9]=7.185) with post-hoc Dunnett’s adjustment. *P=0.008. All data are means ± SEM. Further statistics and reproducibility information are found in Methods.
We employed whole-cell patch-clamp in acute hippocampal slice cultures to assess neuronal functionality after a 6h LOP with BEx perfusate. Neuronal membrane capacitance (Cm=125±43 pF), input resistance (Rin=195±63 MΩ), membrane time constant (τm=32.3±8.4 ms), and membrane resting potential (Vm=−71.2±7.0 mV) were in accordance with previous values37. All recorded neurons responded to supra-threshold depolarizing current stimuli with repetitive action potential firing (Fig. 6c) and expressed both voltage-gated fast Na+ currents and delayed-rectifier K+ currents (Fig. 6d). In addition to these passive properties, the action potential parameters (spike threshold=−48±0.6 mV, spike amplitude=80.3±6.1 mV, spike duration=1.58±0.24 ms) were similar to previous literature38, and we observed the presence of spontaneous excitatory postsynaptic currents (sEPSCs) at a holding potential of −70 mV (Fig. 6e). Thus, after a 6h LOP following a 4h LPP, we found the presence of functionally-viable pyramidal neurons in the hippocampus.
Monitoring of electrical activity from the dorsal surface of the brain utilizing clinical-grade surface grid electrodes and electrocorticography (ECoG), aka intracranial electroencephalography (EEG) system, revealed that spontaneous global activity did not reemerge as evidence by isoelectric ECoG activity during the course of BEx perfusion. This indicates that the organization and/or summation of synaptic activity of individual neurons was inadequate to elicit detectable network activity as assessed by ECoG (Fig. 6f).
Global cerebral metabolism
Lastly, with evidence of the resurgence of several cellular functions in BEx perfused brains, we assessed the capacity of the platform to restore and maintain global metabolic activity by comparing arterial and venous samples throughout the course of experimentation. Arteriovenous gradients demonstrated consistent consumption of glucose and oxygen as the brains reached normothermia, with a concurrent production in CO2 and a physiological drop in pH39. At normothermia, the average oxygen and glucose expenditure was approximately 2 mL/min/100 g and 6.5 mg/min/100 g tissue, respectively (Fig. 6g). Additionally, we observe an arteriovenous gradient of approximately −1 mmol/L of lactate (Fig. 6g). Moreover, venous concentrations of both sodium and potassium normalized into physiological range after one hour of perfusion, potentially signaling the restoration of active Na+/K+ homeostasis (Fig. 6g). Overall, these data evidence a resurgence of global cerebral metabolism in intact postmortem brains under ex vivo normothermic conditions.
Discussion
Here, we describe and utilize a technology to demonstrate that brain microcirculation as well as specific molecular and cellular functions in the large mammalian brain can be restored under ex vivo normothermic conditions after an extended PMI (see Supplementary Discussion for extended text). These findings indicate that molecular and cellular deterioration in the brain after circulatory arrest seems to follow a protracted process, instead of occurring within a singular, narrowly defined temporal window. Perhaps most importantly, with the appropriate intervention, the brain retains a greater potential for metabolic and neurophysiologic resilience to anoxic/ischemic insult than is currently appreciated.
Indeed, our findings pertaining to metabolism, pH, and cerebral perfusion are consistent with the physiological parameters previously reported to be significant for recovery in non-human primates subjected to global ischemia17. While our data reveal isoelectric global activity after 6h of perfusion following a 4h PMI, previous studies have reported a proportional delay between global ischemia times and the reemergence of global electrical activity in vivo16,40–43. In the absence of longer perfusion studies, it is still uncertain whether the technology we describe herein is capable of restoring global activity (i.e., ECoG/EEG). However, the use of various antagonists contained within the BEx perfusate may potentially exert an overall inhibitory tone within the brain, further dampening global network activity. Nevertheless, an important distinction previously discussed44 must be underscored so as to distinguish between resuscitation of neurophysiological activity and of integrated brain functions (i.e., neurological recovery). The observed restoration of molecular and cellular processes following 4h of global anoxia/ischemia should not be extrapolated to signify resurgence of normal brain function. Indeed, quite the opposite: at no point did we observe the kind of organized global electrical activity associated with awareness, perception, or other higher-order brain functions.
The present technology requires further development, optimization, and implementation, including studies with longer perfusion times. In doing so, this experimental approach may have broader applications than those described herein, and can potentially help bridge the gap between basic neuroscience and clinical research, especially as it pertains to the human brain. This raises important ethical considerations that must be addressed by researchers, institutional boards, and funding agencies, requiring the establishment of unambiguous standard operating procedures to preclude the possibility of re-activating remnant awareness or brain functions that may result in inadvertent suffering45. Additionally, it is imperative for investigators to procure mammalian brains in an ethical manner consistent with all current and future regulations governing the humane termination of the animal sources.
Overall, the ability to utilize this technology to investigate neurophysiological recovery of the brain following global anoxia/ischemia provides the basis for a new class of tools. Employing this approach, we find encouraging evidence that brings into question the time-course and cessation of molecular and cellular brain functions following prolonged circulatory arrest. Future studies and considerations will spur further development and implementation of this technology to study broad scientific questions in the large, intact brain.
Supplementary Discussion
Previous studies have reported in cranio perfusion of dog and macaque brains using allogenic whole-blood48,49, as well as the isolation50 and perfusion14,51,52 of the small rodent (i.e., guinea pig) brain utilizing oxygenated cerebrospinal fluid. However, these earlier studies were conducted under hypothermic conditions on acute brain tissue preparations with negligible PMI, in contrast to the present study. To the best of our knowledge, this is the first report describing the use of a synthetic cytoprotective perfusate and extracorporeal perfusion system to restore and maintain microcirculation as well as molecular and cellular functions in the large mammalian brain under normothermic ex vivo conditions following an extended PMI.
Pioneering studies have sought to ascertain the maximal duration of global cerebral ischemia after which the capacity for functional recovery is lost40,42,43,53. Interestingly, there were significant discrepancies between tolerated normothermic ischemia times, ranging from 4 minutes to 1 hour17,40,42,43,53,54. These heterogeneous observations suggest that cerebral survival is not dependent on ischemia time per se, but is instead related to variations in the recovery process (i.e., extent of post-anoxic/ischemic reperfusion, aggregation of blood particles, etc). Therefore, it may be possible that with the appropriate interventional protocol, the large mammalian brain could withstand longer periods of circulatory arrest. Indeed, our findings indicate that oxygen consumption rates were comparable with previously reported in vivo values55, but glucose consumption was higher than normal56 yet in line with rates reported for brains recovering from prolonged global ischemia57. This mismatch could be due to replenishing brain glucose stores or fueling anaerobic mechanisms. Yet, since previous work has shown that younger animals demonstrate a greater resilience to anoxic injury than adults58, it is important to note that we used brains from young animals (i.e., 6–8 months of age). Therefore, the increased plasticity in younger-aged brains may have contributed to the overall cellular recovery.
As has been extensively reviewed, tissue damage after global, or focal, ischemia results from the convergence of pathophysiological processes such as loss of ionic homeostasis, excitotoxicity, inflammation, and oxidative stress, leading to cell death2,10,59,60. Hence, we reasoned that the most appropriate approach would include a combination of cytoprotective agents and technical innovations that circumvents many obstacles associated with in vivo reperfusion or ex vivo perfusion with whole blood, including immune-mediated tissue damage, blood cell obstruction, and microemboli formation. Moreover, the technology described herein affords greater latitude for intervention with real-time manipulation of gas and electrolyte concentrations, temperature dynamics (i.e. rate of rewarming), and drug administration without the constraints of systemic side-effects in a model organism with a brain composition similar to humans.
With its gyrated neocortex, readily-accessible vasculature, and complex morphology, the porcine brain represents an appropriate experimental model for studying brain responses to global anoxia as it more closely resembles the human brain than the smaller, lissencephalic brain of rodents, which are commonly studied mammalian species. Indeed, one of the most notable differences between pig and rodent brains is the difference in gray-to-white matter ratio, with the rodent brain comprising only 14% white matter, while pig and human approximate 30 and 50%, respectively61,62. This particular distinction influences not only neurovascular architecture and function, but also neural connectivity, metabolism, and physiology, which play critical roles in anoxic/ischemic injury63,64.
In light of this, we developed a perfusate formulation that addresses independent mechanisms that affect both gray and white matter to diminish cell injury and death. In conjunction, we also designed the perfusate as an echogenic, hypertonic, and acellular solution containing an anti-coagulative hemoglobin-based oxygen carrier in order to prevent edema formation, ensure proper delivery of nutritive and protective agents throughout the cerebral microvasculature, and allow ease of detecting perfusion status via ultrasonography, which distinguishes the BEx perfusate from previously reported organ preservation solutions65–69. Indeed, the acellularity of the BEx perfusate may have allowed ubiquitous microvascular reperfusion by circumventing many of the thrombotic, vascular, perivascular, and/or hemolytic mechanisms previously reported to cause perfusion deficits70–72. While we cannot at this time exclude the possible development of delayed cellular death previously reported to start 72-hours to weeks after ischemia73,74, we have also incorporated both anti-apoptotic and anti-necroptotic agents within the perfusate to halt the progression of these delayed mechanisms. In doing so, we observe a decrease in cell death in brains subjected to BEx conditions, in comparison to control- or 10h PMI brains.
These compounds, as well as neuronal activity blockers, are washed out during the preparation of acute hippocampal slices for electrophysiological recordings, possibly explaining the observed discrepancy between whole cell patch-clamp recordings and global cortical activity. Further studies are necessary to determine whether the brain is able to regain global cortical activity following 4h of global anoxia/ischemia with the current experimental set up (i.e. anoxic/ischemic times, length of perfusion, and/or perfusate formulation). With prolonged perfusion studies, we should be able to obtain a better understanding of how cells within the brain respond to extended time-points. It is remotely conceivable that as the technology develops, the brain may regain the ability to emit global (i.e., ECoG/EEG) signals. However, in the event that this were to occur, we were ready to swiftly implement countermeasures, including, but not limited to, reducing the temperature of the brain in order to diminish metabolic activity, and/or administering general anesthetic agents (which were already at-hand during the perfusion experiments) to maintain an isoelectric ECoG reading.
This immediate response to a potential positive ECoG reading follows from our position that we are not aiming to maintain awareness in the ex vivo brain, if it were to be re-established. Given the possibilities for inadvertent suffering posed by the restoration and maintenance of remnant awareness, any experimentation aimed at purposefully maintaining a brain with global electrical activity, without the aforementioned interventions to diminish such activity, should be subject to more extensive ethical review. It is our firm belief that this platform can have broad use in addressing various neuroscientific questions that are independent of global electrical activity. Indeed, more liberal and productive use of this platform is likely to be made if standard operating procedures are in place to address the ethical questions associated with re-establishing and maintaining global network activity.
Overall, these findings indicate that a combinatorial approach to addressing anoxic/ischemic injury is capable with restoring and maintaining certain molecular and cellular functions in the brain even hours postmortem. Utilizing this system, investigators can begin addressing long sought-after questions pertaining to the large mammalian brain, such as conducting mesoscale tracings of long-range connections, while also performing novel pharmacological penetrance and kinetic studies.
Methods
BEx technology.
Overview of the perfusion system.
The closed-circuit perfusion system is comprised of a main perfusion circuit and parallel afferent and efferent homeostatic circuits, including hemodiafiltration and gas-infusion mixers, the details of which are described in Extended Data Fig. 1 and Supplementary Table 3. The main perfusion circuit is driven by a centrifugal pump which produces a continuous, high-flow rate stream of perfusate that supplies a custom-built pulse generator (BioMedical Innovations, LLC; Denver, NC). Through mechanical force, the pulse-generator transforms the flow to a pulsatile flow, supplying the brain, which is housed in a uniquely-designed spherical chamber that opens into two hemispherical components. When securely closed, the chamber is temperature-controlled and maintains a relative humidity level ~95% to prevent the surface of the brain from drying, since the brain is not bathed in fluid. The pulse generator is connected to a power logic controller that is fully integrated with a user-friendly computer interface that allows the investigator to fully customize the pulsatile flow to mimic any cardiac waveform ranging from 20–140 mmHg and 40–180 beats per minute. The parallel afferent homeostatic circuits are made out of optical, potentiometric and ultrasound sensors for analysis of electrolytes, metabolites, pH, gases and flow rate. The efferent circuit is comprised of hemodiafiltration, temperature control, gaseous, and electronic controller circuit all of which maintain homeostatic parameters in specified range.
Control perfusate formulation.
750 mL of isotonic solution consisting of the components detailed in Supplementary Table 1. In order to make the control perfusate echogenic, we also incorporated the micrometer-sized polymeric particles as described above.
BEx perfusate formulation.
750 mL of Hemopure® (HbO2 Therapeautics), supplemented with the components detailed in Supplementary Table 2. In order to make the perfusate echogenic, we incorporated micrometer-sized polymeric particles (0.1mL; Polyson-L; Miltenyi Biotec; Germany; 130–095). The rheological properties of the perfusate are also detailed in Supplementary Table 2.
Hemodiafiltration system and exchange solution composition.
The pressure-driven hemodiafiltration system is incorporated into the main arterial circuit as described in Extended Data 1a (components 27–36). Briefly, the arterial perfusate is subjected to hemodiafiltration through a high-flux polysulfone 15 capillary dialyzer (Braun; Melsungen, Germany; Cat#: 7204102) against a custom dialysis exchange solution with a 1:1 (vol:vol) exchange ratio at a rate of 50mL/min. The exchange solution is composed of 4.5 L of solution comprising of the elements described in Supplementary Table 4. For control perfusate conditions, we utilized the same isotonic solution as described in Supplementary Table 1. Before connecting the brain to the BEx system, this perfusate and exchange solution are subjected to hemodiafiltration and allowed to equilibrate for 15 mins at 25°C. Equilibrated values of the BEx perfusate are listed in Supplementary Table 2. The exchange solution is maintained under temperature-controlled condition and rewarmed at the same rate as perfusate (6°C/hour).
Preparation and perfusion of the post-mortem porcine brain.
This research project did not involve the use of live animals; therefore, after close communication with Yale’s Institutional Animal Care and Use Committee (IACUC) and program leadership, including bioethicists, it was determined that oversight of the IACUC was not required. In the spirit of the Three R’s (Replacement, Reduction, Refinement), we utilized brain tissue retrieved from post-mortem animals used for food production. No animals died for this study. Additionally, this research was approved by the Environmental Health & Safety Committee at Yale University. As described in the Reporting Summary, approximately 300 post-mortem pig brains were utilized from USDA-approved food production facilities during the process of technology development (surgical approach, vascular isolation, device configuration, perfusate formulation and so on) and the final study described herein. Once the technology was optimized and stark differences in tissue integrity were observed in pilot studies, 32 independent brains underwent BEx perfusion, data from which are presented herein. Out of these 32 BEx-perfused brains, the sample size (including the matched sample number of brains subjected to 1h PMI, 10h PMI, and CP conditions) used for each analysis is delineated within either each respective figure legend or in the further information described belowFor all experimental groups, domestic pigs (Sus scrofa domesticus; 6–8 months of age [~50–75 kg]) raised for food production were stunned by electrical shock and subsequently sacrificed by exsanguination according to USDA regulations. The animals were then decapitated postmortem at the C3 vertebrae, and the skin, along with some of the connective tissue and musculature, was removed from the remainder of the skull in keeping with USDA guidelines. For 1h PMI, control perfusate, and BEx perfusate conditions, the common carotid arteries were isolated, connected and secured with male luer-locks. In total, these procedures required approximately 10 mins to complete, thereby subjecting brains to this length of warm anoxia. Following, the head was flushed of residual blood utilizing a 3-staged clearance protocol. In total, 8-liters of a heparinized (2800 UI in total), isotonic phosphate-buffered saline solution (20°C) were used. The 3-stages consisted of a (1) 2-liter gravity flush at ~100 mmHg (5 mins); (2) 4-liter closed-loop flow-driven flush at 600 mL/min (20 mins); and, (3) 2-liter gravity flush at ~100 mmHg (5 mins). For 1h PMI conditions, the maxilla was then removed and the remainder of the head (dorsal side down) was stored in a plastic biological hazard bag and transported (10–15 min) on ice until performing the brain extraction (5 min) with subsequent tissue processing (10 min) as described below. For control and BEx perfusate conditions, the head was processed, stored, and transported on ice as described for 1h PMI controls. Upon arrival to the laboratory’s surgical suite, the head remained on ice during the surgical procedure, except for conducting the craniectomy, which was performed at room temperature (30 mins). For 10h PMI controls brains, the skin and maxilla were removed from the head as described above. A craniectomy was then performed as described below; however, the head was not flushed with the heparinized solution, and was stored at room temperature for the remainder of the experiment. For control or BEx perfusate conditions, the maxilla and anterior portion of the mandible were removed, followed by the zygomatic process of the temporal and malar bones, and the supraorbital process. Next, the remaining portion of the mandible and the vertebral column (C1-C3) were disarticulated at the temporomandibular and atlanto-occipital joint, respectively. The remaining soft tissues of the oral gastrointestinal tract as well as the temporal and occipital soft tissues were carefully excised. To selectively perfuse the brain and prevent vascular shunting, the external carotids, occipital, ophthalmic, vertebral, and basilar (at the medullary level) arteries, along with ramus anastomoticus, arteria anastomotica, and smaller branches originating from the ascending pharyngeal artery, were dissected and ligated and/or cauterized, leaving the internal carotid patent. Subsequently, a craniectomy consisting of the removal of the complete dorsal, partial frontal (until olfactory bulbs), partial lateral (until superior gyrus of temporal lobes), and partial occipital (supratentorial) portions of the cranium was performed utilizing neurosurgical power system (Microspeed uni control unit; Aesculap; Center Valley, PA; Cat#: GD670) equipped with a uni XS motor (Cat#: GD675), disposable Codman perforator (DePuySynthes; West Chester, PA) and Hi-Line XS dura guard drill holder (Aesculap; Cat#: GB741R). Briefly, burr holes in the dorsal, frontal, lateral, and occipital skull were made utilizing a Codman disposable perforator; the holes were subsequently connected using bore drill with dura guard and/or a surgical bone crusher, and the bone flap was carefully removed using a Penfield dissector #3 to expose the dura. Only the ventral portion of the cranium was left intact. Due to the surgical preparation, the cranial nerves were transected and the spinal nerve roots and dorsal root ganglia were removed, which precludes potential transmission of noxious stimuli to the brain. The epidural temperature following the craniectomy ranged from 12–15°C. Each carotid artery was then connected to the perfusion system at the commencement of the perfusion protocol (4 hours following death). For a visual diagram of each of the four experimental groups utilized, refer to Extended Figure 1c for protocol schematic. Control- and BEx-perfused brains were allowed to rewarm from 25°C to 37°C at a rate of 6°C per hour, utilizing a range of pressure parameters (50/35–80/65 mmHg, 72 beats per minute). In all experiments, the cerebral perfusate flow was monitored and arterial pressure adjusted appropriately to maintain relatively constant cerebral flow.
Global electrophysiological monitoring of the brain.
Global electrical activity was measured during the experimental timeline via two independent methods: commercially-available, clinical-grade BIS™ brain monitoring system (Medtronic) and 5×4 platinum-iridium electrode grid (AD-Tech; Racine, Wisconsin; Cat #: FG20C-SP10X-000) with an exposed surface of 2.8 mm and a 10 mm contact spacing covering the frontal-parieto-occipital convexity. ECoG recordings were taken using Neurolink Natus amplifiers with sampling frequency of range of 1024–2000 Hz. The recordings were reviewed with various filter settings including the conventional low frequency filter of 1 Hz and the high frequency filter up to 1000 Hz. In addition, to analyze infra-slow and high frequency oscillations, 0.05 Hz and 80 Hz low frequency filters were used, respectively. No global electrical activity was observed in the brain before the start of perfusion. While increasing the temperature of the brain, and throughout the perfusion protocol, electrical activity was also examined to confirm that the brain did not display activity consistent with remnant awareness. Researchers kept general anesthetic agents readily available for immediate administration in the unlikely event that any positive global electrical activity were to be detected in the course of experimentation; this administration would have been aimed at reducing the signal to non-detectable levels, precluding the possibility of remnant awareness in the brain. No such electrical activity was ever observed.
Ultrasonography.
Brain circulation was monitored via Triplex Ultrasonography (Spectral Doppler, Color Doppler, and B-mode) utilizing the LOGIQ e portable ultrasound system (General Electric; Milwaukee, WI) and an 8L-RS linear array probe (General Electric). Power waveform analysis was done utilizing mechanical index of 0.4–0.5, thermal index of 0.2–0.3, steer 0°, angle 0°. For reproducibility and comparisons all measurements were conducted on pericallosal artery anterior to the genu of corpus callosum.
Computed tomography (CT) cerebral angiogram.
Micro-computed tomography (microCT) cerebral angiogram.
Approximately 100 mL of 10% bismuth nanoparticle (Sigma-Aldrich) in 10% gelatin was made as previously described46 and was injected into the brain following BEx perfusion. This contrast agent was delivered bilaterally via common carotid arteries by a pressurized injection apparatus. Following, the brain was immediately immersed into ice water for at least 30 minutes, and then post-fixed in 10% formalin for 72h. The residual ventral bone was removed and the whole brain was scanned using a U-SPECT-II/CT scanner (Milabs; Utrecht, The Netherlands). Volumetric Micro-CT data were acquired with an x-ray source of 55 kVp tube voltage, 370 μA tube current, 11 × 11 detector binning model, 40 ms exposure per projection for contrast-enhanced CT acquisitions. A single frame of 720 projections for 5:03 min of continuous x-ray exposure was used. Volumetric micro-CT images were post-processed using PMOD software, version 3.8 (PMOD Technologies; Zurich, Switzerland).
After, the hippocampus was extracted, and high-resolution micro-CT scan was performed using a specimen microCT scanner (Trifoil Imaging; Chatsworth, CA). Images were acquired with 2960 ms exposure time per view, at 60 kV, 100 mA, 360°, 1200 views, and 1×1 binning. The raw micro CT images with a vff format was initially reconstructed with Microview software, with calibrated attenuation values for air, water, and bone. The reconstructed images were saved in DICOM format and further post-processed using RadiAnt DICOM Viewer software (Medixant; Poznan, Poland) to extract maximum intensity projection images.
Magnetic resonance imaging (MRI).
High-resolution anatomical scans were performed on 10h PMI brains and on brains perfused with control- and BEx-perfusate immediately following perfusion termination. Scans were acquired using Siemens Prisma Fit 3T scanner and 64 channel head/neck coil with MP-RAGE, a three-dimensional, T1-weighted, gradient-echo sequence: FOV= 257 × 257, resolution 0.8×0.8×0.8 mm, TR=2400 ms, TE=1.35 ms, IT=1000, flip angle=8, averages=2, number of slices= 112.
Measurement of tissue water content.
Brain water content was measured as previously described47. Briefly, a stereotyped piece of cerebrum was microdissected from the same region the brain following the termination of each experimental protocol. The mass of the wet tissue was immediately measured and recorded, and the tissue was placed in a non-humidified incubator (37°C) for 24 hours. Following, the dry mass was measured and recorded. Percent water content was determined by the following equation: 100*(wet mass – dry mass) / wet mass.
Tissue processing and histology.
Tissue preparation.
Following the termination of each experimental protocol, the whole brain was extracted from the remaining portion of the ventral cranium and processed according to the methods described below.
Tissue processing and cresyl violet staining.
After extraction, whole brain samples were sectioned into ~0.5cm-thick slabs and immersion-fixed in a solution containing 4% (w/v) paraformaldehyde for approximately one hour, after which fixative was removed and fresh fixative was added. Tissue was allowed to fix for 72h at 4°C with gentle shaking. Tissue was then washed in 0.1M PBS (1x) and dropped stepwise into 15% sucrose followed by 30% sucrose supplemented with 0.05% sodium azide. Regions of interest were microdissected from the tissue slabs and sectioned into 40 micron sections under PBS utilizing a vibratome (Leica Biosystems; Buffalo Grove, IL; model: VT1000S). Sections were mounted on TruBond 380 adhesive slides and allowed to dry overnight at room temperature. Tissue was rehydrated in ddH2O; serially dehydrated through 70%, 95%, and 100% ethyl alcohol; and cleared in histoclear II (National Diagnostics; Cat #: HS-202) for 3 mins in each step. Sections were then rehydrated through ddH2O for 3 mins in each solution and stained in 0.1% cresyl violet solution for 5 minutes. Sections were quickly rinsed in ddH2O and then differentiated in 70%, 95%, and 100% ethyl alcohol and cleared in histoclear II. Sections were coverslipped with EcoMount (Biocar medical; Cat #: EM897L). Slides were scanned using the Aperio CS2 Pathology Slide Scanner (Leica) at a magnification of 40x. Images were viewed and processed with the Aperio Imagescope Software (Leica).
Immunohistochemistry.
Coronal tissue sections from the appropriate regions of the pig brain were processed as described above. For all staining procedures except for intravascular hemoglobin fluorescence detection, tissue sections from each experimental group were co-stained on the same slide. After mounting, tissue sections (except for those utilized for MBP staining) were subjected to antigen retrieval for 2 hours utilizing the Retreiver System (Electron Microscopy Sciences [EMS]; Hatfield, PA; Cat #: 62700–10) and R-Buffer A (EMS; 62706–10; 1x) or R-Buffer AG (EMS; 62707–10; 1x). For DAB staining, sections were incubated in 1% hydrogen peroxide/PBS to quench endogenous peroxidase activity. Afterwards, tissue was blocked and permeabilized in PBS containing 5% (v/v) donkey serum, 3% (w/v) bovine albumin serum, 0.1% (w/v) glycine, and 0.1% (w/v) lysine with 0.2% (v/v) Triton X-100 for one hour at room temperature with gentle rotation. Tissues were then incubated overnight at 4°C with gentle rotation with the primary antibodies directed against the following antigens: IBA1 (rabbit anti-iba1; 1:1000; Wako; 019–19741), GFAP (mouse anti-GFAP; 1:500; Sigma; G3893); RBFOX3/NeuN (rabbit anti-NeuN; 1:2000; Abcam; ab177487); cleaved Caspase-3 (rabbit anti-actCASP3; 1:200; CST; 9661S); MBP (rat anti-MBP; 1:200; BioRad; MCA409S); neurogranin (NRGN) (sheep anti-NRGN; 1:50; R&D systems; AF7947); and GAD1 (goat anti-GAD1; 1:50; R&D systems; AF2086). Unbound primary antibodies were removed by washing with PBS containing 0.3% (v/v) Triton X-100 (3 × 10 min); washing jar was rinsed clean with ddH2O in between washes. Antibody/antigen complexes were visualized after incubation with Alexa Fluor 594 or 488–conjugated donkey or biotinylated secondary antibody anti-rabbit, mouse, sheep, rat, or goat immunoglobulin G secondary antibody (1:500) in blocking solution. Unbound secondary antibodies were removed by washing with PBS containing 0.3% (v/v) Triton X-100 (3 × 5 min); washing jar was again rinsed clean with ddH2O in between washes. Except for in the cleaved Caspase-3 time-course analysis, background signal was quenched utilizing the autofluorescence eliminator reagent (Cat #: 2160; Millipore) per the manufacturer’s instructions. Tissue sections were then simultaneously coverslipped and counterstained with Fluoromount-G containing DAPI (Southern Biotech; Birmingham, AL; Cat #: 0100–01) for immunofluorescence imaging. Alternatively, for DAB staining, sections were incubated with avidin-biotin-peroxidase complex (Vectastain ABC Elite kit; Vector Laboratories) for 1 hour at room temperature. Finally, sections were washed in PBS (3 × 15 min) and signals were developed using a DAB peroxidase substrate kit according to the manufacturer’s protocol (Vector Laboratories). Coverslips were mounted with VectaShield (Vector Laboratories; Burlingame, CA; Cat #: H-1400) or Permount (Fischer Scientific) and sealed with nail polish, unless counterstained with Fluoromount-G.
Intravascular fluorescence.
Sections from regions of interest from each experimental group underwent antigen retrieval as described above, blocked and permeabilized in PBS containing 5% (v/v) donkey serum, 3% (w/v) bovine albumin serum, 0.1% (w/v) glycine, and 0.1% (w/v) lysine with 0.3% (v/v) Triton X-100 for one hour at room temperature with gentle rotation. Subsequently, sections were incubated with Alexa Fluor 488–conjugated donkey anti-rabbit antibody (1:500) for one hour at room temperature with gentle rotation. Unbound secondary antibodies were removed by washing with PBS containing 0.3% (v/v) Triton X-100 (3 × 5 min). Tissue sections were simultaneously coverslipped and counterstained with Fluoromount-G containing DAPI (Southern Biotech; Birmingham, AL; Cat #: 0100–01) for immunofluorescence imaging.
Microscopy and image processing.
Tissue sections were imaged utilizing an LSM880 confocal microscope (Zeiss; Jena, Germany) equipped with a motorized stage using 10x (0.3 NA) or 20x (0.8 NA) objective lenses with identical settings across all experimental conditions. Lasers utilized: Argon 458, 488, and 514; Diode 405; and DPSS 561–10. The DPSS 561–10 laser intensity was increased during imaging of the control perfusate samples for the intravascular hemoglobin fluorescence study in order to obtain a background signal comparable to other groups. Images were acquired at either 1024 × 1024 or 2048 × 2048 pixel resolution. Images are either representative confocal tile scans, high-magnification maximum intensity Z-stack projections (approximately 7–9 micron stacks; ~1 micron per z-step), or high-magnification confocal images. Alternatively, histological images were acquired with an Aperio CS2 Pathology Slide Scanner (Leica; Wetzlar, Germany) as described above. Image adjustments were uniformly applied to all experimental conditions in Zeiss Zen. Digitized images were assembled in Zeiss Zen, ImageScope, and Adobe Illustrator.
Histological data analysis and quantification.
Immunofluorescence (cell analysis and quantification).
Confocal tile scans (using the 10x or 20x objectives described above) of tissue sections stained for GFAP, IBA1, NRGN, and GAD1 were normalized to identical image surface area, randomized, and subsequently analyzed by a blinded observer for the objects of interest. For all cell marker stains, cells were excluded if below a minimum intensity level, exhibiting cellular vacuoles greater than the size of the nucleus, or demonstrating clear cellular destruction.
Nuclear localization of activated caspase 3 (actCASP3).
Multiple confocal images (10x) were taken per region of interest and processed as described above. A blinded observer manually counted DAPI+ objects and actCASP3+ objects utilizing the cell counter function in ImageJ software (NIH). DAPI+ and actCASP3+ objects were initially normalized to image surface area, and subsequently actCASP3+ objects were normalized to number of DAPI+ objects per image surface area.
Cresyl violet staining (cell counts and morphology).
A blinded observer processed the images as described above and manually counted objects of interest and morphology utilizing the cell counter function in ImageJ software (NIH). Cells were again excluded if below a minimum intensity level, exhibiting cellular vacuoles greater than the size of the nucleus, or demonstrating clear cellular destruction.
Measurement of myelinated fibers.
Measurements of myelinated fiber orientation were made from (4x) brightfield images of MBP staining using the measure angle function in ImageJ. Representative images were accumulated from each biological replicate from all experimental groups and randomized. Measurements were made by a blinded observer from the white matter boundary to layer 1, which could be clearly delineated by the presence of dense horizontal fibers. The counting region analyzed was selected because fibers can be clearly identified, and are organized into a stereotyped rectilinear lattice amenable to systematic analysis. Angles corresponding to axon orientation were then measured relative to a straight line corresponding to the gray–white matter boundary, which runs roughly parallel to the pial surface in the region sampled. Polar histograms, binning, and frequency analysis of fiber angle were processed utilizing MATLAB software suite (Mathworks). For quantifying fiber bundle density, three representative (8x) brightfield images were taken from each biological replicate and randomized. A blinded observer counted the number of fiber bundles present per image. Fiber bundles were defined as a fasciculations of fibers oriented radially to the pial surface and traveling from cortical layer 2/3 to the underlying white matter. Bundle number was normalized by unit area of tissue.
Electron microscopy (EM).
Tissue samples sizing approximately 5 × 5 × 5 mm, and including predominately the ependymal layer, alveus, and stratum oriens of the CA1 hippocampus, were dissected and immersed in a fixative containing 4% paraformaldehyde and 1% glutaraldehyde in PBS pH 7.4 for 7 days at 4°C. Coronal sections of 100 μm thickness were cut with a vibratome. The sections were post-fixed with 1% OsO4, dehydrated in ethanol, in-block-stained with saturated uranil acetate during dehydration process, and then embedded in durcupan epoxy resin (Fluka, Buchs, Switzerland) on microscope slides and coverslipped. The durcupan-embedded sections were analyzed with a Zeiss Axioplan 2 microscope, and small pieces (~0.5×0.5 mm) containing region of interest were dissected and re-embedded into durcupan blocks for electron microscopic investigation. The samples were cut with a Reichert ultramicrotome into 70-nm-thick sections. Ultrathin sections were then stained with lead citrate, and evaluated and photographed in a JEM 1010 electron microscope (JEOL, Japan) equipped with a Multiscan 792 digital camera (Gatan, Pleasanton, CA, USA). Synapses in the hippocampal CA1 stratum oriens were imaged by a blind operator and 8 randomly chosen synapses per animal per condition (approximately 24 synapses/condition) were subjected to analysis by another blind observer. Number of vesicles within each synapse was averaged and statistically compared across groups.
Glial inflammatory response experiment.
Lipopolysaccharide injectionsa.
After the 4h LPP, 10h PMI, control-perfused, and BEx-perfused brains were injected in the dorsal prefrontal neocortex with 2.5 μL of a 1.0 μg/μL PBS solution of lipopolysaccharide (LPS; Sigma-Aldrich; Cat # L3024) at a rate of 0.5 μL/min with a 26-gauge Hamilton syringe attached to a micromanipulator and allowed to incubate for the duration of the 6h perfusion protocol. After the termination of the 6h, the injected regions were microdissected and flash-frozen in liquid nitrogen for subsequent processing for inflammatory molecules via Multiplex chemo/cytokine analysis as described below.
Multiplex chemo/cytokine analysis.
Microdissected samples of the dorsomedial prefrontal neocortex (~30 mg) from LPS-injected brains were allowed to thaw on ice in a Petri dish. Subsequently, the tissue was initially minced with a scalpel blade and homogenized in 0.5 mL of PBS (1x) using a Dounce homogenizer. Homogenates were microcentrifuged at 17,300 x g for 30 minutes at 4°C. Cleared supernatants were collected, and protein concentrations for each sample were quantified via a DC protein quantification kit according to manufacturer’s instructions (BioRad). Approximately 28 μg of protein were loaded onto the multiplex plate for each well, and the plate was processed and gated according to manufacturer’s instructions (Milliplex MAP Kit; Millipore; Cat#: PCYTMG-23K).
Brain slice electrophysiology.
Electrophysiological experiments were performed on acute hippocampal slice preparations from control and BEx perfused brains. The hippocampus was surgically isolated and the tissue was submerged in cold (<4°C), carboxygenated (95% O2:5% CO2) cutting solution (70 mM sucrose, 80 mM NaCl, 2.5 mM KCl, 26 mM NaHCO3, 15 mM glucose, 7 mM MgCl2, 1 mM CaCl2, 1.25mM NaH2PO4). Coronal 300-μm-thick slices were obtained through vibratome (Leica VT1200S; Buffalo Grove, IL) sectioning and allowed to equilibrate for at least 1 hour at room temperature in an incubation chamber filled with carboxygenated aCSF medium (125 mM NaCl, 2.5 mM KCl, 26 mM NaHCO3, 15 mM glucose, 1.3 mM MgCl2, 2.3 mM CaCl2, 1.25 mM NaH2PO4). All recordings were performed at 21–23°C on submerged slices perfused at 0.6 mL/min with aCSF. The recording chamber was mounted on an Axioskop FS2 microscope equipped with a 5x scanning objective and a 40x water-immersion objective (Zeiss), and connected to a CCD camera. Data were derived from hippocampal (CA3) pyramidal neurons using the whole-cell patch-clamp technique. Pipettes were produced from borosilicate glass capillary tubes (Sutter Instruments) by means of a horizontal puller (P-2000, Sutter instruments) and filled with the following intracellular solution: 130 mM K-gluconate, 4 mM NaCl, 2 mM MgCl2, 1 mM EGTA, 5 mM creatine phosphate, 2mM Na2ATP, 0.3 mM Na3GTP, 10 mM HEPES (pH 7.3 with KOH). Membrane voltage was corrected off-line for a calculated liquid junction potential of −10 mV. Series resistance was always compensated by 70–80% and monitored throughout the experiment. Recordings were made with a MultiClamp 700B amplifier (Molecular Devices) and digitized with a Digidata 1322 computer interface (Molecular Devices). Data were acquired using the software Clampex 9.2 (Molecular Device), sampled at 20 kHz, and filtered at 10 kHz. Cell capacitance (Cm) was calculated by integrating the capacitive current evoked by a −10 mV pulse. Neuronal input resistance (Rin) was calculated in the linear portion of the I–V relationship during depolarizing voltage responses near the resting potential. Active properties were assessed by recording the voltage responses to a series of hyperpolarizing and depolarizing current steps starting from a potential of −70 mV. The spontaneous excitatory (sEPSCs) post-synaptic currents recordings were carried out at the holding potentials of −70 mV. The mean amplitude of the events for each cell was computed using a log-normal function, while the mean frequency was obtained from the monoexponential fit of the inter-event intervals distribution. Data were analyzed with the software Clampfit 10.2 (Molecular Devices) and OriginPro 8 (Microcal).
Measurement of global cerebral metabolism.
Initial and hourly arterial and venous samples were collected from the arterial inlet line to the brain and the posterior sagittal sinus, respectively. 100 μL of each sample were immediately analyzed utilizing the i-STAT® clinical blood analyzer system (Abbott; Princeton, NJ) with CG4+ and EC8+ test cartridges. For CMRO calculations, the instantaneous arterial flow rate (AFR) was measured utilizing an in-line liquid flow meter (SLQ-QT500; Sensirion AG; Stafa, Switzerland) and adjusted to the average mass of the porcine brain (120 g) to yield the cerebral flow rate (CFR). The CMRO was then computed according to the following equation: CMRO = CFR*(AO2-VO2). The data was processed utilizing MATLAB.
Statistics and Reproducibility.
Statistical analysis, data plotting, and figure assemblya.
All data are reported as means ± SEM. Data analysis was conducted using two-tailed paired and unpaired t-test, one-way ANOVA with Dunnett’s post hoc or Kruskal-Wallis with post hoc two-stage step-up method of Benjamini, Krieger, and Yekutieli. Multiple comparisons were conducted in reference to the BEx perfusion group. Pairwise comparisons were performed utilizing two-tailed Chi-square analysis with Yates correction to compare ratios of fiber orientations across experimental groups. The number of brains per experimental group and appropriate statistical analyses are specified in each figure legend. All statistical analyses and data plotting were performed using GraphPad 7 (GraphPad Software, Inc.) or MATLAB. All figures were assembled and created using Adobe Illustrator CC (Adobe Systems, Inc.). Significance was set at P ≤ 0.05.
Further information.
Due to space limitations in each respective figure legend, further information regarding statistical values and reproducibility of the results are described below.
Figure 2 (a-c) Ultrasonography data are from a representative brain; the experiment was repeated in n = 15 independent brains with similar results. (e) Images are from a representative brain; the experiment was repeated in n = 3 independent brains with similar results. (f-h) Maximum intensity projections are from a representative brain; experiment was repeated in n=3 brains with similar results. (i) Ultrasonography data are from a representative brain; experiment was repeated in n=3 independent brains with similar results.
Figure 3 (a) Images are from representative brains; experiment was repeated n = 2 per condition.
Figure 4 (a) Images are from a representative brain per condition; the experiment was repeated in n=6 independent brains per condition with similar results. (b) Images are from a representative brain per condition; the experiment was repeated in n=6 independent brains per condition with similar results. (e) Images are from representative brains; the experiment was repeated in n=6 brains per condition with similar results.
Figure 5 (a) Images are from a representative brain per condition; the experiment was repeated in n=6 independent brains per condition with similar results. (b) Images are from a representative brain per condition; the experiment was repeated in n=6 independent brains per condition with similar results.
Figure 6 (a) Images are from a representative brain per condition; the experiment was repeated in n=3 independent brains per condition with similar results. (d-e) Data are electrical activity from representative neurons; electrical information was derived from a pool of n=5 recorded neurons across n=3 independent brains. (f) Data are from a representative brain; the experiment was repeated in n=4 independent brains. (g) O2 Content – P-values for hours 0–6, 0h: 0.021, 1h: 0.012, 2h: 0.001, 3h: 0.003, 4h: 0.001, 5h: <0.001, 6h: <0.001; t-values for hours 0–6, 0h: 4.421, 1h: 5.482, 2h: 13.046, 3h: 8.475, 4h: 12.642, 5h: 38.174, 6h: 50.492). Glucose – P-values for hours 0–6, 0h: 0.018, 1h: 0.001, 2h: <0.001, 3h: 0.011, 4h: 0.004, 5h: 0.001, 6h: 0.001); t-values for hours 0h: 0–6, 0h: 4.744, 1h: 11.619, 2h: 19.919, 3h: 5.564, 4h: 7.871, 5h: 13.339, 6h: 14.801). pCO2 – P-values for hours 0–6, 0h: 0.811, 1h: 0.309, 2h: 0.001, 3h: 0.049, 4h: 0.004, 5h: 0.01, 6h: 0.004); t-values for hours 0–6, 0h: 0.262, 1h: 1.222, 2h: 13.389, 3h: 3.201, 4h: 7.799, 5h: 5.827, 6h: 7.825). pH – P-values for hours 0–6, 0h: 0.211, 1h: 0.076, 2h: 0.001, 3h: 0.022, 4h: 0.002, 5h: 0.008, 6h: 0.004); t-values for hours 0–6, 0h: 1.584, 1h: 2.660, 2h: 15.269, 3h: 4.364, 4h: 10.605, 5h: 6.327, 6h: 8.012). K+ – P-values for hours 0–6, 0h: 0.030, 1h: 0.019, 2h: 0.011, 3h: 0.015, 4h: 0.036, 5h: 0.085, 6h: 0.051); t-values for hours 0–6, 0h: 3.890, 1h: 4.587, 2h: 5.681, 3h: 5, 4h: 3.612, 5h: 2.533, 6h: 3.150). Na+ – P-values for hours 0–6, 0h: 0.039, 1h: 0.015, 2h: 0.391, 3h: 0.215, 4h: 0.391, 5h: 0.058, 6h: 0.423); t-values for hours 0–6, 0h: 3.506, 1h: 5, 2h: 1, 3h: 1.567, 4h: 1, 5h: 3, 6h: 0.926). Lactate – P-values for hours 0–6, 0h: 0.028, 1h: 0.014, 2h: 0.021, 3h: 0.01, 4h: 0.01, 5h: 0.015, 6h: 0.018; t-values for hours 0–6, 0h: 4.027, 1h: 5.216, 2h: 4.435, 3h: 5.913, 4h: 5.807, 5h: 5.051, 6h: 4.744.
Extended Data
Extended Data Figure 1 |. Detailed schematic of the perfusion circuit.

Complete blueprint of the perfusion circuitry and system. Individual components are listed on the right-hand column and in Supplementary Table 3.
Extended Data Figure 2 |. Schematic representation of brain and vascular isolation procedure with connection to the perfusion system.

a, Diagram depicting the process for initially reducing the porcine skull after decapitation at the C3 vertebra. Dotted orange lines represent bone cuts through the naso-frontal suture, extending ventrally through the mandible (1); through the zygomatic process of the temporal bone and malar bone (2, 3); and, through the supraorbital process (4). Dotted maroon lines represent disarticulation of the temporomandibular and atlanto-occipital joints. Basilar artery (BA); vertebral artery (VA); occipital artery (OA); common carotid artery (CCA); external carotid artery (ECA); internal carotid artery (ICA); rete mirabile (RM); ophthalmic artery (OphA). Smaller vessels such as the ramus anastomoticus, arteria anastomotica, and variable branches originating from the ascending pharyngeal artery are not depicted. b, Arterial dissection, ligation, and removal of cranial soft tissue. To prevent vascular shunting, the VAs, BA, OAs, ECAs, and OphAs were ligated with sutures and/or cauterized along with the ramus anastomoticus, arteria anastomotica, and smaller branches originating from the ascending pharyngeal artery, while the ICAs were left patent. c, Neurocranial opening and reduction. Dark orange dots represent burr holes that are connected with dashed lines; orange shaded area represents area of the skull that is entirely removed at the end of the procedure. d, Mainly ex cranio whole brain connected to the BEx machine. e, Schematic representation of the components used for the connection of the porcine brain to the arterial ends of the BEx system.
Extended Data Figure 3 |. Perfusion dynamics.

a, Traces of the waveform cycle (systole and diastole) from each of the 4 phases observed under control perfusate conditions. Each phase occurs in chronological order during the experimental timeline, revealing a progressive deterioration of the low-resistance pressure waveform structure. In each phase, there is a corresponding decrease in the relative mean flow velocity (MFV), culminating in negligible net forward flow (reverberated pattern) in Phase 4 (6h LOP). Phase 1 is defined by a normal, low-resistance waveform; phase 2 displayed an increase in PSV, narrowed systole, and decreased EDV; phase 3 demonstrates decreased PSV and loss of EDV; phase 4 exhibits a reverberated “no-flow” phenomenon. Intervening in Phase 3 with an increase in mean arterial pressure resulted in a transient increase in flow (red trace vs pink trace) that reverted back to negligible forward flow soon after in Phase 4 (red and blue trace vs pink and sky blue). PSV: Peak Systolic Velocity; EDV: End Diastolic Velocity. Traces are from a representative brain; the experiment was repeated in n=3 independent brains with similar results. b, Power waveform analysis from a representative control perfusate brain during Phase 3 with corresponding trace (right) evidencing a MFV of 3 cm/s. c, Power waveform analysis from a representative control perfusate brain at 6h LOP demonstrating Phase 4 dynamics with corresponding trace (right) depicting MFV of 0 cm/s. Contrastingly, power waveform analysis from a representative BEx perfusate brain taken at 6h LOP demonstrates that at this time point BEx perfusion exhibits Phase 1 dynamics. (b, c) Traces are from representative brains; the experiment was repeated in n=3 independent brains for each condition with similar results. d, Plot of resistance index (RI) during the course of experimentation in control and BEx perfusate conditions. RI was calculated via Doppler ultrasound measurement and utilizing the formula RI = (PSV-EDV) / PSV. Intervention period is included above control perfusate curve to delineate the time period in which mean arterial pressures were increased during control perfusate conditions. n=3 measurements taken from 3 independent brains per condition. e, Quantification of the RI at normothermia under control-perfusion and BEx perfusate conditions. Two-tailed unpaired t-test (t=5.638, df=28) for mean values obtained during normothermic conditions; n=15 collapsed measurements across n=3 brains per condition while the brains were at normothermia (hours 2–6). All data are means ± SEM.
Extended Data Figure 4 |. Serial coronal sections of 3D renderings of micro-computed tomography angiogram.

Each inlet box depicts a maximum intensity projection of a 1cm coronal section at the plane indicated in the model (upper-left corner). Micro-computed tomography angiogram (CTA) demonstrates patency of major arterial vessels as well as arterioles (left). Corresponding gross anatomical structures along with arterial supply areas were traced and mapped onto each micro-CTA rendering (right). Legend provides abbreviations for anatomical structures and vascular vessels. Scale bar, 1 cm. Data are from a representative rendering; the experiment was repeated in n=3 independent brains with similar results.
Extended Data Figure 5 |. Restoration and maintenance of microcirculation and capillary integrity.

a, 3D rendering of high-resolution specimen-CTA of the hippocampus of BEx-perfused brain revealing extensive vascular network (left). Scale bar, 1mm. Enlarged area (right) of the red box with three examples (numbered red lines) of pre-capillary arterioles of varying size. Scale bar, 50 μm. Relative scale of microcirculatory vessels with the corresponding vessel diameters measured in the far-right. 25 μm represents the technical limit of the high-resolution specimen-CTA. Image is from a representative brain; the experiment was repeated in n=3 independent brains with similar results b, Intravascular hemoglobin fluorescent in the CA1 field across all experimental conditions. In comparison to 1h PMI and control perfusate conditions, fluorescent signal is found in precapillary arterioles (arrowhead) and capillaries (arrow) of both 10h PMI controls and BEx perfusate, indicating that the BEx perfusate reperfuses cerebral microcirculation. Images are from a representative brain per condition; the experiment was repeated in n=3 independent brains per condition with similar results c, Representative capillary EM microphotographs from the hippocampal CA1 zone after BEx perfusion. Blood vessel lumen (bl) is filled with electron-dense material (*), which represents the hemoglobin-based BEx perfusate. Pericytes and endothelial cells (highlighted semitransparent green and blue, respectively) demonstrate normal ultrastructure and contain cell nuclei (N), mitochondria (m), and cisterns of rough endoplasmic reticulum (rer). Adherence junctions between endothelial cells (aj) are visible. Scale bar, 1μm. Image is from a representative capillary; a total of 54 capillaries were identified across n=3 independent brains. d, Quantification of examined capillaries that are filled with the BEx perfusate evidences that the vast majority of capillaries are patent and perfused. A total of 54 capillaries were examined across n=3 independent brains. All data are means ± SEM.
Extended Data Figure 6 |. Restoration of microvascular reperfusion in the prefrontal neocortex.

a, Intravascular hemoglobin fluorescent signal in the prefrontal neocortex across all conditions. In comparison to 1h PMI and control perfusate conditions, the fluorescent signal is found in precapillary arterioles (arrowhead) and capillaries (arrow) of both 10h PMI controls and BEx perfusate. Images are from a representative brain per condition; the experiment was repeated in n=3 independent brains with similar results. b, Capillary EM microphotographs from the prefrontal neocortex after BEx perfusion. Blood vessel lumen (bl) is filled with electron-dense material, which represents the hemoglobin-based BEx perfusate. Image is from a representative capillary; a total of 41 capillaries were identified across n=3 independent brains. c, Quantification of the number of examined prefrontal neocortical capillaries filled with BEx perfusate. A total of 41 capillaries across n=3 independent brains were analyzed.
Extended Data Figure 7 |. Microvascular reperfusion and cytoarchitectonics in the occipital neocortex and cerebellar cortex.

a, Micro-CT Angiography demonstrates patency of major arterial vessels as well as arterioles in both the occipital lobe as well as cerebellum. OL, occipital lobe; V, vermis; LC, lateral cortex; CP, choroid plexus; L, left; R, right. b, c, Intravascular hemoglobin fluorescent signal in the occipital neocortex and cerebellar cortex, respectively, demonstrating perfused precapillary arterioles (arrowhead) and capillaries (arrow) in both 10h PMI controls and BEx perfusion. Images are from a representative brain from each condition; experiments were repeated in n=3 independent brains per group. d, Nissl stains (top) with higher magnification of boxed area (below) of the occipital neocortex demonstrating preserved regional cytoarchitectonics as well as neuronal structure in BEx perfused brains. Pyramidal-shaped cell bodies as well as apical and basal dendrites are present in both 1h PMI and BEx perfused brains. An inverted pyramidal neuron structure is also appreciable under BEx perfusion (arrow). Scale bar, 350 μm (top), 100 μm (bottom). Images are from a representative brain from each condition; experiments were repeated in n=3 independent brains per group. e, Representative Nissl stains of the cerebellar cortex reveal preserved Purkinje cell structure in 1h PMI and BEx perfusion brains, when compared to 10h PMI and control perfusate conditions (arrows). Images are from a representative brain from each condition; experiments were repeated in n=3 independent brains per group.
Extended Data Figure 8 |. Analysis of neuronal cell morphology and density in the neocortex.

a, Nissl stains (top) with higher magnification of boxed area (below) of the prefrontal neocortex demonstrating preserved neuronal structure and anatomical cytoarchitecture in BEx perfused brains. Scale bar, 350 μm (top), 100 μm (bottom). Images are from a representative brain from each condition; experiments were repeated in n=6 independent brains per group with similar results. b, Nissl stains of the primary motor cortex reveal preserved Betz cell (arrows) structure under BEx perfusion conditions, despite these cells having been axotomized following decapitation. Images are from a representative brain from each condition; experiments were repeated in n=3 independent brains per group with similar results. c, Confocal tile scans of immunohistochemical stains for the pan-neuronal marker RBFOX3 (NeuN; green) in the prefrontal neocortex. Scale bar, 50 μm. Images are from a representative brain from each condition; experiments were repeated in n=6 independent brains per group with similar results. d, Maximum intensity confocal projections of NeuN staining. Note that neurons exhibit a swollen morphology in 1h PMI, and significant cellular destruction in 10h PMI and control perfusate conditions (arrowheads), while neurons in the BEx perfusion condition display typical elongated morphology (arrows). Scale bar, 50 μm. Images are from a representative brain from each condition; experiments were repeated in n=6 independent brains per group with similar results. e, Maximum intensity projections of the excitatory neuron marker, Neurogranin (NRGN; green), show a preservation of typical morphology of cortical pyramidal neurons under BEx perfusion (arrows), with swollen morphology under 1h PMI conditions (arrow). There is evidence of clear cell destruction and the presence of enlarged vacuoles under 10h PMI and control perfusate conditions (arrowheads). Scale bar, 50 μm. Images are from a representative brain from each condition; experiments were repeated in n=6 independent brains per group with similar results. f, Maximum intensity projections of the inhibitory interneuron marker, GAD1 (red). In 10h PMI and control perfusate specimens, GAD1 staining reveals contracted cell bodies (arrows) with a loss of GAD1-positive somal contacts as compared to 1h PMI and BEx perfusion. Scale bar, 50 μm. Images are from a representative brain from each condition; experiments were repeated in n=6 independent brains per group with similar results. g, Quantification of the number of neuronal cells present in the prefrontal neocortex. Data is computed from Nissl stains. One-way ANOVA (P<0.001, F[3,20] = 224.6) with post-hoc Dunnett’s adjustment; n=6 brains per condition; NS, not significant. h, Quantification of the percentage of cells that exhibit a swollen, ellipsoid morphology. Data is analyzed from Nissl stains. One-way ANOVA (P<0.001, F[3,20] = 16.33) with post-hoc Dunnett’s adjustment; n=6 brains per group. All data are means ± SEM. i, j, Quantification of the total number of NRGN- and GAD1-positive cells, respectively, in the neocortex. One-way ANOVA (NRGN+: P=0.002, F[3,20] = 7.018; GAD1+: P<0.001, F[3,20] = 9.153) with post-hoc Dunnett’s adjustment. n=6 brains per group. All data are means ± SEM.
Extended Data Figure 9 |. Ultrastructure of ependymal cells and hippocampal CA1 white matter.

a, Representative EM microphotographs of hippocampal ependymal cells. In 1h PMI controls, certain mitochondria display normal ultrastructure and electron-dense matrix (m), while others exhibit a more swollen morphology (yellow). Contrastingly, in 10h PMI conditions ependymal cells demonstrate lightened cytoplasm with numerous vacuoles (v) and swollen mitochondria (yellow). Although adherence junctions (aj) are preserved, the cell membrane is destroyed in several positions. Similarly, some moderately damaged, yet visibly intact, cells under control perfusate conditions make contact with entirely destroyed adjacent cells (pink), indicating a destruction of the continuum of the ependymal layer. However, ependymal cells from BEx-perfused brains, show ultrastructure characteristic of normal cells, such as continuity of the cell membrane that covers cilia (c) and produces filopodia (f), tight junctions between adjacent cells, and intact mitochondria with electron dense matrix. Boxed area (top) are enlarged in corresponding high-power image (below). b, In the hippocampal white matter of 1h PMI, 10h PMI, and control perfusate conditions, numerous cells contain segments of destroyed cytoplasm (pink), while oligodendrocytes have light cytoplasm with numerous vacuoles and swollen mitochondria (yellow); in 10h PMI samples, mitochondria may not be visible due to extensive destruction. In BEx perfusate conditions, oligodendrocytes demonstrate normal ultrastructure with numerous cisterns of rough endoplasmic reticulum (rer), and mitochondria have electron-dense matrix and many cristae. Overall myelinated axons (MA) exhibit similar morphology across all experimental groups. Boxed areas (top) are depicted in corresponding high-power images (below). N, cell nucleus. Scale bar, 1 μm. For both (a & b), images are from a representative brain from each condition; experiments were repeated in n=3 independent brains per group with similar results.
Extended Data Figure 10 |. Dynamics of caspase 3 activation in the perfused and unperfused brain.
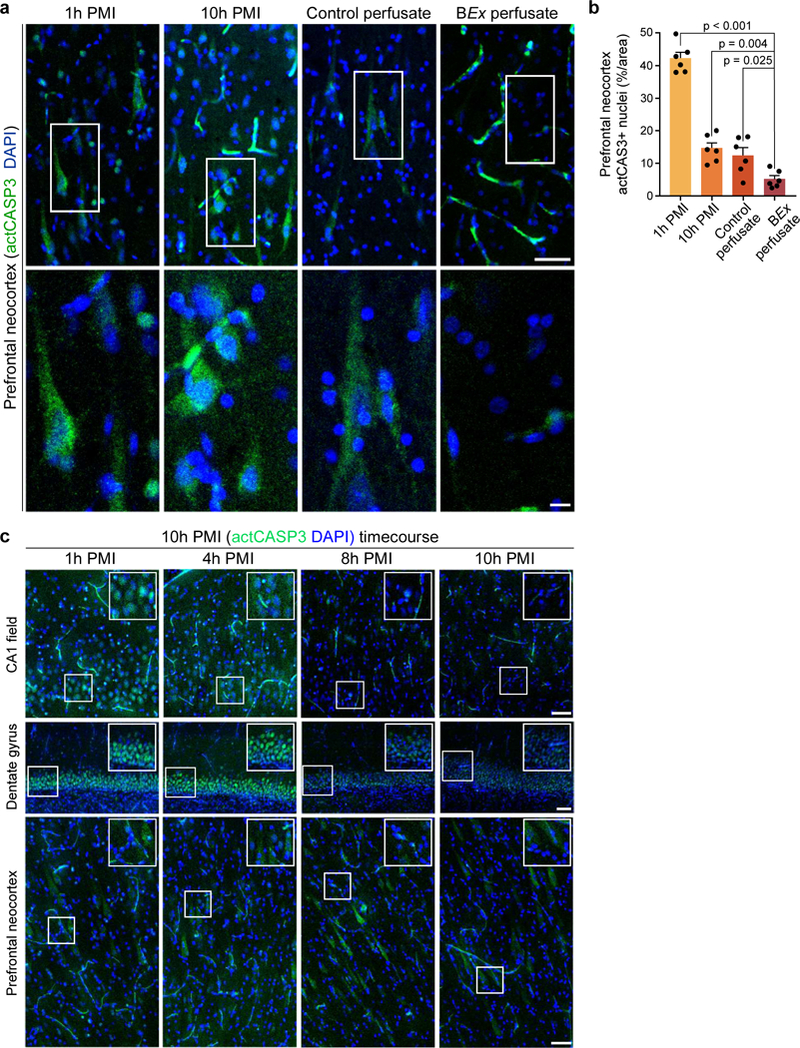
a, Confocal maximum intensity projection of immunofluorescent staining for the cleaved, activated form of the apoptotic execution protein, caspase 3 (actCASP3; green). (Bottom) Enlargement of the boxed area above. Scale bar, 50 μm (top); 10 μm (bottom). Images are from a representative brain from each condition; experiments were repeated in n=6 independent brains per group with similar results. b, Quantification of normalized actCASP3-positive nuclei. One-way ANOVA (P<0.001, F[3,20] = 82.3) with post-hoc Dunnett’s adjustment. n=6 brains per condition. All data are means ± SEM. c, Time-course analysis of activated caspase-3 localization in the unperfused brain at various post-mortem intervals in the CA1 field, dentate gyrus, and prefrontal neocortex. At 1h PMI there is robust nuclear localization of cleaved caspase-3 across all brain regions; however, this signal decreases with increased post-mortem intervals. Images are from representative brains for each brain region; experiments were repeated in n=3 independent brains per group with similar results.
Extended Data Figure 11 |. Orientation and fiber bundle density of myelinated neocortical axons.

a, Immunohistochemical staining for myelin basic protein (MBP) in the prefrontal neocortex (top) with high-magnification images depicting fiber orientation and bundles (bottom). Scale bar, 100 μm (top); 50 μm (bottom). Images are from a representative brain from each condition; experiments were repeated in n=6 independent brains per group with similar results. b, Analysis of individual axonal angles in relation to the pial surface across all experimental conditions. BEx and 10h PMI conditions demonstrate an increase in number of axons orthogonally oriented to the pial surface, while 1h PMI and control perfusate specimens exhibit an increase in axons oriented in more acute angles. Pairwise comparisons by two-tailed Chi-square analysis with Yates correction with df=1 and n=786 axons were analyzed per pairwise comparison; P-values specified within; n=3 brains per condition. BEx vs. 1H - χ2=6.403 for 0–30°, χ2=4.341 for 30–60°, χ2=18.09 for 60–90°; BEx vs. CP - χ2=4.341 for 30–60°, χ2=11.39 for 60–90°; NS, not significant. c, Quantification of the density of myelinated fiber bundles across experimental conditions. One-way ANOVA (P<0.001, F[3,20] = 10.78) with post-hoc Dunnett’s adjustment; P-values specified within; n=6 animals per group. All data are means ± SEM.
Extended Data Figure 12 |. Glial cell structure in the hippocampus.

a, b, Confocal maximum intensity projections of immunohistochemical stains for astrocytes (GFAP; red) and microglia (IBA-1; green) with DAPI (blue) counterstain in the CA1 and Dentate gyrus regions of the hippocampus evidences preservation of glial cell structure under BEx perfusion conditions. As compared to 1h PMI controls, microglia display a more phagocytic morphology with shortened cellular processes. Scale bar, 50 μm. Images are from a representative brain from each condition; experiments were repeated in n=3 independent brains per group with similar results.
Supplementary Material
Acknowledgements.
We thank HbO2 Therapeutics®, specifically J. Baqai, G. Dube, and R. Buskar, for their generosity in providing the Hemopure® product and their input in optimizing oxygen delivery methods; C. Aardema, D. Faulkner and R. Robertson for their technical assistance and discussions on the perfusion system; T. Constable and M. Qiu for their help with MRI imaging; A. Liu and T. Wing for assisting in ECoG discussions and data acquisition; and, various members of our lab community for their comments on the manuscript. We are thankful to A. Duque for his assistance in utilizing the equipment from the Yale Macaque Brain Resource, supported by NIH MH113257. This work was supported by the NIH BRAIN Initiative grant MH117064, the NIH shared instrument grant OD021845 that funded purchase of the microSPECT/CT scanner, and the NIH/NIGMS Medical Scientist Training Grant T32GM007205.
Z.V., S.G.D., J.S., and N.S. have disclosed these findings to the Yale Office of Cooperative Research, which has filed a patent to ensure broad use of the technology. All protocols, methods, perfusate formulations, and components of the BrainEx technology remain freely available for academic and non-profit research. While the Hemopure® product was provided in accordance to a material transfer agreement between HbO2 Therapeutics and Yale University via N.S., the Company had no influence on the study design or interpretation of the results. No author has a financial stake in, or receives compensation from, HbO2 Therapeutics®.
Footnotes
Competing Interests. All other authors declare no competing interests.
Data availability. All datasets and/or analyses generated in this study are available from the corresponding author upon reasonable request.
References
- 1.Kety SS Circulation and metabolism of the human brain. Brain Res Bull 50, 415–416 (1999). [DOI] [PubMed] [Google Scholar]
- 2.Sokoloff L. Energetics of functional activation in neural tissues. Neurochem Res 24, 321–329 (1999). [DOI] [PubMed] [Google Scholar]
- 3.Kisler K., Nelson AR, Montagne A. & Zlokovic BV Cerebral blood flow regulation and neurovascular dysfunction in Alzheimer disease. Nat Rev Neurosci 18, 419–434, doi: 10.1038/nrn.2017.48 (2017). [DOI] [PMC free article] [PubMed] [Google Scholar]
- 4.Wagner S. R. t. & Lanier WL Metabolism of glucose, glycogen, and high-energy phosphates during complete cerebral ischemia. A comparison of normoglycemic, chronically hyperglycemic diabetic, and acutely hyperglycemic nondiabetic rats. Anesthesiology 81, 1516–1526 (1994). [DOI] [PubMed] [Google Scholar]
- 5.Hoxworth JM, Xu K., Zhou Y., Lust WD & LaManna JC Cerebral metabolic profile, selective neuron loss, and survival of acute and chronic hyperglycemic rats following cardiac arrest and resuscitation. Brain Res 821, 467–479 (1999). [DOI] [PubMed] [Google Scholar]
- 6.Borjigin J. et al. Surge of neurophysiological coherence and connectivity in the dying brain. Proc Natl Acad Sci U S A 110, 14432–14437, doi: 10.1073/pnas.1308285110 (2013). [DOI] [PMC free article] [PubMed] [Google Scholar]
- 7.Cole SL & Corday E. Four-minute limit for cardiac resuscitation. J Am Med Assoc 161, 1454–1458 (1956). [DOI] [PubMed] [Google Scholar]
- 8.Grenell RG Central nervous system resistance; the effects of temporary arrest of cerebral circulation for periods of two to ten minutes. J Neuropathol Exp Neurol 5, 131–154 (1946). [PubMed] [Google Scholar]
- 9.Greer DM Mechanisms of injury in hypoxic-ischemic encephalopathy: implications to therapy. Semin Neurol 26, 373–379, doi: 10.1055/s-2006-948317 (2006). [DOI] [PubMed] [Google Scholar]
- 10.Stys PK, Waxman SG & Ransom BR Na(+)-Ca2+ exchanger mediates Ca2+ influx during anoxia in mammalian central nervous system white matter. Ann Neurol 30, 375–380, doi: 10.1002/ana.410300309 (1991). [DOI] [PubMed] [Google Scholar]
- 11.Jung JE et al. Reperfusion and neurovascular dysfunction in stroke: from basic mechanisms to potential strategies for neuroprotection. Mol Neurobiol 41, 172–179, doi: 10.1007/s12035-010-8102-z (2010). [DOI] [PMC free article] [PubMed] [Google Scholar]
- 12.Verwer RW et al. Cells in human postmortem brain tissue slices remain alive for several weeks in culture. FASEB J 16, 54–60, doi: 10.1096/fj.01-0504com (2002). [DOI] [PubMed] [Google Scholar]
- 13.Onorati M. et al. Zika Virus Disrupts Phospho-TBK1 Localization and Mitosis in Human Neuroepithelial Stem Cells and Radial Glia. Cell Rep 16, 2576–2592, doi: 10.1016/j.celrep.2016.08.038 (2016). [DOI] [PMC free article] [PubMed] [Google Scholar]
- 14.Charpak S. & Audinat E. Cardiac arrest in rodents: maximal duration compatible with a recovery of neuronal activity. Proc. Natl. Acad. Sci. 95, 4748–4753 (1998). [DOI] [PMC free article] [PubMed] [Google Scholar]
- 15.Barksdale KA et al. Mitochondrial viability in mouse and human postmortem brain. FASEB J 24, 3590–3599, doi: 10.1096/fj.09-152108 (2010). [DOI] [PMC free article] [PubMed] [Google Scholar]
- 16.Hossmann KA & Zimmermann V. Resuscitation of the monkey brain after 1 h complete ischemia. I. Physiological and morphological observations. Brain Res 81, 59–74 (1974). [DOI] [PubMed] [Google Scholar]
- 17.Zimmermann V. & Hossmann KA Resuscitation of the monkey brain after one hour’s complete ischemia. II. Brain water and electrolytes. Brain Res 85, 1–11 (1975). [DOI] [PubMed] [Google Scholar]
- 18.Kleihues P., Hossmann KA, Pegg AE, Kobayashi K. & Zimmermann V. Resuscitation of the monkey brain after one hour complete ischemia. III. Indications of metabolic recovery. Brain Res 95, 61–73 (1975). [DOI] [PubMed] [Google Scholar]
- 19.Hossmann KA & Sato K. Recovery of neuronal function after prolonged cerebral ischemia. Science 168, 375–376 (1970). [DOI] [PubMed] [Google Scholar]
- 20.Hughes A., Riou P. & Day C. Full neurological recovery from profound (18.0 degrees C) acute accidental hypothermia: successful resuscitation using active invasive rewarming techniques. Emerg Med J 24, 511–512, doi: 10.1136/emj.2006.040261 (2007). [DOI] [PMC free article] [PubMed] [Google Scholar]
- 21.Albers GW et al. Thrombectomy for Stroke at 6 to 16 Hours with Selection by Perfusion Imaging. N Engl J Med, doi: 10.1056/NEJMoa1713973 (2018). [DOI] [PMC free article] [PubMed] [Google Scholar]
- 22.Haws CW, Gourley JK & Heistad DD Effects of nimodipine on cerebral blood flow. J Pharmacol Exp Ther 225, 24–28 (1983). [PubMed] [Google Scholar]
- 23.Schmidt V. Comparative anatomy of the pig brain: an integrative magnetic resonance imaging (MRI) study of the porcine brain with special emphasis on the external morphology of the cerebral cortex. (2015). [Google Scholar]
- 24.Conrad MS, Dilger RN & Johnson RW Brain growth of the domestic pig (Sus scrofa) from 2 to 24 weeks of age: a longitudinal MRI study. Dev Neurosci 34, 291–298, doi: 10.1159/000339311 (2012). [DOI] [PMC free article] [PubMed] [Google Scholar]
- 25.Watanabe H. et al. MR-based statistical atlas of the Gottingen minipig brain. Neuroimage 14, 1089–1096, doi: 10.1006/nimg.2001.0910 (2001). [DOI] [PubMed] [Google Scholar]
- 26.Sarwar M. & McCormick WF Decrease in ventricular and sulcal size after death. Radiology 127, 409–411, doi: 10.1148/127.2.409 (1978). [DOI] [PubMed] [Google Scholar]
- 27.Offiah CE & Dean J. Post-mortem CT and MRI: appropriate post-mortem imaging appearances and changes related to cardiopulmonary resuscitation. Br J Radiol 89, 20150851, doi: 10.1259/bjr.20150851 (2016). [DOI] [PMC free article] [PubMed] [Google Scholar]
- 28.Schmidt-Kastner R. & Freund TF Selective vulnerability of the hippocampus in brain ischemia. Neuroscience 40, 599–636 (1991). [DOI] [PubMed] [Google Scholar]
- 29.Crain BJ, Westerkam WD, Harrison AH & Nadler JV Selective neuronal death after transient forebrain ischemia in the Mongolian gerbil: a silver impregnation study. Neuroscience 27, 387–402 (1988). [DOI] [PubMed] [Google Scholar]
- 30.Horn M. & Schlote W. Delayed neuronal death and delayed neuronal recovery in the human brain following global ischemia. Acta Neuropathol 85, 79–87 (1992). [DOI] [PubMed] [Google Scholar]
- 31.Holm IE & West MJ Hippocampus of the domestic pig: a stereological study of subdivisional volumes and neuron numbers. Hippocampus 4, 115–125, doi: 10.1002/hipo.450040112 (1994). [DOI] [PubMed] [Google Scholar]
- 32.Felix B. et al. Stereotaxic atlas of the pig brain. Brain Res Bull 49, 1–137 (1999). [DOI] [PubMed] [Google Scholar]
- 33.Olmos-Serrano JL et al. Down Syndrome Developmental Brain Transcriptome Reveals Defective Oligodendrocyte Differentiation and Myelination. Neuron 89, 1208–1222, doi: 10.1016/j.neuron.2016.01.042 (2016). [DOI] [PMC free article] [PubMed] [Google Scholar]
- 34.Budde MD & Frank JA Neurite beading is sufficient to decrease the apparent diffusion coefficient after ischemic stroke. Proc Natl Acad Sci U S A 107, 14472–14477, doi: 10.1073/pnas.1004841107 (2010). [DOI] [PMC free article] [PubMed] [Google Scholar]
- 35.Shin WH et al. Microglia expressing interleukin-13 undergo cell death and contribute to neuronal survival in vivo. Glia 46, 142–152, doi: 10.1002/glia.10357 (2004). [DOI] [PubMed] [Google Scholar]
- 36.Park KW, Lee HG, Jin BK & Lee YB Interleukin-10 endogenously expressed in microglia prevents lipopolysaccharide-induced neurodegeneration in the rat cerebral cortex in vivo. Exp Mol Med 39, 812–819, doi: 10.1038/emm.2007.88 (2007). [DOI] [PubMed] [Google Scholar]
- 37.Kowalski J., Gan J., Jonas P. & Pernia-Andrade AJ Intrinsic membrane properties determine hippocampal differential firing pattern in vivo in anesthetized rats. Hippocampus 26, 668–682, doi: 10.1002/hipo.22550 (2016). [DOI] [PMC free article] [PubMed] [Google Scholar]
- 38.Simkin D. et al. Aging-Related Hyperexcitability in CA3 Pyramidal Neurons Is Mediated by Enhanced A-Type K+ Channel Function and Expression. J Neurosci 35, 13206–13218, doi: 10.1523/JNEUROSCI.0193-15.2015 (2015). [DOI] [PMC free article] [PubMed] [Google Scholar]
- 39.Lam TI et al. Intracellular pH reduction prevents excitotoxic and ischemic neuronal death by inhibiting NADPH oxidase. Proc Natl Acad Sci U S A 110, E4362–4368, doi: 10.1073/pnas.1313029110 (2013). [DOI] [PMC free article] [PubMed] [Google Scholar]
- 40.Hinzen DH et al. Metabolism and function of dog’s brain recovering from longtime ischemia. Am J Physiol 223, 1158–1164, doi: 10.1152/ajplegacy.1972.223.5.1158 (1972). [DOI] [PubMed] [Google Scholar]
- 41.Hirsch H., Oberdorster G., Zimmer R., Benner KU & Lang R. The recovery of the electrocorticogram of normothermic canine brains after complete cerebral ischemia. Arch Psychiatr Nervenkr (1970) 221, 171–179 (1975). [DOI] [PubMed] [Google Scholar]
- 42.Hirsch H., Euler KH & Schneider M. [Recovery and resuscitation of the brain after ischemia in normothermia]. Pflugers Arch Gesamte Physiol Menschen Tiere 265, 281–313 (1957). [DOI] [PubMed] [Google Scholar]
- 43.Hossmann KA & Sato K. Effect of ischaemia on the function of the sensorimotor cortex in cat. Electroencephalogr Clin Neurophysiol 30, 535–545 (1971). [DOI] [PubMed] [Google Scholar]
- 44.Siesjo BK Cell damage in the brain: a speculative synthesis. J Cereb Blood Flow Metab 1, 155–185, doi: 10.1038/jcbfm.1981.18 (1981). [DOI] [PubMed] [Google Scholar]
- 45.Farahany NA et al. The ethics of experimenting with human brain tissue. Nature 556, 429–432, doi: 10.1038/d41586-018-04813-x (2018). [DOI] [PMC free article] [PubMed] [Google Scholar]
- 46.Stacy MR et al. Multimodality imaging approach for serial assessment of regional changes in lower extremity arteriogenesis and tissue perfusion in a porcine model of peripheral arterial disease. Circ Cardiovasc Imaging 7, 92–99, doi: 10.1161/CIRCIMAGING.113.000884 (2014). [DOI] [PMC free article] [PubMed] [Google Scholar]
- 47.Keep RF, Hua Y. & Xi G. Brain water content. A misunderstood measurement? Transl Stroke Res 3, 263–265, doi: 10.1007/s12975-012-0152-2 (2012). [DOI] [PMC free article] [PubMed] [Google Scholar]
Supplemental Discussion References
- 48.Gilboe DD, Cotanch WW & Glover MB Extracorporeal Perfusion of the Isolated Head of a Dog. Nature 202, 399–400 (1964). [DOI] [PubMed] [Google Scholar]
- 49.White RJ, Albin MS & Verdura J. Preservation of Viability in the Isolated Monkey Brain Utilizing a Mechanical Extracorporeal Circulation. Nature 202, 1082–1083 (1964). [DOI] [PubMed] [Google Scholar]
- 50.von Bohlen und Halbach O. The isolated mammalian brain: an in vivo preparation suitable for pathway tracing. Eur J Neurosci 11, 1096–1100 (1999). [DOI] [PubMed] [Google Scholar]
- 51.Muhlethaler M., de Curtis M., Walton K. & Llinas R. The isolated and perfused brain of the guinea-pig in vitro. Eur J Neurosci 5, 915–926 (1993). [DOI] [PubMed] [Google Scholar]
- 52.de Curtis M., Pare D. & Llinas RR The electrophysiology of the olfactory-hippocampal circuit in the isolated and perfused adult mammalian brain in vitro. Hippocampus 1, 341–354, doi: 10.1002/hipo.450010402 (1991). [DOI] [PubMed] [Google Scholar]
- 53.Taunyane IC et al. Preserved brain morphology after controlled automated reperfusion of the whole body following normothermic circulatory arrest time of up to 20 minutes. Eur J Cardiothorac Surg 50, 1025–1034, doi: 10.1093/ejcts/ezw186 (2016). [DOI] [PubMed] [Google Scholar]
- 54.Gerlach E., Marko P., Zimmer HG, Pechan I. & Trendelenburg C. Different response of adenine nucleotide synthesis de novo in kidney and brain during aerobic recovery from anoxia and ischemia. Experientia 27, 876–878 (1971). [DOI] [PubMed] [Google Scholar]
- 55.Ehrlich MP et al. Effect of hypothermia on cerebral blood flow and metabolism in the pig. Ann Thorac Surg 73, 191–197 (2002). [DOI] [PubMed] [Google Scholar]
- 56.Poulsen PH et al. In vivo estimation of cerebral blood flow, oxygen consumption and glucose metabolism in the pig by [15O]water injection, [15O]oxygen inhalation and dual injections of [18F]fluorodeoxyglucose. J Neurosci Methods 77, 199–209 (1997). [DOI] [PubMed] [Google Scholar]
- 57.Hossmann KA, Sakaki S. & Kimoto K. Cerebral Uptake of Glucose and Oxygen in Cat Brain after Prolonged Ischemia. Stroke 7, 301–305, doi:Doi 10.1161/01.Str.7.3.301 (1976). [DOI] [Google Scholar]
- 58.Duffy TE, Kohle SJ & Vannucci RC Carbohydrate and energy metabolism in perinatal rat brain: relation to survival in anoxia. J Neurochem 24, 271–276 (1975). [DOI] [PubMed] [Google Scholar]
- 59.Lee JM, Zipfel GJ & Choi DW The changing landscape of ischaemic brain injury mechanisms. Nature 399, A7–14 (1999). [DOI] [PubMed] [Google Scholar]
- 60.Lo EH A new penumbra: transitioning from injury into repair after stroke. Nat. Med. 14, 497–500 (2008). [DOI] [PubMed] [Google Scholar]
- 61.Howells DW et al. Different strokes for different folks: the rich diversity of animal models of focal cerebral ischemia. J Cereb Blood Flow Metab 30, 1412–1431, doi: 10.1038/jcbfm.2010.66 (2010). [DOI] [PMC free article] [PubMed] [Google Scholar]
- 62.Zhang K. & Sejnowski TJ A universal scaling law between gray matter and white matter of cerebral cortex. Proc Natl Acad Sci U S A 97, 5621–5626, doi: 10.1073/pnas.090504197 (2000). [DOI] [PMC free article] [PubMed] [Google Scholar]
- 63.Gross PM, Sposito NM, Pettersen SE & Fenstermacher JD Differences in function and structure of the capillary endothelium in gray matter, white matter and a circumventricular organ of rat brain. Blood Vessels 23, 261–270 (1986). [DOI] [PubMed] [Google Scholar]
- 64.Ransom BR & Baltan SB Axons get excited to death. Ann Neurol 65, 120–121, doi: 10.1002/ana.21659 (2009). [DOI] [PMC free article] [PubMed] [Google Scholar]
- 65.Collins GM, Bravo-Shugarman M. & Terasaki PI Kidney preservation for transportation. Initial perfusion and 30 hours’ ice storage. Lancet 2, 1219–1222 (1969). [DOI] [PubMed] [Google Scholar]
- 66.den Butter G., Saunder A., Marsh DC, Belzer FO & Southard JH Comparison of solutions for preservation of the rabbit liver as tested by isolated perfusion. Transpl Int 8, 466–471 (1995). [DOI] [PubMed] [Google Scholar]
- 67.Jablonski P., Howden B., Marshall V. & Scott D. Evaluation of citrate flushing solution using the isolated perfused rat kidney. Transplantation 30, 239–243 (1980). [DOI] [PubMed] [Google Scholar]
- 68.Marshall MR, Ma TM, Eggleton K. & Ferencz A. Regional citrate anticoagulation during simulated treatments of sustained low efficiency diafiltration. Nephrology (Carlton) 8, 302–310 (2003). [DOI] [PubMed] [Google Scholar]
- 69.Todo S. et al. Extended preservation of human liver grafts with UW solution. JAMA 261, 711–714 (1989). [PMC free article] [PubMed] [Google Scholar]
- 70.Ames A 3rd, Wright RL, Kowada M., Thurston JM & Majno G. Cerebral ischemia. II. The no-reflow phenomenon. Am J Pathol 52, 437–453 (1968). [PMC free article] [PubMed] [Google Scholar]
- 71.Little JR, Kerr FW & Sundt TM Jr. Microcirculatory obstruction in focal cerebral ischemia. Relationship to neuronal alterations. Mayo Clin Proc 50, 264–270 (1975). [PubMed] [Google Scholar]
- 72.Del Zoppo GJ et al. Experimental acute thrombotic stroke in baboons. Stroke 17, 1254–1265 (1986). [DOI] [PubMed] [Google Scholar]
- 73.Endres M. et al. Attenuation of delayed neuronal death after mild focal ischemia in mice by inhibition of the caspase family. J Cereb Blood Flow Metab 18, 238–247, doi: 10.1097/00004647-199803000-00002 (1998). [DOI] [PubMed] [Google Scholar]
- 74.Saunders DE, Clifton AG & Brown MM Measurement of infarct size using MRI predicts prognosis in middle cerebral artery infarction. Stroke 26, 2272–2276 (1995). [DOI] [PubMed] [Google Scholar]
Associated Data
This section collects any data citations, data availability statements, or supplementary materials included in this article.