Abstract
The synthesis, characterization, and spectral properties of strategically designed boronic acid containing fluorescent sensors, o-, m-, p-BMOQBA, for the potential detection of tear glucose concentrations when immobilized in plastic disposable contact lenses is described. The new probes, BMOQBAs, consist of the 6-methoxyquinolinium nucleus as a fluorescent indicator, and the boronic acid moiety as a glucose chelating group. A control compound BMOQ, which has no boronic acid group and therefore does not bind monosaccharides has also been prepared. In this paper, we show that structural design considerations of the new probes have afforded for their compatibility within the lenses, with reduced probe sugar-bound pKa favorable with the mildly acidic lens environment. In addition, the new probes are readily water soluble, have high quantum yields, and can be prepared by a simple one-step synthetic procedure.
1. Introduction
Diabetes results in long-term health disorders including cardiovascular disease, blindness, and cancer.1,2 Continuous monitoring of glucose levels in the body is important in managing diabetes. New signaling methods/probes may provide an improved technology to monitor glucose and other physiologically important analytes. A wide variety of methods for glucose analysis have been reported in the literature, including electrochemistry3,4 near infrared spectroscopy,5,6 optical rotation,7,8 colorimetric,9,10 and fluorescence detection,11–15 to name but just a few. The most commonly used technology for blood glucose determination is an enzyme-based method,15 which requires frequent blood sampling and therefore drawing. Although frequent ‘finger pricking’ with a small needle to obtain the blood sample is a relatively painless process, this method does suffer from a few practical problems. The first one is inconvenience and the required compliance by patients, while the second is that this is not a continuous monitoring method. Thus, there is a growing interest in the development of continuous and noninvasive glucose sensing technologies. Recently, our laboratories have made notable progress toward these goals by developing a glucose sensing contact lens. This new technology potentially allows for noninvasive and continuous self-glucose monitoring by patients, using off-the-shelf, disposable, plastic contact lenses, embedded with glucose sensitive boronic acid containing fluorophores.16–20 Subsequently in this paper, we report the design rationale, new molecular signaling mechanism and the synthesis of these new contact lens glucose-signaling probes.
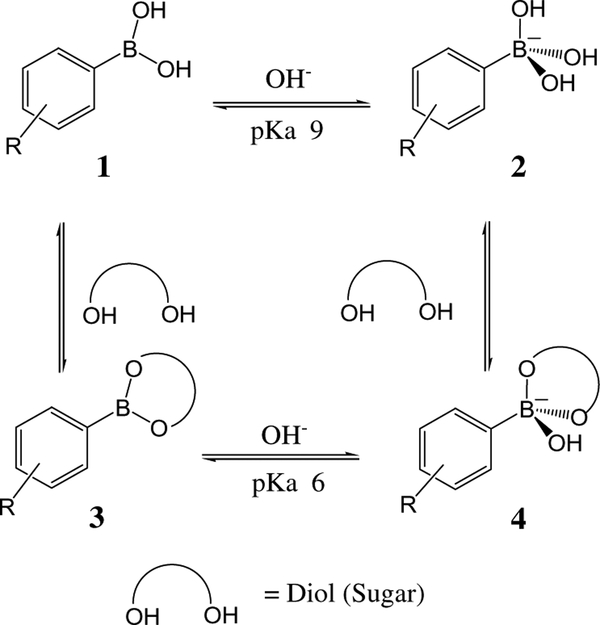
The boronic acid moiety has been long known to have high affinity for diol-containing compounds such as carbohydrates21 (Scheme 1), where the strong complexation has been used for the construction of carbohydrate sensors,22 transporters,23 and chromatographic materials.24 Naturally, boronic acid containing compounds have been considered as a chelating group in the synthesis of glucose sensors,25–30 where we note the work of Shinkai and co-workers,25,26 Norrild and co-workers,27 Lakowicz and co-workers,28–30 and Drueckhammer and co-workers,22 to name but just a few. However, we noticed previously with some of the probes developed for solution (blood/serum)-based measurements are not compatible within the contact lenses,16 because of the intrusive microenvironment of the lens, with regard to local pH and polarity. Based on our recent contact lens findings, the pH inside the contact lens is relatively acidic (≈6.0), and the local polarity of the lens is not indifferent than that of methanol.16 Subsequently, published boronic acid containing fluorophores embedded within a contact lens show a significantly reduced response toward glucose.16 Hence we have addressed this issue and developed three fluorescent isomers suitable for use in the contact lens. In addition to the environmental constraints of pH and polarity, the probes have to be additionally sensitive to the very low concentrations of tear glucose, ≈500 μM, recalling that the blood glucose levels for a healthy person are ≈10-fold higher.17–20
Scheme 1.
Equilibrium for the boronic acid/diol (sugar) and/or OH−interaction.
2. Boronic acid probe design
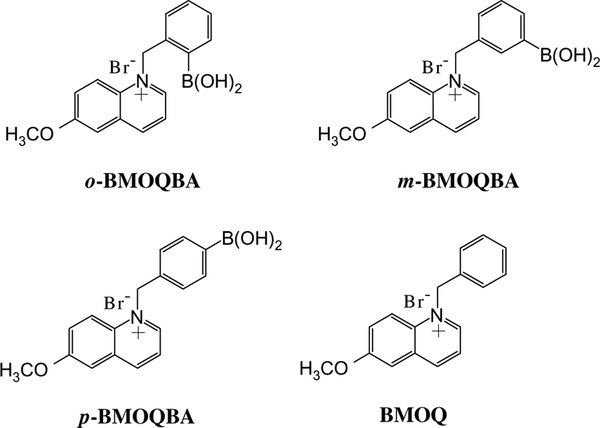
To address the environmental constraints imposed by the contact lens, we considered lowering the pKa of the probe. The pKa of the phenyl boronic acid is tunable with the appropriate substituents,30 for example, an electron withdrawing cyaino group reduces the pKa while an electron donating group amine increases the pKa of the sugar-bound form. Also the solubility of the probes in the aqueous media is of the primary concern to utilize the probes in the real-time applications such as glucose monitoring using contact lens. We therefore considered the interaction between the quaternary nitrogen of the 6-methoxyquinolinium nucleus and the boronic acid group, which reduces the pKa of the probe. A similar approach of using the boronic acid probes based on pyridinium moiety to make the water soluble probes has been reported recently.27 Subsequently, we have synthesized three isomeric boronic acid probes, o-BMOQBA, m-BMOQBA, and p-BMOQBA, where the spacing between the interacting moieties, the quaternary nitrogen of the 6-methoxyquinolinium and the boronic acid group, allows for an understanding of the sensing mechanism (Fig. 1). In addition, a control compound (BMOQ), which does not contain the boronic acid moiety, and is therefore insensitive toward sugar, has been synthesized to further understand the spectral properties of the probes (Fig. 1). A detailed photophysical study of the probes in the presence and absence of sugars is discussed in this paper, their response toward glucose within a contact lens to be discussed elsewhere in due course.
Figure 1.
Molecular structure of the boronic acid probes, ortho-, meta-, and para-BMOQBA, and the respective control compound BMOQ. BMOQBA: N-(boronobenzyl)-6-methoxyquinolinium bromide, BMOQ: N-benzyl-6-methoxyquinolinium bromide.
3. Results and discussion
The boronic acid containing fluorescent probes (o-BMOQBA—N-(2-boronobenzyl)-6-methoxyquinolinium bromide, m-BMOQBA—N-(3-boronobenzyl)-6-methoxyquinolinium bromide, p-BMOQBA—N-(4-boronobenzyl)-6-methoxyquinolinium bromide) and the corresponding control compound (BMOQ—N-benzyl-6-methoxyquinolinium bromide) were conveniently prepared in a one-step synthesis using commercially available 6-methoxyquinoline and the respective boronobenzyl bromides or benzyl bromide.
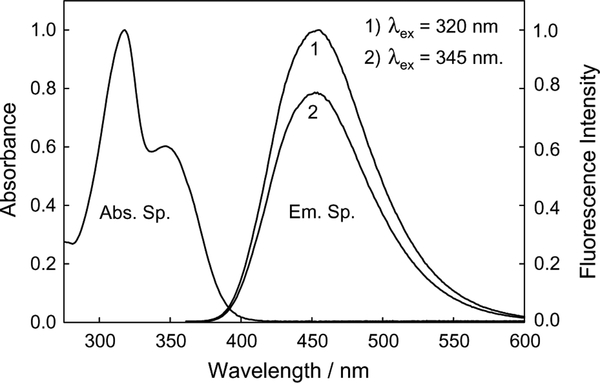
A representative absorption and emission spectra for o-BMOQBA in water are shown in Figure 2, which is characteristic of all three isomers and indeed the control compound. The spectral properties of the probes in water are summarized in Table 1. Typically all three isomers show a long wavelength absorption band at ≈345 nm, which can be assigned to the n→ π* transition of the oxygen. The excitation independent emission band at ≈450 nm indicates only one ground-state species is present. The large Stokes-shifted fluorescence emission band of ≈100nm is ideal for fluorescence sensing, allowing easy discrimination of the excitation.31 All four compounds show very similar spectral properties to that of N-(3-sulfopropyl)-6-methoxyquinolinium (SPQ), which is widely used in fluorescence sensing.31,32 This indicates the negligible conjugation between the phenyl ring and quinolinium moiety, which are separated by an insulating methylene spacer (Fig. 1). Table 1 also shows the quantum yield values for the probes in water obtained with reference to SPQ (ϕf = 0.53 in water).32,33 The quantum yield values of the boronic acid containing fluorophores are slightly lower than that of the control compound (BMOQ), the quantum yield values increasing in the order ortho-, para-, and meta-. In contrast the monoexponential fluorescence lifetimes of the isomers increased in the order para-, meta-, and then ortho-, which was slightly surprising as the quantum yields and lifetimes usually change in unison.31 Similar to having the highest quantum yield, the control compound also had as expected, the longest lifetime, some 27.3 ns. One explanation for these differences between the isomers, lies in the interaction between the boronatediester form present in solution, [B−(OH)3], 4 in Scheme 1, and the positively charged nitrogen center at neutral pH, the extent of which being determined by the spacing. We are currently trying to understand this mechanism of interaction between the quaternary nitrogen positive center and the boronate ester. However, one would have expected the extent of interaction would be more prominent for the ortho-isomer, as this is facilitated by both through-bond and through-space interactions.34,35 This is in contrast to the para-isomer, where only the through-bond mechanism is deemed feasible.
Figure 2.
Absorption and emission spectra of o-BMOQBA in water. The spectra are representative of the other phenylboronic acid isomers and BMOQ.
Table 1.
Spectral properties of the probes in water, pKa values in the presence and absence of 100mM sugars and dissociation constants of the probes in pH 7.5 phosphate buffer with both glucose and fructose
| o-BMOQBA | m-BMOQBA | p-BMOQBA | BMOQ | |
|---|---|---|---|---|
| λabs (max)/nm | 318, 346 | 318, 347 | 318, 346 | 318, 347 |
| λem (max)/nm | 450 | 450 | 451 | 453 |
| ϕf | 0.46 | 0.51 | 0.49 | 0.54 |
| τf/nsa | 26.7 | 25.9 | 24.9 | 27.3 |
| pKa (buffer) | 7.90 | 7.70 | 7.90 | — |
| pKa (buffer + glucose) | 6.62 | 6.90 | 6.90 | — |
| pKa (buffer + fructose) | 4.80 | 5.00 | 5.45 | — |
| KD/mM (glucose) | 49.5 | 1000 | 430 | — |
| KD/mM (fructose) | 0.65 | 1.8 | 9.1 | — |
Monoexponential decay time.
Encouragingly, the affinity of the probes for glucose also tracks the changes observed in probe quantum yields (Table 1) suggesting little or no steric hindrance for glucose binding, given the size differences between glucose and the hydroxyl ion.
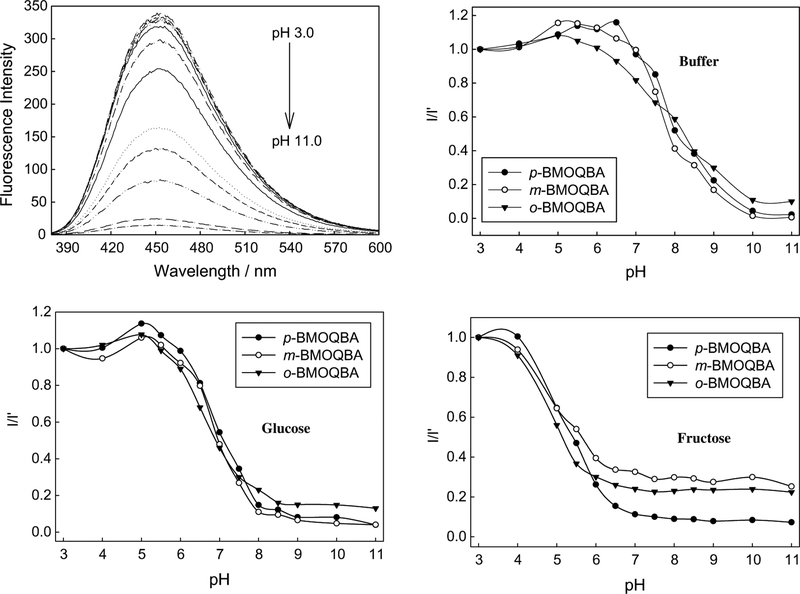
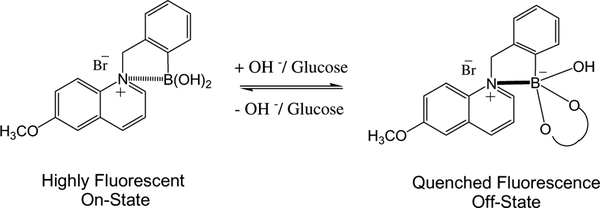
The emission spectra of o-BMOQBA in different pH media are shown in Figure 3. As the pH increases from 3 to 11, a steady decrease in fluorescence intensity of the boronic acid probes is observed, in contrast to BMOQ, which has no boronic acid group and therefore shows no change in intensity (data not shown). The corresponding titration curves in the absence and presence of 100mM glucose and fructose, obtained by plotting the normalized intensities at band maximum versus pH, are also shown in Figure 3. The boronic acid group is an electron-deficient Lewis acid having a sp2-hybridized boron atom with a trigonal conformation. The anionic form of the boronic acid, formed in high pH solutions, is characterized by a more electron rich sp3-hybridized boron atom with a tetrahedral geometry. The change in the electronic properties and the geometry at the boron atom induces the fluorescence spectral changes of the probes, the extent of which being dependent on the concentration of hydroxyl ion present and the isomer studied, that is, the contribution from both through-space and through-bond interactions.34,35 The well-known fluorescence reference compound quinine sulfate, which features the 6-methoxyquinoline nucleus, displays high quantum yields in acidic solutions, originating from its protonated form.31,32 Similarly, the boronic acid containing probes reported here, which also have quaternary nitrogen centers, are more fluorescent in acidic media. However, when the pH of the medium is increased, the electronic density at the boron atom is increased; facilitating the partial neutralization of the positive charge of the quaternary nitrogen. We have subsequently termed this interaction as a charge neutralization-stabilization mechanism and a schematic representation of this mechanism with regard to glucose binding/sensing is illustrated in Figure 4. In any event, the addition of glucose and subsequent binding of glucose to the boronic acid moiety, leads to a quantifiable reduction in fluorescence intensity of these new probes, the control compound being unperturbed.
Figure 3.
Fluorescence spectra of o-BMOQBA in buffered media (top left), λex = 345 nm. Emission intensity at 450 nm, I, divided by the initial emission intensity, I′, as a function of pH (top right), with 100mM glucose (bottom left), and 100mM fructose (bottom right).
Figure 4.
A schematic representation of the charge neutralization/stabilization signaling mechanism employed for the sugar/OH−sensing. The bold-line between the N+ and B− in the boronate diester shown in the right side of the equation indicates the increased electrostatic type interaction between them, and not intended to show the covalent bond formation between the two atoms.
The pKa values obtained from the titration curves shown in Figure 3 are shown in Table 1. We can report considerably reduced pKa values for the new phenylboronic acid containing fluorophores in buffered media, m-BMOQBA having a pKa of 7.7, the other two isomers also displaying relatively lower pKa values as compared to the typical boronic acid probes reported in the literature.25–30 The quaternary nitrogen of the quinolinium nucleus not only reduces the pKa of the probes, but also serves to stabilize the boronatediester, formed upon sugar complexation. This in turn increases the affinity of the probes for sugar as shown in Table 1. Hence the reduced sugar-bound pKa of these new probes, coupled with their increased glucose affinity, is most attractive for our glucose sensing contact lens application.16–20
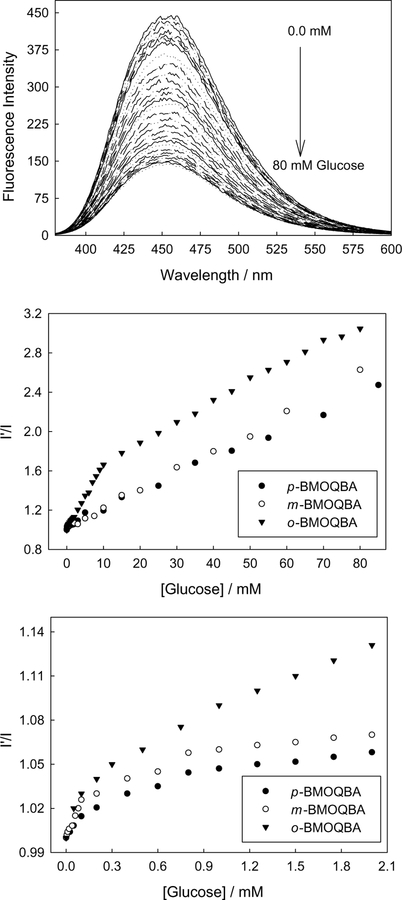
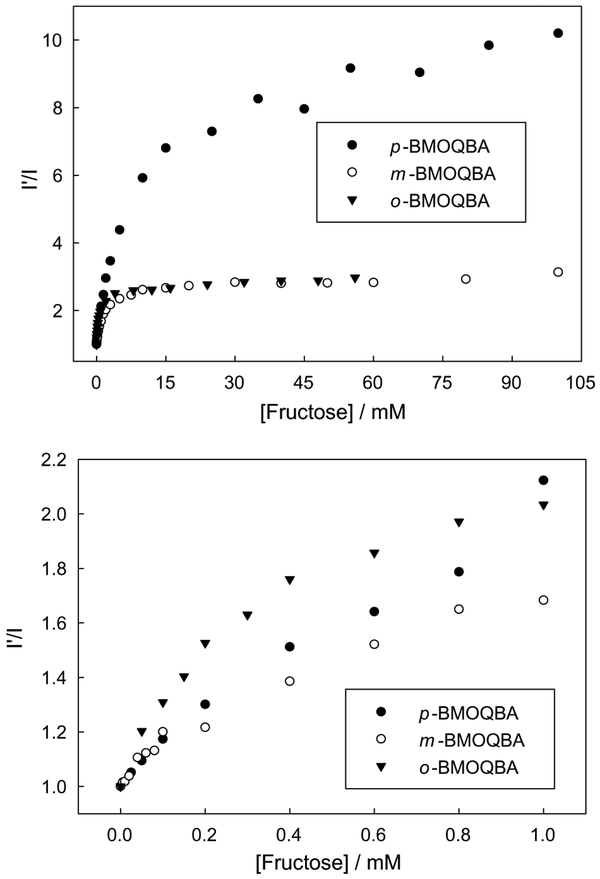
Glucose induced spectral changes of the probes can be seen in Figure 5. In an analogous manner to both the changes and rationale observed with an increase in pH, we also notice a steady decrease in fluorescence intensity of o-BMOQBA in pH7.5 phosphate buffer with increasing glucose concentrations. The other two isomers, m- and p-BMOQBA also show a very similar response toward glucose. The corresponding titration curves obtained by plotting I′ divided I, where I′ and I are the fluorescence intensity values at 450 nm in the absence and in the presence of sugar, respectively, versus glucose concentration are also shown in Figure 5. A 2.4 → 3.0-fold decrease in fluorescence intensity with 60mM glucose is observed with these probes. Interestingly, these probes show a ≈12–15% intensity change in the presence of as little as 2mM glucose, noting that tear glucose levels can change from ≈500 μM to 5mM for diabetics.16–20 As was expected, these monoboronic acid probes show a higher affinity toward fructose over glucose28 (Fig. 6). From Figure 6 one can see a ≈9-fold decrease in fluorescence intensity with 60 mM fructose, and a ≈2-fold change in the presence of 2mM fructose, obtained for o-BMOQBA. Interestingly, the other two isomers saturate with about 15mM fructose, a ≈3-fold reduction in the fluorescence intensity typically observed. The dissociation constants, KD, of the probes for both glucose and fructose in pH 7.5 phosphate buffer are presented in Table 1. As mentioned above, a higher affinity for fructose is a general observation for monophenyl boronic acid derivatives, but it should be noted that the concentration of fructose in tears is substantially lower than for glucose.16–20
Figure 5.
Emission spectra of o-BMOQBA in pH 7.5 phosphate buffer with increasing glucose concentrations (top), the respective 450 nm intensity ratio for all three isomers in the absence, I′, and in the presence, I, of glucose, respectively, (middle), and in the tear glucose concentration range (bottom).
Figure 6.
The 450 nm emission intensity ratio for the BMOQBA probes in the absence, I′, and in the presence, I, of fructose (top), and in the low concentration range of fructose (bottom).
4. Conclusions
We have developed a range of new boronic acid containing probes for the detection and determination of monosaccharides in contact lens polymers. As compared to other published probes,25–30 these new probes are readily water soluble, highly fluorescent with quantum yields comparable to that of fluorescein,31 and have suitable spectral characteristics enabling them to be readily excited using cheap laser or even light emitting diodes. The binding affinities (disassociation constants) toward glucose are most attractive for ophthalmic glucose monitoring, in part due to the charge stabilization of the negatively charged boronatediester (sugar-bound form) by the positively charged quaternary nitrogen center. In this letter, we have indeed shown how one can tune the pKa of the probes to address the sensing constraints imposed by the microenvironment of a contact lens polymer. The response of the new probes, with regard to ophthalmic glucose determination, will be reported in due course.
5. Experimental
5.1. Materials
All chemicals were purchased from Aldrich and used as received for the synthesis of isomeric boronic acid probes and the control compound.
5.2. Methods
All steady-state fluorescence measurements were undertaken in 4*1*1 cm fluorometric plastic cuvettes, using a Varian Cary Eclipse fluorometer, and all absorption measurements were performed using a Varian UV/VIS 50 spectrophotometer. Time-resolved intensity decays were measured using reverse start-stop time-correlated single-photon timing (TCSPC), with a Becker and Hickl Gmbh 630 SPC PC card and unamplified MCP-PMT. Vertically polarized excitation at ≈372 nm was obtained using a pulsed LED source (1 MHz repetition rate) and a dichroic sheet polarizer. The instrumental response function was ≈1.1 ns fwhm. The emission was collected at the magic angle (54.7°), using a long pass filter (Edmund Scientific) which cut-off the excitation wavelengths.
5.3. Data analysis
Titration curves with pH were determined in buffer solution: pH3 and 4 acetate buffer; pH 5–9 phosphate buffer and pH10 and 11 carbonate buffer. Titration curves were fitted and pKa (pKa=−Log10Ka) values were obtained using the relation:
| (1) |
where Iacid and Ibase are the intensity limits in the acid and base regions, respectively.
Stability (KS) and dissociation (KD) constants were obtained by fitting the titration curves, with sugar, using the relation:
| (2) |
where Imin and Imax are the initial (no sugar) and final (plateau) fluorescence intensities of the titration curves, where KD = (1/KS).
The fluorescence intensity decays were analyzed in terms of the multi-exponential model:
| (3) |
where αi, are the amplitudes and τi the decay times, .
The values of αi, and τi were determined by nonlinear least squares impulse reconvolution with a goodness-of-fit criterion.
5.4. Synthesis
The boronic acid containing fluorescent probes o-, m-, and p-BMOQBA and a control compound BMOQ, were conveniently prepared using the following generic one-step synthetic procedure, described for BMOQ. The corresponding o-, m-, or p-boronobenzyl bromides were used instead of benzyl bromide to obtain the isomeric boronic acid derivatives o-, m-, and p-BMOQBA, respectively. Equimolar amounts of 6-methoxyquinoline and benzyl bromide were dissolved in dry acetonitrile (10 mL), in a 25 mL round bottomed flask equipped with a magnetic stirrer. The reaction mixture was allowed to stir under an inert atmosphere for 24 h at room temperature. During this time, a quantitative amount of quaternized salt, BMOQ, was precipitated out as a colorless solid, was filtered, and then washed several times with dry acetonitrile and subsequently dried under vacuum for 12h.
5.4.1. Spectral data for compound BMOQ.
1H NMR (CD3OD) δ (ppm) 4.1 (s, 3H), 6.3 (s, 2H), 7.3–7.5 (m, 5H), 7.85 (m, 2H), 8.15 (t, 1H), 8.45 (d, 1H), 9.2 (d, 1H), and 9.4 (d, IH). HRMS (FAB+, H2O) m/e calcd: 250.1232 (M+–Br), found: 250.1222 (M+–Br).
5.4.2. Spectral data for compound o-BMOQBA.
1H NMR (CD3OD) δ (ppm) 4.05 (s, 3H), 6.5 (s, 2H), 7.1 (s, 1H), 7.3–7.5 (m, 2H), 7.8–8.0 (m, 4H), 8.5 (t, 1H), 8.8 (d, 1H), and 9.1 (d, IH). HRMS (FAB+, H2O) m/e calcd: 362.1927 (M+–Br), found: 362.1960 (M+–Br).
5.4.3. Spectral data for compound m-BMOQBA.
1H NMR (D2O) δ (ppm) 4.0 (s, 3H), 6.2 (s, 2H), 7.35–7.55 (m, 2H), 7.6–7.8 (m, 4H), 8.0 (t, 1H), 8.25 (d, 1H), 8.95 (d, 1H), and 9.15 (d, IH). HRMS (FAB+, H2O) m/e calcd: 362.1927 (M+–Br), found: 362.1848 (M+–Br).
5.4.4. Spectral data for compound p-BMOQBA.
1H NMR (D2O) δ (ppm) 4.0 (s, 3H), 6.2 (s, 2H), 7.25 (d, 2H), 7.5–7.8 (m, 4H), 8.0 (t, 1H), 8.2 (d, 1H), 8.95 (d, 1H), and 9.15 (d, IH). HRMS (FAB+, H2O) m/e calcd: 362.1927 (M+–Br), found: 362.1956 (M+–Br).
Acknowledgements
This work was supported by the NIH National Center for Research Resource, RR-08119. The Authors also thank UMBI for financial support to C.D.G. and J.R.L.
Footnotes
Supplementary data
Supplementary data associated with this article can be found, in the online version, at doi:10.1016/j.bmc.2004.09.058.
References and notes
- 1.The diabetes control and complications trial research group. Diabetes 1997, 48, 271–286. [PubMed] [Google Scholar]
- 2.The diabetes control and complications trial research group N. Engl. J. Med 1993, 329, 977–986. [DOI] [PubMed] [Google Scholar]
- 3.Claremont DJ; Sambrook IE; Penton C; Pickup JC Diabetologa 1986, 29, 817. [DOI] [PubMed] [Google Scholar]
- 4.Yokowama K; Sode K; Tamiya E; Karube I Anal. Chim. Acta 1989, 218, 137. [Google Scholar]
- 5.Robinson MR; Eaton RP; Haaland DM; Koepp GW; Thomas EV; Stallard BR; Robinson PL Clin. Chem 1992, 38, 1618–1622. [PubMed] [Google Scholar]
- 6.Heise HM; Marbach R; Koschinsky TH; Gries FA Ann. Occup. Hyg 1994, 18, 439–447. [DOI] [PubMed] [Google Scholar]
- 7.March WF; Rabinovitch B; Adams R; Wise JR; Melton M Trans. Am. Soc. Artif. Intern. Organs 1982,28, 232–235. [PubMed] [Google Scholar]
- 8.Rabinovitch B; March WF; Adams RL Diabetes Care 1982, 5, 254–258. [DOI] [PubMed] [Google Scholar]
- 9.Schier GM; Moses RG; Gan IET; Blair SC Diabetes Res. Clin. Pract 1988, 4, 177–181. [DOI] [PubMed] [Google Scholar]
- 10.Clarke W; Becker DJ; Cox D; Santiago JV; White NH; Betschart J; Eckenrode K; Levandoski LA; Prusinki EA; Simineiro LM; Snyder AL; Tideman AM; Yaegar T Diabetes Res. Clin. Pract 1988, 4, 209–214. [DOI] [PubMed] [Google Scholar]
- 11.Trettnak W; Wolfbeis OS Anal. Chim. Acta 1989, 221, 195–203. [Google Scholar]
- 12.Meadows D; Schultz JS Talanta 1988, 35, 145–150. [DOI] [PubMed] [Google Scholar]
- 13.Tolosa L; Malak H; Rao G; Lakowicz JR Sens. Actuators B, Chem 1997, 45, 93–99. [DOI] [PMC free article] [PubMed] [Google Scholar]
- 14.Tolosa L; Gryczynski I; Eichorn LR; Dattelbaum JD; Castellano FN; Rao G; Lakowicz JR Anal. Biochem 1999,267, 114–120. [DOI] [PMC free article] [PubMed] [Google Scholar]
- 15.D’Auria S; Dicesare N; Gryczynski Z; Gryczynski I; Rossi M; Lakowicz JR Biochem. Biophys. Res. Commun 2000, 274, 727–731. [DOI] [PubMed] [Google Scholar]
- 16.Badugu R; Lakowicz JR; Geddes CD Anal. Chem 2004, 76, 610–618. [DOI] [PMC free article] [PubMed] [Google Scholar]
- 17.Badugu R; Lakowicz JR; Geddes CD J. Fluoresc 2003, 13, 371–374. [DOI] [PMC free article] [PubMed] [Google Scholar]
- 18.Geddes CD; Badugu R; Lakowicz JR Biophoton. Int 2004, 11(2), 50–53. [Google Scholar]
- 19.Badugu R; Lakowicz JR; Geddes CD The Analyst 2004, 129, 516–521. [DOI] [PMC free article] [PubMed] [Google Scholar]
- 20.Badugu R; Lakowicz JR; Geddes CD J. Fluoresc 2004, 14, 617–633. [DOI] [PMC free article] [PubMed] [Google Scholar]
- 21.Sugihara JM; Bowman CM J. Am. Chem. Soc 1958, 80, 2443. [Google Scholar]
- 22.Yang W; He H; Drueckhammer DG Angew. Chem., Int. Ed 2001, 40, 1714. [PubMed] [Google Scholar]
- 23.Smith BD; Gardiner SJ; Munro TA; Paugam MF; Riggs JA J. Inclusion Phenom. Mol. Recognit. Chem 1998, 32, 121. [Google Scholar]
- 24.Soundararajan S; Badawi M; Kohlrust CM; Hagerman JH Anal. Biochem 1989, 178, 125. [DOI] [PubMed] [Google Scholar]
- 25.James TD; Sandanayake KRAS; Shinkai S Angew. Chem., Int. Ed. Engl 1994, 33, 2207. [Google Scholar]
- 26.James TD; Sandanayake KRAS; Iguchi R; Shinkai SJ Am. Chem. Soc 1995, 117, 8982. [Google Scholar]
- 27.(a) Bielecki M; Eggert H; Norrild JC J. Chem. Soc., Perkin Trans 2 1999, 449; [Google Scholar]; (b) Eggert H; Frederiksen J; Morin C; Norrild JC J. Org. Chem 1999, 64, 3846–3852. [Google Scholar]
- 28.Dicesare N; Lakowicz JRJ Photochem. Photobiol. A: Chem 2001, 143, 39–47. [DOI] [PMC free article] [PubMed] [Google Scholar]
- 29.Dicesare N; Lakowicz JR Tetrahedron Lett. 2002, 43, 2615–2618. [DOI] [PMC free article] [PubMed] [Google Scholar]
- 30.Dicesare N; Lakowicz JR J. Phys. Chem. A 2001, 105, 6834–6840. [DOI] [PMC free article] [PubMed] [Google Scholar]
- 31.Lakowicz JR Principles of Fluorescence Spectroscopy, 2nd ed.; Kluwer Academic/Plenum: New York, 1999. [Google Scholar]
- 32.Geddes CD Meas. Sei. Technol 2001, 72(9), R53. [Google Scholar]
- 33.Wolfbeis OS; Urbano E J. Heterocycl. Chem 1982, 19, 841–843. [Google Scholar]
- 34.Photoinduced Electron Transfer; Fox MA, Chanon M, Eds.; Elsevier: New York, 1998, Parts A-D. [Google Scholar]
- 35.Kavarnos GJ Fundamentals of Photoinduced Electron Transfer; VCH: New York, 1993. [Google Scholar]


