Abstract
Three water-soluble fluorescent probes have been specifically designed to determine free cyanide concentrations up to physiologically lethal levels, >20 μM. The probes have been designed in such a way as to afford many notable sensing features, which render them unique with regard to signal transduction, photophysical characteristics, and their application to physiological cyanide determination and safeguard. The probes are readily able to reversibly bind free aqueous cyanide with dissociation constants around 4 μM3. Subsequent cyanide binding modulates the intramolecular charge transfer within the probes, a change in the electronic properties within the probes, resulting in enhanced fluorescence optical signals as a function of increased solution cyanide concentration. The ground-state chelation with cyanide produces wavelength shifts, which also enable the probes to sense cyanide in both an excitation and emission ratiometric manner, in addition to enhanced fluorescence signaling. This has enabled a generic cyanide sensing platform to be realized that is not dependent on fluorescent probe concentration, probe photodegradation, or fluctuations in the intensity of any employed excitation sources, ideal for remote cyanide sensing applications. Further, the >600 nm fluorescence emission of the probes potentially allows for enhanced fluorescence ratiometric cyanide sensing in the optical window of tissues and blood, facilitating their use for the transdermal monitoring of cyanide for mammalian safeguard or postmortem in fire victims, both areas of active research.
Introduction
Cyanide has long been known to be a toxic substance.1 The mechanism of cyanide poisoning is by absorption through the GI track, skin, and lungs. Cyanide’s toxicity lies in its ability to inhibit oxygen utilization by cells, binding to the active site of cytochrome oxidase,2,3 hence, the tissues with the highest oxygen requirement (brain, heart, and lungs) are the most affected by acute poisoning.1
While it is difficult to give an exact lethal dosage or exposure limit, it is estimated that the intravenous dose that is lethal to 50% of the exposed population (LD50) for HCN for an adult is 1.0 mg/Kg, and the estimated lethal dose for liquid contact, that is, on the skin, is about 100 mg/Kg.1 Recent studies on both fire victims and survivors have shown that survivors were found to have <20 μM blood cyanide, while victims were found to have levels ~20–30 μM and, in some cases, much higher.4–6 Hence, any cyanide monitoring analytical technique to ensure physiological safeguard would therefore need a cyanide dynamic range from a few to ~30 μM free cyanide.
While cyanide has earned a well-deserved reputation as the lethal poison in television murder/mystery, it is somewhat surprising to learn that the raw material finds common industrial use in organic chemicals and polymers, such as nitriles, nylon, and acrylic plastics,7 as well as being a critical reagent in the gold-extraction process.1,8 Subsequently, there is a widespread need to develop versatile small-molecule cyanide sensors for use in a variety of settings.
There have been numerous techniques developed for the detection and determination of aqueous free cyanide9–13 and indeed may other inorganic anions. These techniques include potentiometric, chromatographic, and flow injection to name just a few.9–13 However, these systems are not simple or cheap and cannot be applied to physiological monitoring or used to monitor drinking waters alike, many requiring the benefits of an analytical laboratory.9–13 It is worth noting that one recent paper, however, has made some progress in this regard by developing a small-molecule lifetime-based sensor based on a luminescent Ru(II) metal complex14 that readily chelates cyanide. While the benefits of lifetime-based sensing are well-known compared to those of simple absorption or fluorescence-based measurements, lifetime-based measurements are considerably more complex, expensive, and generally require more time for data acquisition. One powerful alternative, however, is a technique based on fluorescence excitation and/or emission ratiometric sensing.15,16 Similar to lifetime-based sensing, this approach is impervious to experimental artifacts, such as probe concentration, excitation source intensity fluctuations, light scattering, and detector drift, but has the added attraction of being conceptually simple, with the instrumentation costs being significantly lower than that for time-resolved lifetime-based sensing.15,16
In this article, we describe a very powerful set of new fluorescent probes, which are readily able to detect cyanide concentrations in the range of 1–30 μM in the presence of a high background of potential physiological interferents, such as aqueous chloride. The reduced intramolecular charge transfer of the probes upon cyanide chelation provides for the fluorescence emission enhancements observed, effectively increasing the signal-to-noise ratio for sensing, as a function of cyanide concentration. Subsequently, we have developed the first sensors for cyanide based on direct and enhanced fluorescence, which are not prone to biological interferences, such as chloride or oxygen, which is not likely to be the case for a recently reported Ru(II)-based sensor.14 In addition, the Ru(II)-based sensor has the disadvantage of reduced intensity as a function of cyanide, which is in contrast to our new sensing format. Further, the red nature of our fluorescence emission is likely to provide for cyanide sensing in blood or perhaps even transdermally, where the absorption by hemoglobin and water is minimal.17
Subsequently, we believe we have demonstrated the first proof-of-concept for enhanced fluorescence wavelength ratiometric small-molecule cyanide sensing, which is a platform also applicable to other anions.
Results and Discussion
Reduced ICT Resulting in Enhanced Fluorescence Emission.
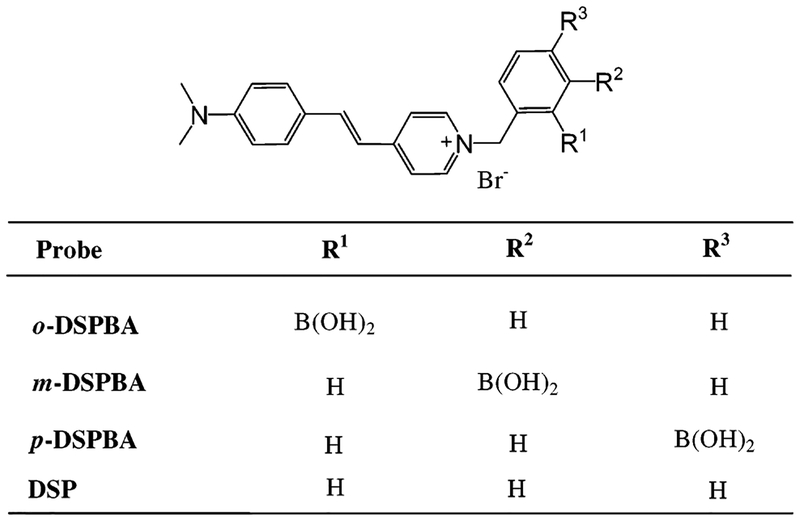
The signal transduction mechanism employed with the new probes affords several key probe features, making the probes unique compared to other cyanide sensing schemes.9–14 The sensing scheme is based on the ability of boronic acid to complex cyanide18 and its change from being electron deficient (R–B(OH)2) in the absence of cyanide at physiological pH to being electron rich (R–B−(CN)3) upon cyanide complexation (Figures 1 and 2). The modulation in the electron-donating capabilities of the boronic acid group in the presence and absence of cyanide directly influences the intramolecular charge transfer (ICT) from the amino group to the electron-deficient quaternary nitrogen center.15 In the absence of cyanide, ICT is efficient, with the probe being effectively quenched. However, in the presence of cyanide, the extent of ICT from the amino group to the positively charged nitrogen is reduced, facilitated by an increased electron donation from the cyanide-complexed boronic acid to the quaternary nitrogen. This reduction in ICT (effectively unquenching) affords an enhanced and wavelength-shifted fluorescence as a function of cyanide concentration.
Figure 1.
Molecular structures of cyanide.
Figure 2.
Complexation of DSPBA probes with aqueous free cyanide.
The binding of cyanide to the DSPBA (4-[4-(N,N-dimethylamino)styryl]-1-(x-boronobenzyl)pyridinium bromide (where x is 2, 3, or 4 for ortho-, meta-, or para, respectively) probes in the ground state readily leads to changes in the absorption spectra. These changes are also manifested in the excited state, where wavelength shifts and intensity changes in the fluorescence emission spectra can be readily observed, both the free and cyanide-bound DSPBA forms being fluorescent when excited at the isosbestic point, ~440 nm.
Subsequently, these changes readily allow both an excitation and emission wavelength ratiometric response to cyanide at levels of significant physiological importance.1
Excitation Wavelength Ratiometric Response to Cyanide.
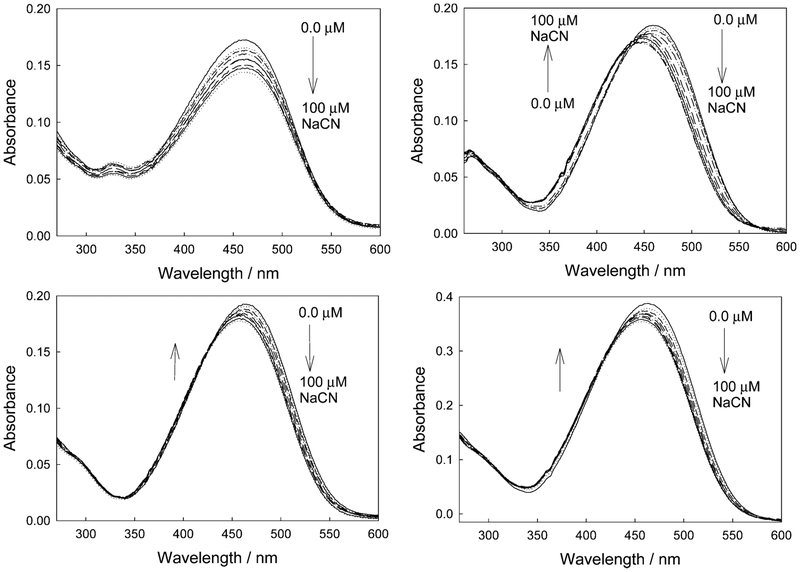
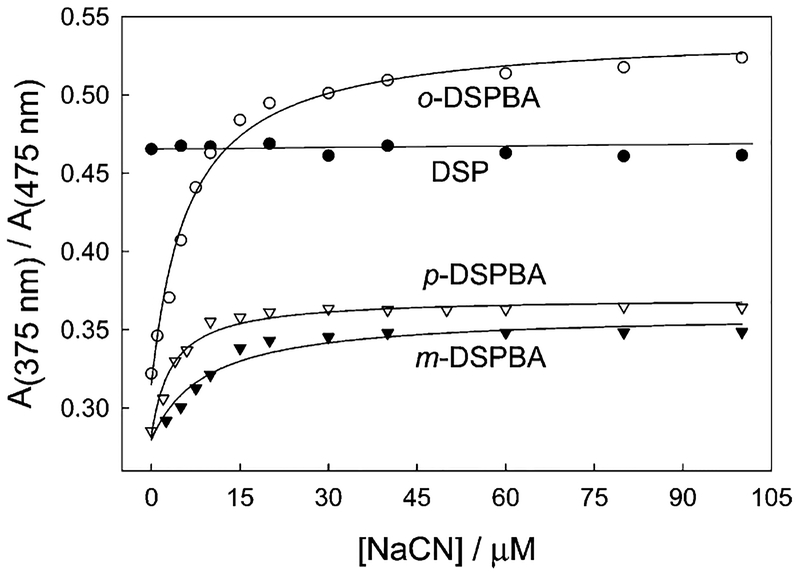
In the presence of cyanide, the control compound (4-[4-(N,N-dimethylamino)styryl]-1-benzylpyridinium bromide, DSP), which does not contain the cyanide chelating group, shows a very slight response to cyanide (hypsochromic effect), which is attributed to a trivial cyanide–nitrogen electrostatic interaction19 (Figure3, top left). However, ortho-, meta-, and para-DSPBA typically show a hypsochromic shift in the absorption spectra as a function of cyanide addition (Figure 3). These changes are due to a reduction in ICT in the conjugated backbone, facilitated by the electron-donating capability of the R–B−(CN)3 upon cyanide addition. These wavelength shifts and extinction changes readily support wavelength ratiometric sensing, as can be seen in Figure 4.
Figure 3.
Absorption spectra of DSP in water with increasing cyanide concentrations (top left), and for the ortho-, meta-, and para-DSPBA probes with increasing cyanide concentrations (top right, bottom left, and bottom right, respectively).
Figure 4.
Ratiometric response of the probes in water with increasing cyanide concentrations.
By plotting the absorption values at 475/375 nm, we can clearly see that DSP shows little or no response to cyanide, with o-DSPBA showing a notable change over the range of physiological importance, that is, up to 30 μM free cyanide.1 It should be noted that the dynamic response range is typically 2-fold, with the data plotted as the inverse (375/475 nm) in Figure 4 so as to visualize the classic shapes of the binding isotherms to which eq 1 can readily be applied to determine the binding/dissociation constants. Interestingly, o-DSPBA shows a much better response to cyanide than do the other two isomers. We attribute this to the shorter distance and, therefore, more effective electrostatic interaction of the positively charged quaternary nitrogen center with the electron-rich boron atom upon cyanide complexation.20–22 The cyanide concentrations of physiological importance can therefore be monitored using simple absorption-based measurements and ratiometric hypsochromic shifts.
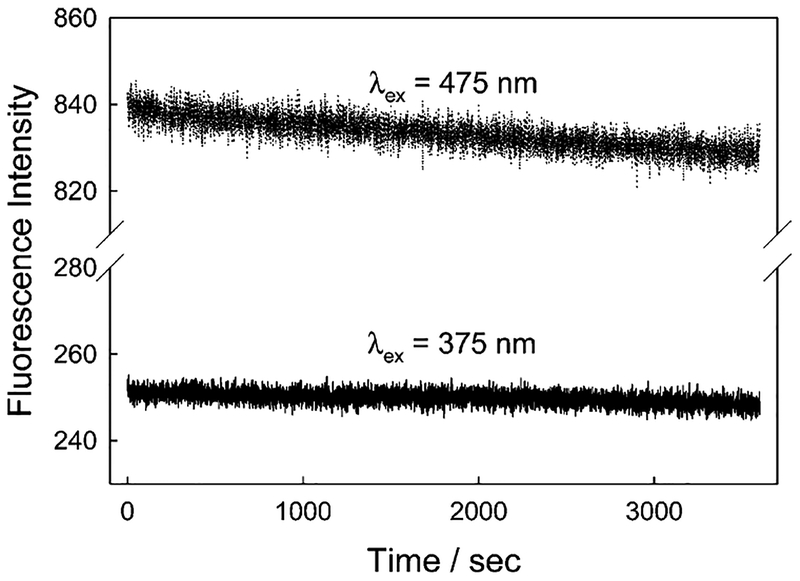
For a practical working sensor, which could be potentially deployed in the field to monitor drinking, stream, or reservoir waters, etc., it is not practical to determine the cyanide concentration by using entire absorption spectra. Much better, however, is an excitation wavelength ratiometric approach which utilizes two excitation wavelengths and simply ratios the respective fluorescence intensity bands. This practical approach requires that fluctuations in excitation photon flux are minimal, which is easily attainable if one utilizes low power, cheap, light-emitting diode (LED) and laser diode (LD) sources.23 Such sources are currently having a major impact in simplifying remote sensing and indeed in fluorescence spectroscopy as a whole.15 Using o-DSPBA, we subsequently measured the intensity at 600 nm as a function of time for both 375 and 475 nm excitation, two wavelengths compatible with current LED sources15,23 (Figure 5). The emission at 475 nm typically shows a 1% loss in intensity after 1 h. This very slight decrease may reflect a slight drift in the xenon arc light source of the fluorometer, as a similar decrease was also observed for the 600 nm emission when excited at 375 nm, noting the y-axis scale of Figure 5. It is worth noting that the trends in Figure 5 are unlikely to reflect the photostability of DSPBA under these conditions, as only a small fraction of the 4 × 1 × 1 cm cuvette was illuminated with moderate intensity (0.5 cm beam diameter), unperturbed dye readily being able to replenish any photodegraded DSPBA via rapid diffusion. In any case, our ratiometric approach removes any issues related to source photon flux drift on the time scale of data collection.
Figure 5.
Fluorescence emission of o-DSPBA in water with time when excited at 475 and 375 nm.
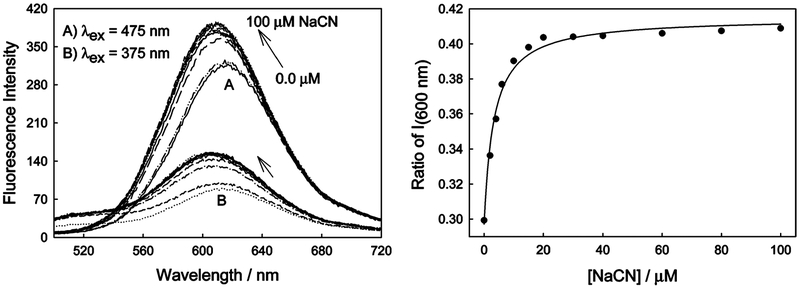
Figure 6 (left panel) shows the emission spectra of o-DSPBA in water as a function of cyanide addition when excited at 375 and 475 nm. For both excitation wavelengths, we typically see a blue-shifted and increased fluorescence emission. This is consistent with reduced ICT as a function of cyanide binding, which is described in more detail in the next section. Figure 6 (right panel) shows the subsequent ratiometric response plotted for fluorescence intensity values from 375/475 nm excitation, again, plotted to reflect the familiar shape of binding isotherms and its utility by eq 1, the dynamic sensing range therefore being >2, that is, when plotted inversely as the intensity from 475/375 nm excitation. Interestingly, o-DSPBA saturates at about 30 μM free cyanide, a concentration which is considered to be the lethal free cyanide blood limit.1 In addition, the dynamic sensing range could be further optimized by choosing other emission wavelengths; however, we chose the emission maximum at ~600 nm since this is optimal with regard to signal level and would, therefore, be practical for remote sensing applications.
Figure 6.
Fluorescence emission spectra of o-DSPBA in water with cyanide for both 375 and 475 nm excitation (left), and the respective ratiometric plot for the intensity at 600 nm (i.e., 375/475 nm) (right).
Emission Wavelength Ratiometric Response to Cyanide.
Both the free (uncomplexed) and bound (complexed) cyanide forms of the DSPBA probes were found to be fluorescent, which additionally allows for the possibility of sensing cyanide in an emission wavelength ratiometric manner, that is, by using one excitation wavelength and taking the intensity ratio at two different emission wavelengths. This sensing format is well-known to have its many advantages,15,24 in particular, the simplicity and cost of one LED or LD as the excitation source and two narrow band-pass or interference filters to select the emission wavelength(s).
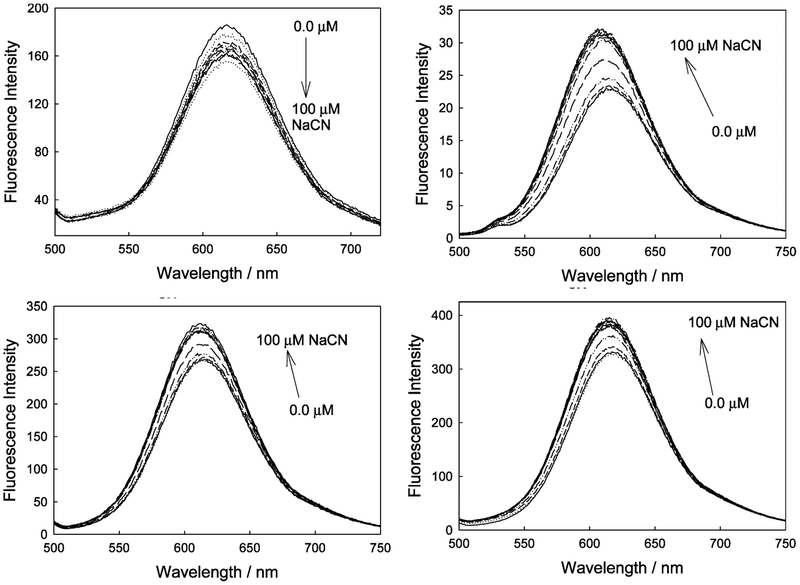
Figure 7 shows the response of the control compound (DSP) and the cyanide binding probes (DSPBAs) toward free aqueous cyanide. DSP typically shows a slight decrease in emission intensity when excited at 440 nm as a function of cyanide addition, which is thought to be due to minor collisional quenching. We subsequently determined the Stern–Volmer constant25 (KSV) to be 7800 M−1. Importantly, no wavelength shifts are observed, clearly indicating that for the control compound, cyanide is not involved in any ICT-based signal transduction.
Figure 7.
Fluorescence spectra of DSP in water with increasing cyanide concentrations (top left), and also for the ortho-, meta-, and para-DSPBA probes with increasing cyanide concentrations (top right, bottom left, and bottom right, respectively).
Upon cyanide binding to the DSPBA probes, we typically observe an enhanced and blue-shifted emission spectrum, indicative of reduced ICT,15 due to the change in electron density of the boronic acid moiety upon cyanide binding and its subsequent influence on the charge transfer between the amino group (donor) and the electron-deficient quaternary nitrogen center (acceptor) (Figure 7). The response of the ortho probe is, again, the largest, while beyond the scope of this text, it is thought to reflect the distance dependence of the through-space interaction between the electron-deficient nitrogen and the electron-rich R–B−(CN)3.
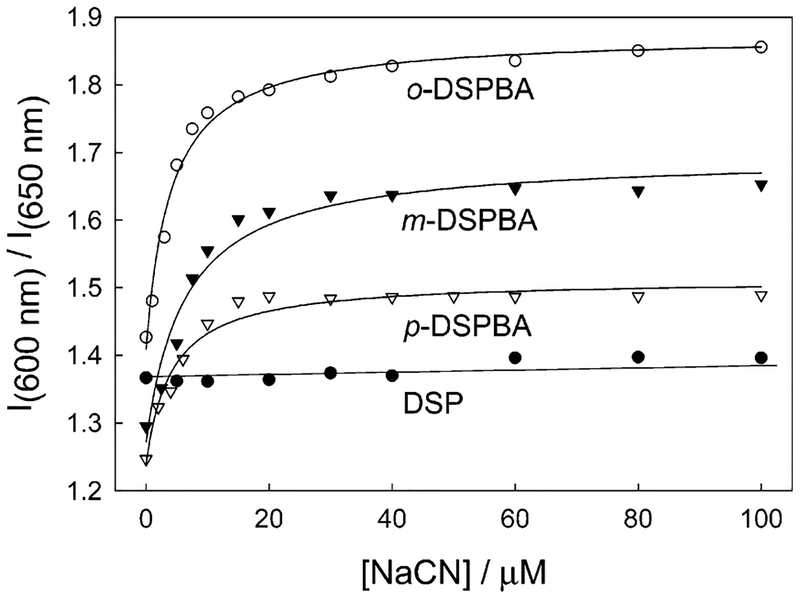
We subsequently chose two wavelengths where the intensity was notable, 600 and 650 nm, and measured the emission wavelength ratiometric response (Figure 8). As expected, DSP shows no ratiometric response compared to the classic shapes of the binding isotherms determined for the DSPBA probes. Subsequently, from these binding curves and eq 1, we were able to determine the cyanide dissociation constants to be 4.03, 25.50, and 4.16 μM3 for ortho-, meta-, and para-DSPBA, respectively.
Figure 8.
Emission ratiometric response of the probes in water with increasing cyanide concentrations.
From a sensing perspective, Figure 8 shows that an approximately 2-fold dynamic range for cyanide is present, importantly, using emission wavelengths that provide measurable and notable signal levels. Clearly from Figure 8, these curves could be optimized depending on instrumental parameters and requirements. The enhanced fluorescence nature of the signal transduction affords a much better signal-to-noise ratio for this cyanide-sensing scheme, which is of major significance compared to others previously published.9–14 Finally, Figure 8 shows that the probes saturate between 20 and 30 μM free cyanide, a physiological lethal threshold,1 which to the best of our knowledge, has not been addressed by other small-molecule sensors.
Interferences, Scope, and Limitation.
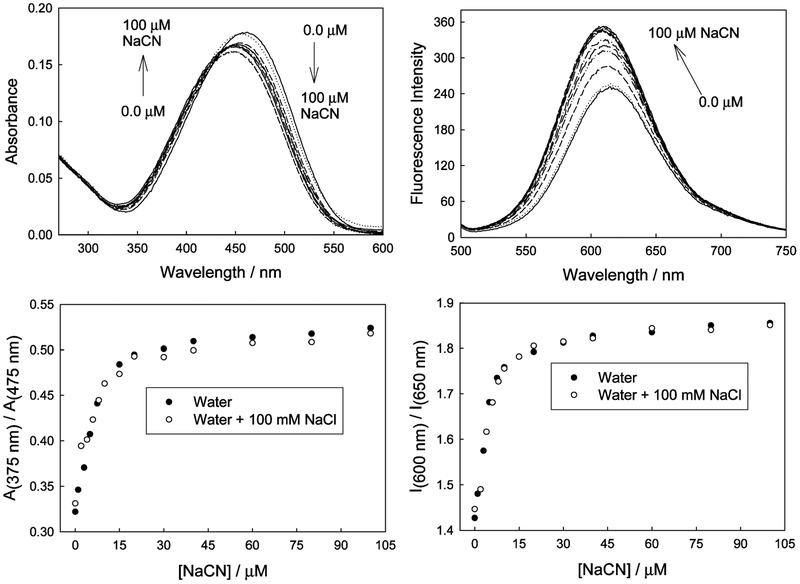
As with any sensing scheme, it is important to determine the degree of interference from other physiological analytes. We subsequently considered the response of the probes in the presence of a large excess of aqueous chloride, which is well-known to collisionally quench fluorescence15,25 (Figure 9). We can clearly see that the presence of up to 100 mM NaCl has no interference on the determination of cyanide up to physiologically lethal levels (Figure 9, bottom left and right), suggesting that the lifetime of the probe is relatively short.25 At high cyanide concentrations, where the physical and therefore optical responses have effectively been saturated, a slight interference by chloride can be seen. This reflects the longer lifetime of the DSPBA probes due to reduced ICT and, therefore, the greater probability of an excited state chloride collisional encounter.25 It is worth noting that the fluorophore concentration was 3 μM for these experiments, and for the equilibrium shown in Figure 2, it is difficult to assign K1, K2, and K3. This is because no additional information is provided from the ICT-induced optical response, probably reflecting the fact that further addition of cyanide (i.e., K2 and K3) does not substantially change the electron density on the boron atom after the first cyanide complexation (i.e., K1).
Figure 9.
Absorption and emission spectra of o-DSPBA in water with increasing cyanide concentration and having a 100 mM NaCl background (top), and the respective excitation and emission ratiometric plots (bottom).
In addition, boronic acid-based fluorophores have earned a well-deserved reputation for sensing diol-containing compounds, such as monosaccharides,26–31 and both fluoride32 and pH.33 We have found that the binding constants for glucose, fructose, fluoride, and pH are significantly smaller than those for cyanide, demonstrating that they are not potential interferents on this sensing scheme.26–33 In addition, changes in pH in physiologies, or even drinking waters, are uncommon, and therefore, pH interference is likely to be minimal also. In this regard, the pKa of the aromatic amino group of DSPBA is likely to be around 3 and, therefore, not prone to protonation, which could potentially interfere with the fluorescence signaling mechanism. Further, given the relatively higher KD values of boronic acid for fluoride, compared to those for cyanide, and given that the concentration of fluoride in drinking water fluctuates in the low micromolar range,32 these new probes are most unlikely to be perturbed by fluoride in drinking waters.
Finally, it is worth noting that another key feature of these cyanide probes is their long wavelength emission, relative to past boronic acid-based probes.26–31 In fact, a key design feature of probes for clinical applications is determined, in part, by the optical properties of water and tissues. The region of low absorption for tissues and blood is from ~600 to 900 nm, the so-called therapeutic range,17 where one minimizes absorption by hemoglobin and water. Subsequently, these probes were designed, in part, due to their emission characteristics (>600 nm), making them applicable to either blood sensing/screening or transdermal cyanide sensing. While we have not tested these probes in physiological environments to date, the authors are not aware of any other probes that are capable of transdermally measuring cyanide levels, never mind using enhanced fluorescence-based transduction.
Conclusions
We have developed a range of water-soluble fluorescent probes which are capable of determining cyanide levels up to physiologically lethal levels in both an excitation and an emission wavelength ratiometric manner. The probes have a notable dynamic sensing range and show saturation just after physiologically lethal levels, making them ideal candidates for applications of human safeguard. In addition, the emission of the probes falls within the optical window of blood and tissues, enabling the possibility for transdermal blood monitoring or even their use postmortem for the determination of cyanide levels in fire victims, an area of active research. Finally, the signal transduction mechanism is one based on reduced charge transfer, affording enhanced fluorescence signals as a function of cyanide concentration, enabling an enhanced signal-to-noise ratio during sensing to be achieved. This sensing scheme, while generic to cyanide by the nature of its specific design and the key photophysical probe properties, could be applied as a more general approach for sensing other analytes of interest, such as fluoride and pH.
Experimental Section
Methods.
All steady-state fluorescence measurements were under-taken in 4 × 1 × 1 cm fluorometric plastic cuvettes, using a Varian Cary Eclipse fluorometer, and all absorption measurements were performed using a Varian UV–vis 50 spectrophotometer.
Data Analysis.
Stability (KS) and dissociation (KD) constants were obtained by fitting the titration curves with cyanide using the relation
| (1) |
where Imin and Imax are the initial (no cyanide) and final (plateau) fluorescence intensities of the titration curves, respectively, where KD = (1/KS). (KS units are in μM−3 or mol−3 dm9 for CN−, and mM−1 or mol−1 dm3 for monosaccharides, such as glucose and fructose.18) This kinetic equation, which is widely used to recover the stability constants for boronic acid–glucose interactions20–22 has also been utilized here for cyanide binding with both reliable and reproducible fitting parameters being obtained. The equation has been used to model the general cyanide-binding isotherm, and no inference on the values of K1, K2, or K3 can be made from the data.
Materials and Preparation of the Cyanide-Sensitive Probes.
All chemicals were purchased from Sigma-Aldrich at the highest purity available. Bromomethylphenylboronic acids were either purchased from Combiblocks or prepared from the corresponding methylphenylboronic acids using N-bromosuccinimide and a peroxide initiator as described in the literature.32 The boronic acid containing fluorescent probes (o-, m-, and p-DSPBA) and a control compound (DSP) were prepared using the following one-step synthetic procedure, described below for the control compound DSP. The corresponding o-, m-, or p-boronobenzyl bromides are employed instead of benzyl bromide to obtain the isomeric boronic acid derivatives o-, m-, and p-DSPBA, respectively (Figure 1). Equimolar amounts of 4-[4-(N,N-dimethylamino)styryl]pyridine and benzylbromide were dissolved in 10 mL of dry acetonitrile in a 25 mL round-bottomed flask equipped with a magnetic stirrer. The reaction mixture was allowed to stir under an inert atmosphere for 24 h at room temperature. During this time, a quantitative amount of quaternized salt was precipitated as a brown–reddish solid. The solid product was recovered by filtration, washed several times with dry acetonitrile, and then dried under vacuum for 12 h. The obtained compounds were further purified for use in the spectral measurements using preparative TLC (silica gel, 20% methanol in dichloromethane).
Analytical Data for Compound DSP.
1H NMR (D2O): δ 3.1 (s, 6H), 5.6 (s, 2H), 6.8 (d, 2H), 7.1 (d, 1H), 7.4–7.6 (m, 5H), 7.7 (d, 2H), 7.9 (d, 1H), 8.0 (d, 2H), 8.7 (d, 2H). 13C NMR (DMSO-d6): δ 43.6 (2C), 59.6 (1C), 113.0 (2C), 124.4 (1C), 124.8 (1C), 125.5 (1C), 127.1 (2C), 128.4 (2C), 129 (2C), 129.2 (2C), 130.8 (1C), 137.7 (1C), 142.5 (2C), 143.7 (1C), 148.4 (1C). HRMS (FAB+, H2O): m/e calculated 315.1856 (M+), found 315.1861 (M+).
Analytical Data for Compound o-DSPBA.
1H NMR (D2O): δ 3.2 (s, 6H), 5.8 (s, 2H), 7.3–7.7 (m, 6H), 7.8–8.2 (m, 6H), 8.8 (d, 2H). 13C NMR (DMSO-d6): δ 43.5 (2C), 56.5 (1C), 113.0 (2C), 124.4 (1C), 124.8 (1C), 126.0 (1C), 127.1 (2C), 127.5 (1C), 127.8 (1C), 128.0 (1C), 128.5 (1C), 129.0 (2C), 130.8 (1C), 138.0 (1C), 142.5 (2C), 143.7 (1C), 148.4 (1C). HRMS (FAB+, H2O): m/e calculated 359.1925 (M+), found 359.1931 (M+).
Analytical Data for Compound m-DSPBA.
1H NMR (D2O): δ 3.1 (s, 6H), 5.9 (s, 2H), 6.8 (d, 2H), 7.2 (d, 1H), 7.5–7.8 (m, 4H), 7.8–8.1 (m, 5H), 8.6 (d, 2H). 13C NMR (DMSO-d6): δ 43.5 (2C), 60.0 (1C), 113.0 (2C), 124.4 (1C), 124.8 (1C), 126.0 (1C), 126.5 (1C), 126.5 (1C), 127.1 (2C), 128.0 (1C), 128.5 (1C), 129.0 (2C), 130.8 (1C), 138.0 (1C), 142.5 (2C), 143.7 (1C), 148.4 (1C). HRMS (FAB+, H2O): m/e calculated 359.1925 (M+), found 359.1921 (M+).
Analytical Data for Compound p-DSPBA.
1H NMR (D2O): δ 3.1 (s, 6H), 5.7 (s, 2H), 6.8 (d, 2H), 7.1 (d, 1H), 7.5 (d, 2H), 7.7 (d, 2H), 7.9 (d, 3H), 8.0 (d, 2H), 8.8 (d, 2H). 13C NMR (DMSO-d6): δ 43.5 (2C), 59.6 (1C), 113.0 (2C), 124.4 (1C), 124.8 (1C), 126.0 (1C), 127.0 (2C), 127.1 (2C), 128.2 (2C), 129.0 (2C), 130.8 (1C), 138.0 (1C), 142.5 (2C), 143.7 (1C), 148.4 (1C). HRMS (FAB+, H2O): m/e calculated 359.1925 (M+), found 359.1934 (M+).
Acknowledgment.
This work was supported by the National Center for Research Resources, RR-08119. Partial salary support to J.R.L. and C.D.G. from UMBI is also gratefully acknowledged.
References
- (1).Baskin SI; Brewer TG Medical Aspects of Chemical and Biological Warfare; Sidell F, Takafuji ET, Franz DR, Eds.; TMM Publications: Washington, DC, 1997; Chapter 10, pp 271–286 and references therein. [Google Scholar]
- (2).Warburg O Hoppe-Seyler’s Z. Physiol. Chem 1911, 76, 331–346. [Google Scholar]
- (3).Kellin D Proc. R. Soc. London, Ser. B: Biol. Sci 1929, 104, 206–251. [Google Scholar]
- (4).Ishii A; Seno H; Watanabe-Suzuki K; Suzuki O; Kumazawa T Anal. Chem 1998, 70 (22), 4873–4876. [DOI] [PubMed] [Google Scholar]
- (5).Moriva F; Hashimoto YJ For. Sci 2001, 46 (6), 1421–1425. [PubMed] [Google Scholar]
- (6).Baud FJ; Barriot P; Toffis VN Engl. J. Med 1991, 325, 1761–1766. [DOI] [PubMed] [Google Scholar]
- (7).Ullman’s Encyclopedia of Industrial Chemistry, 6th ed.; Wiley-VCH: New York, 1999. [Google Scholar]
- (8).Miller GC; Pritsos CA Cyanide: Social, Industrial, and Economic Aspects; Proceedings of the TMS Annual Meeting, 2001; pp 73–81. [Google Scholar]
- (9).Giuriati C; Cavalli S; Gorni A; Badocco D; Pastore PJ Chromatogr. A 2004, 1023, 105–112. [DOI] [PubMed] [Google Scholar]
- (10).Beck HP; Zhang B; Bordeanu A Anal. Lett 2003, 36, 2211–2228. [Google Scholar]
- (11).Fernandez-Arguelles MT; Costa-Fernandez JMC; Pereiro R; Sanz-Medel A Anal. Chim. Acta 2003, 491, 27–35. [Google Scholar]
- (12).Deep B; Balasubramanian N; Nagaraja KS Anal. Lett 2003, 36, 2865–2874. [Google Scholar]
- (13).Favero JAD; Tubino M Anal. Sci 2003, 19, 1139–1143. [DOI] [PubMed] [Google Scholar]
- (14).Anzenbacher P; Tyson DS; Jursikova K; Castellano FN J. Am. Chem. Soc 2002, 124, 6232–6233. [DOI] [PubMed] [Google Scholar]
- (15).Lakowicz JR Principles of Fluorescence Spectroscopy, 2nd ed.; Kluwer/Academic Plenum Publishers: New York, 1997. [Google Scholar]
- (16).Lakowicz JR Topics in Fluorescence Spectroscopy: Probe Design and Chemical Sensing; Plenum Press: New York, 1994; Vol. 4. [Google Scholar]
- (17).Richards-Kortum R; Sevick-Muraca E Annu. ReV. Phys. Chem 1996, 47, 555–606. [DOI] [PubMed] [Google Scholar]
- (18).Badugu R; Lakowicz JR; Geddes CD Anal. Chem. Acta 2004, 522, 9–17. [DOI] [PMC free article] [PubMed] [Google Scholar]
- (19).Geddes CD; Apperson K; Karolin J; Birch DJ S. Anal. Biochem 2001, 293 (1), 60. [DOI] [PubMed] [Google Scholar]
- (20).Badugu R; Lakowicz JR; Geddes CD Talanta 2005, 65, 762–768. [DOI] [PMC free article] [PubMed] [Google Scholar]
- (21).Badugu R; Lakowicz JR; Geddes CD Dyes Pigm. 2004, 61, 227–234. [DOI] [PMC free article] [PubMed] [Google Scholar]
- (22).Badugu R; Lakowicz JR; Geddes CD J. Fluoresc 2003, 13, 371–374. [DOI] [PMC free article] [PubMed] [Google Scholar]
- (23).Landgraf S Reviews in Fluorescence 2004; Geddes CD, Lakowicz JR, Eds.; Springer Publishers: New York, 2004. [Google Scholar]
- (24).Gryczynski Z; Gryczynski I; Lakowicz JR Methods Enzymol. 2002, 360, 44. [DOI] [PubMed] [Google Scholar]
- (25).Geddes CD Meas. Sci. Technol 2001, 12, R53. [Google Scholar]
- (26).Fang H; Kaur G; Wang BJ Fluoresc. 2004, 14, 481–489. [DOI] [PubMed] [Google Scholar]
- (27).Kawanishi T; Romey MA; Zhu PC; Holody MZ; Shinkai SJ Fluoresc. 2004, 14, 499–512. [DOI] [PubMed] [Google Scholar]
- (28).Cappuccio FE; Suri JT; Cordes DB; Wessling RA; Singaram BJ Fluoresc. 2004, 14, 521–533. [DOI] [PubMed] [Google Scholar]
- (29).Philips MD; James TD J. Fluoresc 2004, 14, 549–559. [DOI] [PubMed] [Google Scholar]
- (30).Cao H; Heagy MJ Fluoresc. 2004, 14, 569–583. [DOI] [PubMed] [Google Scholar]
- (31).Badugu R; Lakowicz JR; Geddes CD J. Fluoresc 2004, 14, 617–633. [DOI] [PMC free article] [PubMed] [Google Scholar]
- (32).Badugu R; Lakowicz JR; Geddes CD Sens. Actuators, B 2005, 104, 103–110. [DOI] [PMC free article] [PubMed] [Google Scholar]
- (33).Badugu R; Lakowicz JR; Geddes CD Dyes Pigm. 2004, 61, 227–234. [DOI] [PMC free article] [PubMed] [Google Scholar]
- (34).Hawkins RT; Snyder HR J. Am. Chem. Soc 1960, 82, 3863. [Google Scholar]


