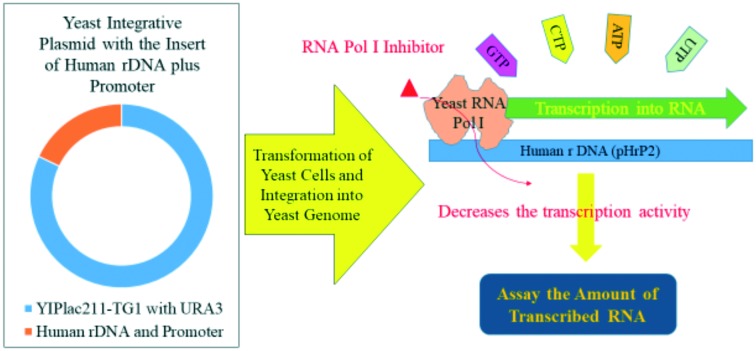
 RNA polymerase I (RNA Pol I) is a “factory” that orchestrates the transcription of ribosomal RNA for constructing ribosomes as a primary workshop for protein translation to sustain cell growth.
Abstract
RNA polymerase I (RNA Pol I) is a “factory” that orchestrates the transcription of ribosomal RNA for constructing ribosomes as a primary workshop for protein translation to sustain cell growth. The deregulation of RNA Pol I often causes uncontrolled cell proliferation, leading to cancer. Efficient and reliable methods are needed for the identification of selective inhibitors of RNA Pol I. Yeast (Saccharomyces cerevisiae) is eukaryotic and represents a valuable model system to study RNA Pol I, especially with the availability of the X-ray crystal structure of the yeast homologue of RNA Pol I, offering a structural basis to selectively target this transcriptional machinery. Herein, we developed a cell-based screening strategy by establishing a stable yeast cell line with a stably integrated human RNA Pol I promoter and ribosomal DNA. The model system was validated using the well-known RNA Pol I inhibitor CX-5461 by measuring transcribed human rRNA as readout. Virtual screening coupled with compound library screening using this cell line enabled the identification of a new candidate inhibitor of RNA Pol I, namely, cerivastatin sodium. Furthermore, we used growth and transcription activity assays to biologically evaluate the hit compound. Preliminary studies demonstrated antiproliferative effects of cerivastatin sodium against human cancer cells, namely, A2780 and H460 cell lines. These results implicated cerivastatin sodium as a selective RNA Pol I inhibitor worthy of further development together with potential as a targeted anticancer therapeutic.
Introduction
Eukaryotic RNA polymerase can be classified as RNA Pol I, II, and III. RNA Pol I is localized in nucleoli and it works with a specific DNA template, such as ribosomal DNA 45s rDNA.1 It is processed by endonuclease into three final rRNAs, namely, 18 S, 5.8 S, and 28 S rRNAs,2 and used as building blocks for the ribosome, that is, the organelle for synthesizing new proteins.3 Transcription by RNA Pol I constitutes up to 60% of all cellular transcription and rRNAs make up about 80% of the RNA content of living cells.4 Therefore, RNA Pol I is a crucial controller of cellular growth and proliferation. The excessive proliferation of cancer cells strongly relies on a much higher capacity of cellular protein synthesis so that they can compensate for errors that occur during protein synthesis.5 The accessibility of rRNA is significant to predicting cellular levels of the ribosome.6 A study by Bywater et al.7 reported direct cellular evidence for enhanced ribosomal DNA transcription levels by increased RNA Pol I activity as a cause of cancer progression. The transcription level of RNA Pol I is a marker to evaluate the risk of cancer, and inhibitors to RNA Pol I could be used as anticancer drugs.8
Identification of a couple of RNA Pol I inhibitors, which work by disturbing the formation of the transcription complex, has proved to be promising. For example, CX-5461 is a potential anticancer drug candidate against diverse cancer tissues by inducing cancer cell autophagy as well as by inhibiting the transcription activity of RNA Pol I via blocking the formation of the transcription initiation complex.1,7 Ellipticines can disrupt the interaction between human rDNA promoter and SL1 during the formation of the Pol I preinitiation complex.9 Colis et al.8 investigated pyridoquinazolinecarboxamides and their derivatives as RNA Pol I inhibitors. Recently, BMH-21 was also found to be a potent RNA Pol I inhibitor that could block the RNA Pol I holocomplex from binding to rDNA and thus inhibit RNA Pol I transcription activity.10 The same work10 successfully showed that BMH-21 competed with RNA Pol I for the GC region binding site of the human rDNA instead of contacting with the active site on the surface of RNA Pol I. Although these identified inhibitors can be used for effective targeted therapy against cancer, there is no clinically approved RNA Pol I inhibitor. More selective inhibitors are thus needed, which would benefit from cell-based screening platforms in drug discovery. Pertinent drawbacks need to be overcome in order to access robust screening systems for selective RNA Pol I inhibitors.
First, the structure-based discovery of small-molecule inhibitors of RNA Pol I has been stifled by their non-specificity due to their high structural similarities, especially within the highly conserved active site of all three RNA polymerases.11 The recent availability of the X-ray crystal structure of the yeast homolog of RNA Pol I makes the structure-based identification of RNA Pol I inhibitors possible. RNA Pol I of yeast (Saccharomyces cerevisiae) is a multi-subunit enzyme12 and its crystallized structure reveals 14 subunits.13,14 Prior investigations have validated four subunits, i.e., A49, A43, A34.5, and A14 as unique for RNA Pol I15 and A43 as a crucial subunit for RNA Pol I for transcribing rDNA.16 Meanwhile, the transcription factor protein RRN3 was discovered as a unique and functionally indispensable binding factor17 of RNA Pol I with a particular recognition for promoter sequences of yeast rDNA and the subsequent recruitment of RNA Pol I to form an initiation complex,18 such as an RRN3–A43 subunit complex.19 Moreover, direct data evidence has showed that the phosphorylation of a specific amino acid patch on the interface between RRN3 and RNA Pol I could destabilize binding between RRN3 and RNA Pol I and in turn inhibit RNA Pol I's transcription activity as well as cell growth.20 This offers an insight into the structural basis for molecular docking studies to identify inhibitors. We hypothesize that compounds that can destabilize the complex formed by the holoenzyme of Pol I and RRN3 could be potential selective inhibitors to RNA Pol I. Second, challenges exist in quantifying rRNA as the catalytic product of RNA Pol I. A major limitation for direct quantification is the susceptibility of rRNA to undergo degradation due to its short half-life of ∼20–30 min.21 To circumvent this problem, reporter systems have been used to assay the transcription activities of rDNA. For example, Ghoshal et al. (2004)22 developed an in vitro transcription assay of RNA Pol I with the firefly luciferase by introducing the luciferase reporter gene followed by an IRES-human rDNA sequence within the same DNA template vector. Another strategy involves using reverse transcription to obtain the cDNA of rRNA and then quantifying the resultant cDNA by subsequent qRT-PCR, which provides a normalized transcription level of rDNA. This strategy had been used previously, specifically employing the 45s rRNA.1 Third, the lack of a fully elucidated X-ray crystal structure of human RNA Pol I is a drawback to structure-based drug discovery efforts. However, sequence alignments done using several mammalian RNA Pol I subunits (cloned using their cDNAs) with their counterpart subunits from yeast RNA Pol I have indicated high homology.23 Furthermore, experiments also showed that four subunits were functionally interchangeable between humans and yeast,15 providing a basis to use the X-ray crystal structure of yeast and the yeast organism as a representative model system for specific RNA Pol I inhibitors.
Our goal in the present study was to build a reliable model aimed at screening selective inhibitors for RNA Pol I. In this report, yeast (Saccharomyces cerevisiae) was used as a model system to investigate rDNA transcription because of its ease of processing24 and the conservation of protein functions between yeast and other eukaryotes, similar to those seen in humans.24–26 Therefore, we built a model combining yeast RNA Pol I and human ribosomal DNA (rDNA) with its promoter. These sequences were cut out and inserted in a yeast integrative plasmid to generate a stable yeast cell line after selection for high-throughput screening. Further, molecular docking studies and biological studies led to the identification of a candidate inhibitor of RNA Pol I.
Results and discussion
Cellular model system to study RNA Pol I transcription
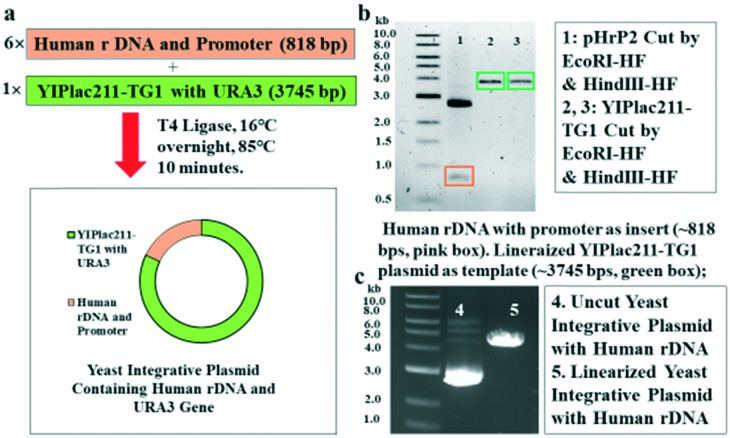
Performing cell-based assays to identify drug candidates is an attractive endeavor as it overcomes certain barriers, such as impermeability, toxicity, and decomposition. Thus, we considered building a cellular model to study the transcription of human rDNA by yeast RNA Pol I. We used the yeast integrative plasmid YIPlac211-TG1 as a vector for efficient integration into the genome of the yeast host. Briefly, pHrP2, which is the human RNA Pol I promoter, and rDNA were inserted into the YIPlac211-TG1 vector (Fig. 1a). Restriction endonuclease reactions revealed the presence of linearized YIPlac211-TG1 plasmid as a template and as an insert composed of human rDNA and its promoter from the pHrP2 plasmid (Fig. 2b and c) by gel electrophoresis. The new plasmid was subsequently confirmed by sequencing.
Fig. 1. Construction of yeast integrative plasmid containing human rDNA plus the promoter. a) General process of cutting out human rDNA plus the promoter as an insert and linearizing the template plasmid of the yeast integrative plasmid YIPlac211-TG1 that contains the same sticky ends as the insert as well as connecting these two parts into a new intact plasmid of YIPlac211-TG1-HmrDNA. b) Agarose gel electrophoresis of the linearized YIPlac211-TG1 plasmid as a template and human rDNA with the promoter as an insert. Band 1 in the pink box is human rDNA plus the promoter that was cut out from the pHrP2 plasmid. This insert sequence had the expected size of ∼818 base pairs. Band 2 and band 3 in the green boxes are the linearized YIPlac211-TG1 plasmids with the expected size of ∼3745 base pairs. c) Comparison between wild type and linearized reconstructive plasmid built after inserting human rDNA with the promoter into the yeast integrative plasmid of YIPlac211-TG1.
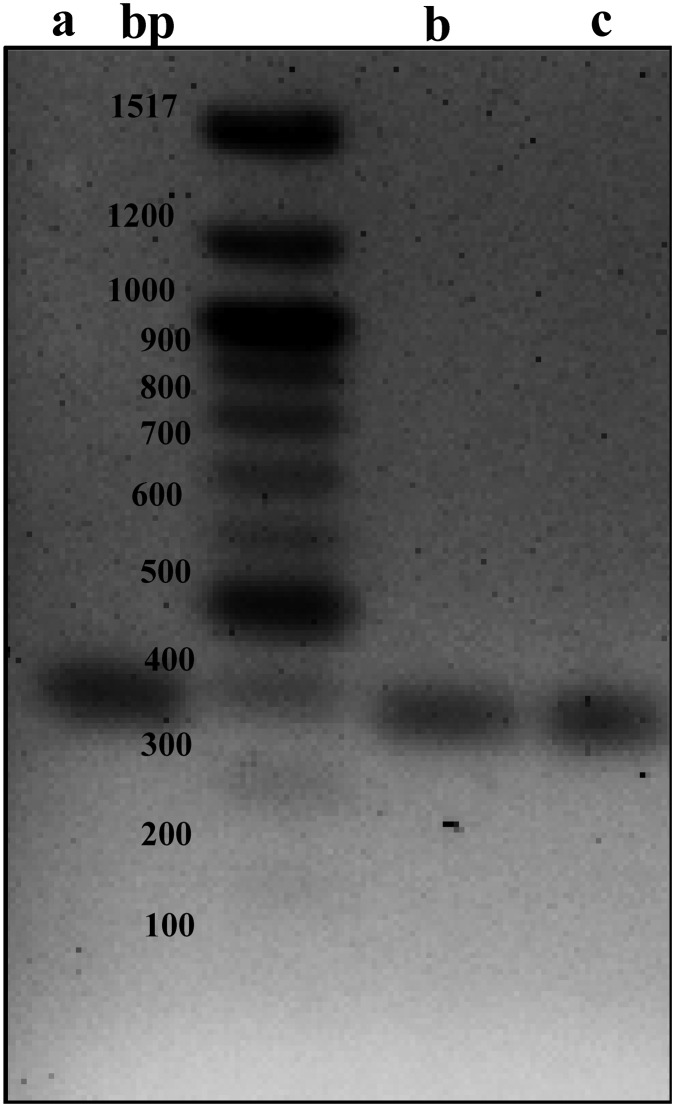
Fig. 2. Gel electrophoresis of PCR amplifying cDNA from the reverse transcription reaction of total RNA extract from the yeast transformant YBR140C-HmrDNA. The size of the target amplicon was 387 bps. a) Amplicon of the reference plasmid of pHrP2 as the source of human rDNA plus the promoter's sequence for the yeast transformant. b and c) Amplicons of cDNA from the transcription activity of yeast cells from the strain YBR140C-HmrDNA, of which the cells contained human rDNA plus the promoter. We performed >3 independent in vitro transcription assays.
Initial considerations to use the reporter gene of firefly luciferase in the plasmid construction were explored to facilitate a rapid quantification of the transcription activity of yeast RNA Pol I in a high-throughput activity assay. However, direct release of the reporter luciferase from yeast cells proved problematic due to the thick cell wall of the yeast, which requires lytic enzymes to disintegrate. This process might risk the degradation of the expressed luciferase.
To generate stable yeast cells, we utilized YBR140C, which harbors the URA3 mutation and can be used as uracil auxotroph for selection. We carried out the transformation of the YBR140C yeast cells with the integrative plasmid bearing the human RNA Pol I promoter and an rDNA sequence. Additionally, the plasmid carries a URA3 gene to facilitate the selection of successfully transformed cells. Furthermore, we confirmed the integration of the rDNA sequence into the yeast genome by extracting the total genomic DNA for sequencing. This was further corroborated by PCR amplification using primers of human rDNA, and then subjected to gel electrophoresis.
In vitro transcription assay
Cell-based transcription assays are valuable models for the identification of selective RNA Pol I inhibitors. To this end, we envisioned the possibility of the yeast RNA Pol I to be recruited to the promoter region of human rDNA to initiate the transcription program. This concept was tested by growing yeast under optimal conditions and the total RNA was extracted. The RNA was treated with DNase to eliminate chromosomal DNA from the transformed yeast (YBR140C-HmrDNA), which could otherwise contaminate the generated cDNA. After the reverse-transcription of the total RNA, the resultant cDNA was analyzed by PCR using primers that can amplify a certain sequence of human rDNA and was then visualized by gel electrophoresis (Fig. 2). Using DNA sequencing and subsequent sequence alignment with the published sequence of human rDNA, the transcription of human rDNA was confirmed. These results indicate that yeast RNA Pol I could be recruited to the promoter region of human rDNA to form the transcription initiation complex as well as the elongation complex, leading to the transcription of human rDNA.
Virtual screening for the ligands of RNA Pol I
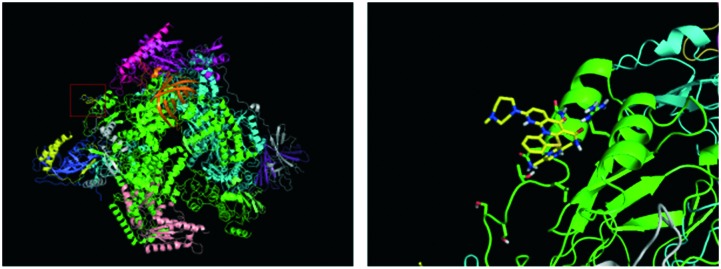
With a well-validated model system in hand, we sought to identify novel small molecules as selective RNA Pol I inhibitors by structure-based drug discovery. The first step was to identify distinct structural features for RNA Pol I selectivity. Given the exclusive interaction of the transcription factor protein RRN3 with RNA Pol I, we reasoned that the disruption of that interaction could achieve selective targeting. Thus, we selected a domain within RNA Pol I that complexes with RRN3 for molecular docking studies. Computational tools used were AutoDock 4.227 and Surflex docking suite of SYBYL-X.28,29 The NCATS small-molecule library of ∼700 FDA approved compounds was used for the virtual screening.30 Initial screening identified high-ranking hits, including the well-established RNA Pol I inhibitor CX-5461. The interaction of key amino acid residues and the small-molecules showed that CX-5461 binds with the protomol on the interface between RNA Pol I and RRN3 tightly, with the lowest binding free energy of –5.77 kcal mol–1. The structure corresponding to such a binding constant is depicted in Fig. 3.
Fig. 3. Interaction between CX-5461 with the surficial amino acids that had direct contact with RRN3 transcription factor using AutoDock 4.2.
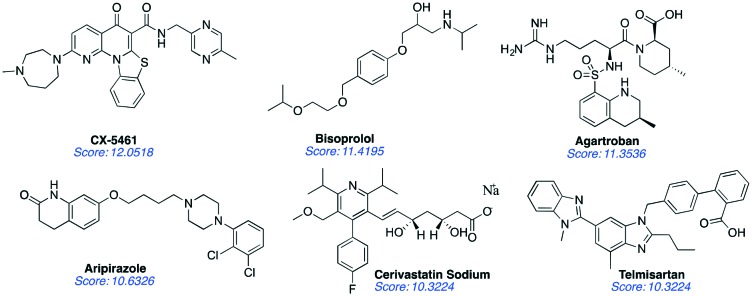
We carried out molecular docking screens using SYBYL-X to confirm our initial screens with AutoDock. These two computational softwares are very well validated and widely used in the drug-discovery community. In addition, they are user-friendly with visualized docking operations to illustrate the ligand–protomol interactions easily. AutoDock provides a faster evaluation, whereas SYBYL-X offers higher precision based on its algorithm. The protomol for docking by SYBYL-X is a curved surface that could complement with the grid box offered by AutoDock. The ligands selected by SYBYL were ranked by consensus score in the form of ‘–Log [Affinity]’, which ranks the affinity of diverse ligands to the site of interest that is part of the macrobiomolecules. The higher score posed by a ligand is indicative of a better fit that binds more tightly with the selected protomol as the site of interaction, largely via hydrogen bonds. Ligands with a docking score of >10 were selected for further studies because such a scale is comparable to the score of CX-5461 (with a total score of 12.0518, as we calculated using SYBYL-X) and has been verified as a good inhibitor to RNA Pol I. These compounds included CX-5461 with a total score of 12.0518, bisoprolol with a total score of 11.4195, agatroban with a total score of 11.3536, aripirazole with a score of 10.6326, cerivastatin sodium with a score of 10.3224, and telmisartan with a score of 10.3224 as depicted in Fig. 4. Although CX-5461 has already been verified as a strong and selective RNA Pol I inhibitor in prior research, studies suggesting it as a potential disruptor are lacking. We were encouraged by the fact that CX-5461 showed a high score, which supported our virtual screening strategy as a compelling approach to access new RNA Pol I inhibitors with potentially new mechanisms. Biological evaluation, including dose-responsive transcription inhibition and growth inhibition, are required to classify these identified compounds as actual “hits” for designing anticancer drugs.
Fig. 4. Top six hits from the virtual screening studies using the NCATS small-molecule library with the yeast RNA Pol I crystal structure.
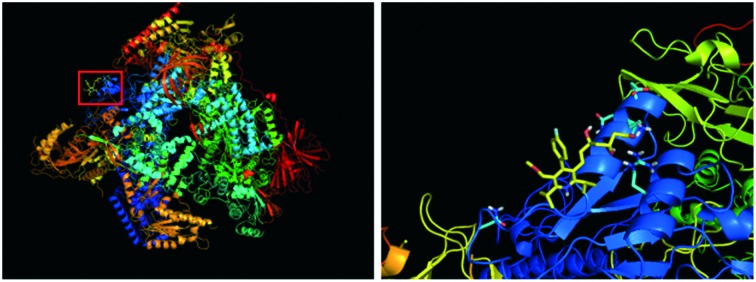
Furthermore, comparisons between the virtual screening results showed that the data of CX-5461 from SYBYL-X, with a docking score of 12.0518 and the binding constant of –5.77 kcal mol–1, obtained from AutoDock were consistent, suggesting that the compound could tightly bind with the protomol on the RNA Pol I enzyme in contact with RRN3. The docking study result was consistent with the experimentally observed result from prior publications, which showed that CX-5461 was a strong inhibitor of RNA Pol I.7 Additionally, we observed that the highly potent small-molecule cerivastatin sodium, which had a total SYBYL score of 10.3224, also showed a calculated binding constant of –2.62 kcal mol–1 using AutoDock 1.5.6 (Fig. 5, S11 and S12†). Given the consistency as observed in the case of CX-5461 and the interaction with similar amino acid residues, we selected cerivastatin sodium for biological evaluation using yeast cellular transcription assays of RNA Pol I.
Fig. 5. Interaction between cerivastatin sodium at the interface of RNA Pol I with RRN3. The images were exported from the results of virtual screening done by AutoDock 4.2. The lowest binding energy of cerivastatin sodium with the surficial region of subunit RPA43 and RPA190 that interact with RRN3 was calculated to be –2.62 kcal mol–1.
Dose responses of yeast growth to the ligand compounds
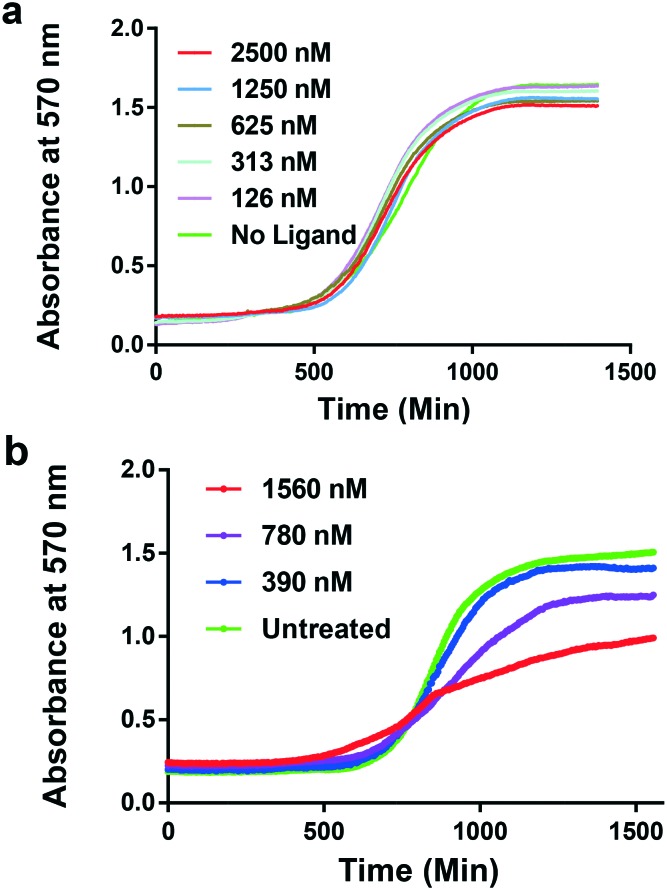
To assess the inhibitory effect of selected compounds on yeast growth, we examined the growth inhibition of the compounds in yeast to establish the dose needed for the cell-based transcription inhibition experiments in the transformed YBR140C-HmrDNA cells. The dose–response tests showed that cerivastatin sodium was a potent inhibitor of YBR140C-HmrDNA cells in the nanomolar range (Fig. 6). Remarkably, a stronger suppression of yeast growth was observed when the yeast cells were incubated with cerivastatin sodium compared to known anticancer drugs or transcription inhibitors.31,32 Importantly, the extraction of growth variables, including the IC50, at various time points in the presence or absence of cytotoxic agents was performed, as displayed in Fig. 6. This experiment enabled the direct extraction of the impact of these agents on the growth lag, growth rate or growth efficiency of S. cerevisiae. We used drug concentrations that impacted the growth efficiency (i.e., ΔOD) but that did not cause a reduction in OD to less than 0.5 a.u., which was in the range of 126–2500 nM for CX-5461 or cerivastatin sodium. As seen in Fig. 6a, the growth efficiency impacted by CX-5461 was ∼3–4-fold lower than that of cerivastatin in Fig. 6b and the highest concentration required for cerivastatin to achieve that was half the concentration of CX-5461. It is possible that cerivastatin is capable of crossing the cell wall of yeast more efficiently than CX5461. A number of chemogenetic fingerprinting analyses using yeast as a model organism have applied a similar analysis of growth dynamics.33,34 Similarly, the results for the dose–response tests of yeast growth with treatment by other compounds identified by the virtual screening are depicted in the ESI† (Fig. S1–S5). In addition to the selected candidates from our virtual screening, we tested the broad-spectrum polymerase inhibitor actinomycin D (Fig. S1†). We found that much higher doses of 4–7-fold of actinomycin D were needed to induce changes in the growth efficiency observed for CX-5461 or cerivastatin sodium. Taken together, the cellular growth effects of the candidate inhibitors of RNA Pol I were examined in yeast and the data established a differential sensitivity to cytotoxic agents.
Fig. 6. Growth test of yeast YBR140C-HmrDNA in response to the dose-dependent treatment of: (a) CX-5461 and (b) cerivastatin sodium. Similar results were obtained from three independent experiments.
In vitro cytotoxicity of CX-5461 and cerivastatin sodium
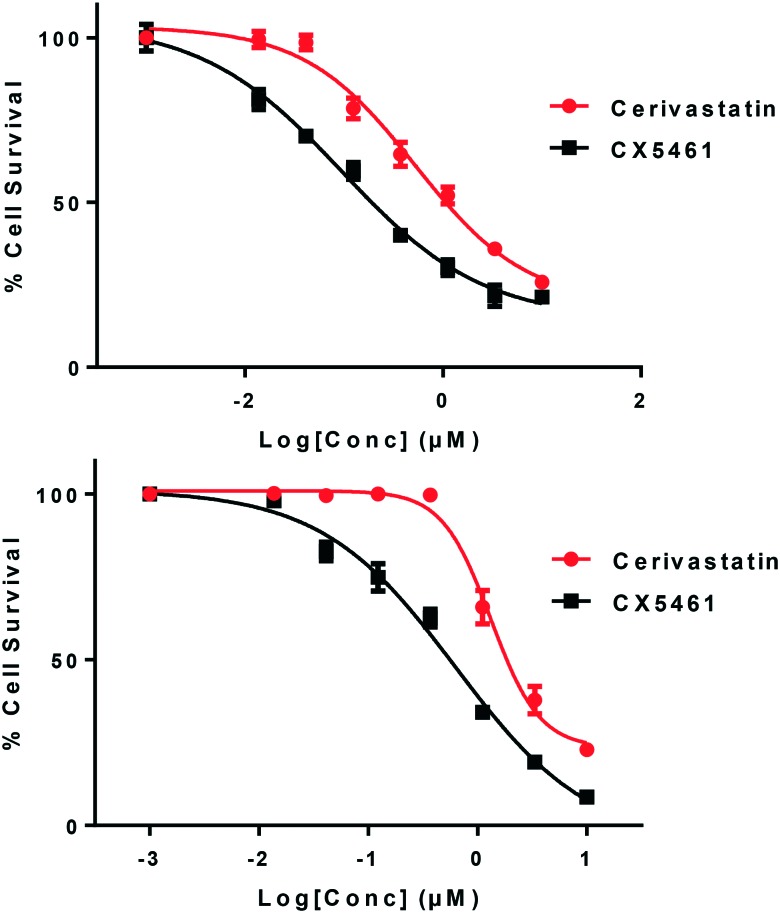
To investigate the applicability of the identified probe in mammalian cell biology, we evaluated the antiproliferative potential of cerivastatin in two human cancer cell lines, namely, A278 (ovarian) and H460 (lung), alongside that of CX-5461 using the MTT assay (Fig. 7). Briefly, cells were seeded in a 96 well-plate and allowed to adhere overnight in an incubator at 37 °C. The cells were exposed to the compounds, which were serially diluted from a starting concentration of 10 μM to 7-concentration points. The MTT assay was performed after 4 days. In A2780 cells, the IC50 for cerivastatin was 0.7 μM and that of CX-5461 was 0.12 μM. Of note, the IC50 extrapolated from the dose–response curves of cerivastatin H460 cells was 3.5 μM, which makes it ∼15 times less potent than that of CX-5461. Albeit, the antiproliferative activity was promising and further optimization may improve the cellular activity.
Fig. 7. A2780 (top) and H460 (bottom) cancer cells were treated with various doses of CX-5461 and cerivastatin for 96 h and the resulting effects on cell viability were measured by MTT assay. Values are normalized to untreated, with error bars representing the standard deviations among three replicates.
Quantifying the transcription activity of yeast Pol I by RT-PCR in the presence of ligands
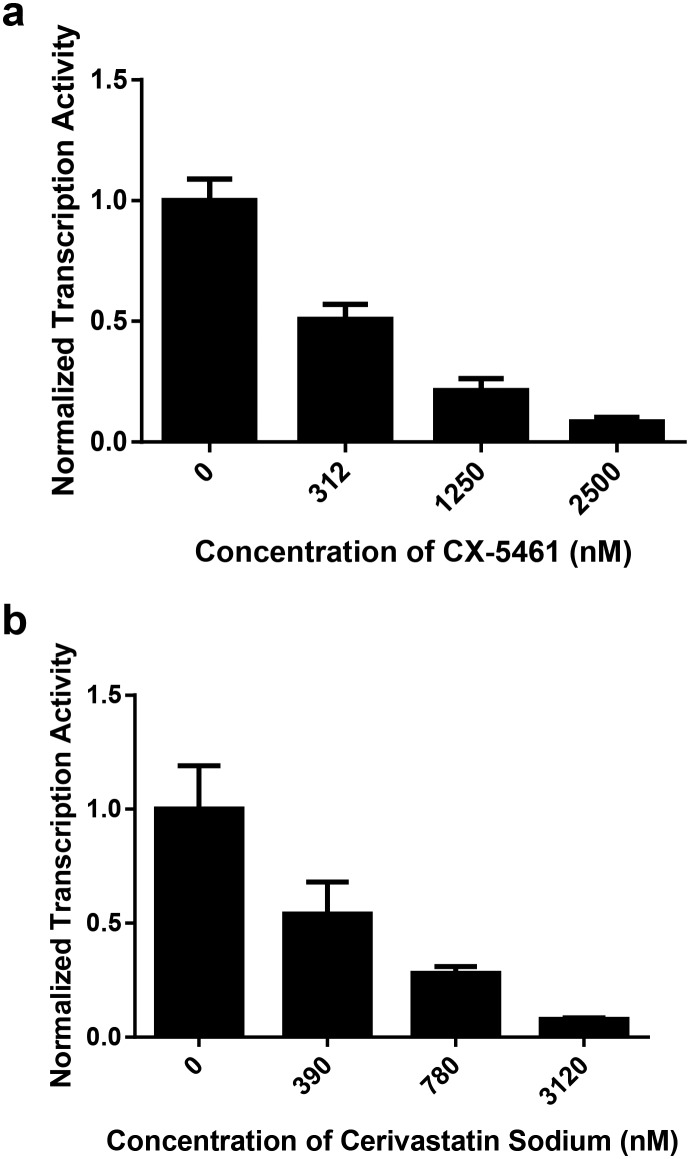
Cell-based transcription inhibition was used to ascertain the selectivity of the selected compounds for RNA Pol I (Fig. 8). We used qRT-PCR to measure the human rDNA transcripts from YBR140C-HmrDNA cells in the presence or absence of the ligands. In the dose-dependent inhibition test of small compounds using qRT-PCR, an alternate algorithm described by Livak and Schmittgen (2001)35 was used to derive the target human rDNA's transcription levels, which were expressed in 2–ΔΔCT. CT values for the housekeeping gene MEP2 or for the target human rDNA were recorded in triplicate for all three parallel trials that amplified either target human rDNA or the internal control gene of MEP2 for yeast cells incubated with particular concentrations of a ligand or without the ligand. The differences between the CT values of human rDNA and the MEP2 gene were calculated and recorded as ΔCT (HmrDNA – MEP2). Their average values were calculated and recorded as ΔCT[Avg, CT(HmrDNA) – CT(MEP2)] with standard deviations. Each ΔCT [Avg, CT(HmrDNA) – CT(MEP2)] value calculated at each concentration of the ligand was subtracted by its counterpart ΔCT[Avg, CT(HmrDNA) – CT(MEP2)] value measured in the reactions without the ligand. The results were recorded as ΔΔCT [Avg, ΔCT(with ligand) – Avg, ΔCT(no ligand)] plus standard deviations. Owing to the duplication of DNA during amplification, all of these CT, ΔCT, and ΔΔCT values were in logarithm base 2 and describe the number of the amplification cycles of DNA. Relative differences in the duplication folds required for specific cDNA to reach the threshold of detection that are in a reverse proportion to the concentrations of cDNA could thus be calculated using the expression 2–ΔΔCT[Avg,ΔCT(with ligand) – Avg,ΔCT(no ligand)]. A dose-dependent modulation of human rDNA transcripts was observed for both CX-5461 and cerivastatin sodium. Interestingly, cerivastatin sodium inhibited human rDNA transcription in the nanomolar range, which was comparable to CX-5461. Based on the computational studies that led to the identification of cerivastatin sodium as a potential candidate inhibitor, disruption of the interaction between RNA Pol I and RRN3 may likely be a viable strategy for selective targeting. Additionally, the mechanism for the selective inhibition of CX-5461 may be the inhibition of the protein–protein interactions of RNA Pol I and RRN3. Further mechanistic studies would be beneficial in this area.
Fig. 8. Normalized transcription activity of human rDNA in yeast YBR140C-HmrDNA in response to the dose-dependent treatment of CX-5461 (a) or cerivastatin sodium (b) by qRT-PCR. Values are normalized to untreated, with error bars representing the standard deviations among three replicates. Similar results were obtained from three independent experiments. p-Value used was p < 0.05.
Conclusion
An assay for quantifying the transcriptional activity of RNA polymerase I was developed. It was successfully verified that yeast RNA Pol I could transcribe the incorporated human rDNA. This observation implied that a transcription complex had formed by the transcription factors of the transformed yeast cells. It is possible that yeast RNA Pol I was recruited to the human promoter sequence that had been incorporated into the yeast cells. More studies are needed to further establish this recruitment. Furthermore, a new candidate small molecule was identified using virtual screening of a relatively small library as a selective RNA Pol I inhibitor. Importantly, the model system was verified using the first-in-class RNA Pol I inhibitor, CX-5461. Given the toxicity associated with cerivastatin sodium, chemical derivatives that do not compromise targeting to RNA Pol I will be essential. This study forms the basis to expand the rational structure-based design and development of selective RNA Pol I inhibitors. Preliminary studies demonstrated the antiproliferative effects of cerivastatin sodium against human cancer cells, namely, A2780 and H460 cell lines. Future studies to explore the specific targeting of cerivastatin sodium in human cancer cells with aberrant RNA Pol I expression will be actively investigated.
Materials and methods
Cells
The source of RNA Pol I was the yeast strain YBR140C. It was from the lab of Prof. Brian B. Rymond as a generous gift. This strain is uracil deficient so that cells from this strain cannot grow on a medium without uracil. YPD medium was made to grow cells or the strain of YBR140C. Briefly, 10 g of yeast extract and 20 g of peptone were dissolved in 700 mL of DI water. Then, 20 mg of d-glusose was dissolved in 100 mL of DI water. The two liquids were sterilized using an autoclave at 122 °C and 22 psi and were mixed together after they cooled down. The ultimate volume of the medium was brought up to 1.0 L using sterilized DI water. Finally, 100 mg of ampicillin was added to the medium.
Plasmid construction
Human rDNA sequence (plus the promoter) was cut out from the plasmid of pHrP2 (Fig. S6a†), (as a gift from Prof. Marikko Laiho). The vector plasmid was YIPlac211-TG1, which is a yeast integrative plasmid (Fig. S6b†). Both plasmids were incubated in 10 μL of 1 × NEB CutSmart Buffer with two restriction endonucleases EcoRI-HF and Hind III-HF at a dose of 10 U μL–1 at 37 °C for 12 h to cut the plasmid at the corresponding loci and at 65 °C for 1 h to denature the enzyme. The resulting DNA segments from both reactions were separated on a 0.7% agarose gel suffused in 1 × TAE buffer with ethidium bromide using BioRad electrophoresis gel apparatus with an electric field strength of 5 volts per cm, as depicted in Fig. 2. The bands on the agarose gel corresponding to the human rDNA plus the promoter insert (818 bp) and the vector template from YIPlac211-TG1 (3745 bp) were cut out under UV light in darkness. Both the sequence of the insert and the vector were recorded in the ESI† in Fig. S7 and S8. These two DNA segments were isolated and cleaned using a Monarch DNA Gel Extraction Kit (New England Biolabs Inc). The insert and the template were ligated using T4 DNA ligase (New England Biolab). In the ligation reaction, the molar ratio of these two segments was insert: template ≈ 6 : 1. The mixture was first incubated at 16 °C for 36 h for their sticky ends to anneal as well as to form 3′,5′-phosphodiester bonds to ultimately form a nascent yeast integrative plasmid containing human rDNA plus the promoter. This plasmid was named as YIPlac211-TG1-HmrDNA. Another round of incubation was done at 65 °C for 30 min to inactivate the ligase.
This new plasmid was used to transform the chemically competent E. coli 10β cells from NEB in order to amplify the new recombined plasmid of YIPlac211-TG1-HmrDNA. Here, 50 μL of the competent cells were thawed on ice and mixed with 1 μL of the reaction mixture containing the recombined plasmid by pipetting. The whole mixture was heat-shocked at 42 °C for 30 s and placed on ice for 5 min to facilitate the entrance of recombined plasmid into the cells. The treated cells were supplied with 950 μL of liquid SOC medium at room temperature and incubated at 37 °C for 60 min with constant shaking at 240 rpm. Next, 100 μL of the liquid SOC medium was transferred on to the solid agar LB medium plate with 100 mg L–1 of ampicillin (Alfa Aesar) and incubated at 37 °C overnight. The transformed competent cells in the colonies on the solid plate were amplified in liquid YPD medium at 37 °C. Recombined plasmid of YIPlac211-TG1-HmrDNA was extracted and purified using an E. Z. N. A. Plasmid DNA Maxi Kit from Omega Bio Tech (Catalog #: D6922-00).
Yeast cell transformation and stable cell lines
A middle to late log culture of yeasts from the strain YBR140C that had an OD600 between 2 and 4 was centrifuged to remove the liquid YPD medium. The resulting cell pellet was washed once with sterile DI water and twice with 100 mM of LiAc-TE-EDTA buffer. The resultant yeast cells were finally re-suspended in 2 mL of 100 mM LiAc-TE-EDTA buffer. Aliquots of 500 μL of the suspended cells were added in 2 mL microcentrifuge tubes. A 50 μL aliquot of 5 mg mL–1 salmon sperm DNA (heat denatured at 100 °C for 10 min) and the plasmid DNA (1 to 3 μg in ≤10 μL) were successively added into and mixed well with the suspended yeast cells. The reaction mixture was incubated at room temperature for 5 min and 25 μL of DMSO was added and briefly mixed. After incubation at room temperature for 30 min, the reaction mixture was gently mixed with 2.0 mL of 40% (v : v) PEG 3350 in 100 mM LiAc-TE-EDTA buffer. The reaction mixture was then incubated in a water bath at 30 °C for 30 min and heat-shocked at 42 °C for 20 min. The yeast cells were spun out and added to 2 mL of YPD broth. The culture was then incubated at 30 °C with shaking at 250 rpm for 1 h. This outgrowth step was necessary to have a sufficient amount of colonies and should always be done. (If this step is not carried out, there is the risk of not forming colonies.) The yeast cells were spun out, washed once with 1 mL of sterile DI water, and spun out again. 1 mL of sterile DI water was added to re-suspend the yeast pellet. All the transformation mixture was plated on the uracil-deficient agar medium plate to grow the colonies. DNA extractions of the cells of these growing yeast colonies were sequenced and aligned with the known sequence of human rDNA to validate the expected transformed cells.
Growth inhibition assay
We used a reported protocol with few modifications.36 Individual deletion strains arrayed on YPD/agar were inoculated into 100 μL of liquid YPD using an 8-head pin tool. Cultures were grown to saturation overnight at 30 °C and then stored at 4 °C for 4 h. The yeast cells were then re-suspended by shaking for 15 min and each yeast culture concentration was normalized by diluting to a final OD600 of around 0.02 in a UV fused quartz CV10Q1400S cuvette (Thorlab, Newton, NJ) using a Shimadzu UV-1280 Spectrophotometer (Beckman Coulter. Inc. Altanta, GA). Normalized cultures were grown in 100 μl volumes in 96-well plates in a Tecan GENios microplate reader (MTX Lab Systems, LLC, Bradenton, FL) for 24 h. The growth rate of each culture was monitored by measuring the OD570 every 5 min. Each ligand compound was tested in the growth assays using not only the yeast cells from the strain of the YBR140C transformant with human rDNA but also the yeast cells from the wild type strain of YBR140C that was not transformed. The dose responses of YBR140C-HmrDNA cell growth were tested against CX-5461 at concentrations of 156, 312, 625, 1250, and 2500 nM; against actinomycin D with concentrations of 0.625, 1.25, 2.5, 5.0, and 10.0 μM; against acebutolol hydrochloride at concentrations of 1.56, 3.13, 6.25, 12.5, 25.0, and 50.0 μM; against cerivastatin sodium with concentrations of 390, 780, and 1560; against agartroban with concentrations of 1250 and 2500 nM; against aripirazole with concentrations of 780, 1560, 3120, and 6240 nM; and against bisoprolol with concentrations of 156, 312, 625, 1250, and 2500 nM. The resultant diagrams were plotted using the values of CD570versus the time in minutes.
RNA extraction and reverse transcription-PCR
Individual aliquots of yeast transformed cells from the strain of YBR140C-HmrDNA were cultured and appropriately treated as described in the growth inhibition section. The yeast cells were pelleted by centrifugation and the pellet was suspended in 100 μL of yeast suspension buffer from the yeast total protein extraction kit (GE Health Care) with 10 μL of lifelong Zymolyase solution to lyse the cell walls. The yeast cells were incubated at 37 °C for 1 h until most of them became spheroplasts, which are defined as microbes' cells that have had the majority of their cell wall removed and that are visibly spherical under a microscope.37,38 The total RNA samples of the yeast spheroplasts were extracted using the E. Z. N. A. total RNA Kit (OMEGA Bio-Tek). The operation followed the manufacturer's general protocol, except that the spheroplasts were lysed by incubation with 350 μL of GTC lysis buffer (MEGA Bio-Tek) at 4 °C for about 3 h without a vortex with glass beads. The total RNA extract samples were denatured using formamide using the following protocol by Masek et al.39 The cDNA of the yeast total RNA was made following the modified typical cDNA synthesis protocol of warm smart RT×Reverse Transcriptase from New England Biolab Inc (Ipswich, MA). Appropriate amounts of RNA extract sample of yeast were incubated with a dNTP mixture at a final concentration of 0.5 mM, warm smart RT×Reverse Transcriptase at a final concentration of 7.5 Unit per mL, Random Primer 6 mixture at a final concentration of 6 μM, with 1 × isothermal amplification buffer in each reaction mixture to a final volume of 20 μL. After mixing by vortexing, all of the reaction mixtures were incubated for 20 min at 25 °C for annealing and for 60 min at 55 °C for synthesis. The reactions were quenched by incubation at 80 °C for 10 min in order to inactivate warm start RT×Reverse Transcriptase. The general protocol for running qRT-PCR was derived from the protocol published by Wang et al. (2003).40 The optimal adhesive covers were from Life Technologies Holdings Pte Ltd, Singapore. The MicroAmp Optical 96-well Reaction Plates were from Life Technologies Corporation. The PowerUp SYBR Green Master Mix (universal 2× master mix for real-time PCR workflows) was from Thermo Fisher Scientific. The forward and reverse primers for the housekeeping genes-MEP2 and PDC1 were both from IDT. The primer mixture targeting the ampicon of yeast rDNA was from IDT. The housekeeping gene that was selected to run qRT-PCR was MEP2, the gene encoding an ammonium permease.41 Here, the MEP2 gene encodes an ammonium permease with higher affinity than the counterpart ammonium permeases encoded by MEP1 and MEP3 and is necessary for yeast metabolism.42 Transcription activities of this enzyme encoding gene were used as a reference to normalize the transcription activities of the target gene, which was human rDNA plus the promoter. The primers for partially amplifying human rDNA within the transformed yeast YBR14C-HmrDNA were the forward primer: 5′-GGGCCTGCTGTTCTCTCG-3′ and the reverse primer: 5′-GAGAACGCCTGACACGCA-3′. The size of the corresponding amplicon was 197 base pairs with the following sequence in the direction of 5′ to 3′: GGGCCTGCTGTTCTCTCGCGCGTCCGAGCGTCCCGACTCCCGGTGCCGGCCCGGGTCCGGGTCTCTGACCCACCCGGGGGGCGGCGGGGAAGGCGGCGAGGGCCACCGTGCCCCCGTGCGCTCTCCGCTGCGGGCGCCCGGGGCGGCCGCGACAACCCCACCCCGCTGGCTCCGTGCCGTGCGTGTCAGGCGTTCTC. The housekeeping gene that was selected for the RT-PCR was the MEP2 gene with the forward primer: 5′- CTGGACATGGTGGTCTAGTT-3′ and the reverse primer: 5′-GAGGTGACGGAATGTGGT-3′. These two primers were used to amplify a part of the MEP2 gene sequence that could yield amplicons of 100 base pairs with the following sequence of CTGGACATGGTGGTCTAGTTTACGCTTTGATACTGGGTAAGCGTAATGACCCTGTTACACGTAAAGGGATGCCCAAGTACAAACCACATTCCGTCACCTC.
Samples without template cDNA as the non-template controls (NTC) were set up with the same dose of SYBR Green master mix with identical final volumes as the samples with cDNA templates.
Virtual screening
The yeast RNA Polymerase I crystal structure (PDB access number: 5g5l) solved by Engel et al. (2016)13 was downloaded from the Protein Data Bank. The file of coordinates for the enzyme structure was obtained using GEDIT by removing the coordinates of the RRN3 factor. Using this model, amino acid residues on the surface of A43 subunit within a 2 Å distance from the surface of RRN3 in the holozyme complex were selected and highlighted. A new Mol2 file was created with the amino acid residues belonging to RRN3 removed using the AutoDock PMV-1.5.6 program. This new PDB file was converted into a mol2 file using the Open Babel GUI program.43 This mol2 file of yeast RNA Pol I was input in the SYBYL-X program.28,29 The biomolecule receptor as yeast RNA Pol I was initialized by fixing the terminal amino acid residues, removing free water molecules, protonating the biomolecule receptor's atoms and building the hydrogen bonding network, assigning Gasteiger charges to the amino acid residues, and minimizing the total energy. The multi-channel docking protomol on the structure of yeast Pol I ; 5g5l with RRN3 removed was generated.
Using AutoDock 4.2 and MGLTools 1.5.6,27 a region for constructing docking protomol was selected to include and highlight all of the amino acid residues belonging to the interface between RNA Pol I and RRN3: PHE138, Ile139, SER141, ALA142, SER143, HIS144, LEU148, ASN154, SER156, LYS158, VAL242, ARG1119, ILE1120, GLY1121. The docking region was confined within a box with grid center coordinates as x = 144.335, y = 149.293, and z = 99.2 angstroms with the number of grid points as 126 in x, 40 in y, and 126 in z with an interspace of 0.200 angstroms. Multi-channel docking protomols on the structure of yeast Pol I 5g5l were generated and a docking protomol was selected to include the same amino acid residues as included by the box-shaped docking region in the protomol generated by AutoDock 4.2. Virtual structures of 500 compounds from the NCATS small-molecule library were converted into Mol2 format for screening.30 The docking protomol used for SYBYL-X is depicted in Fig. S9.† Such a protomol included the surficial regions of the crucial yeast Pol I subunits in rDNA transcription, such as RPA43 and RPA190. The compounds were screened with the scores as the negative log values reported. The compounds with the top 6 scores in the first round of screening and the top 5 scores in the second round of screening were supposed to be used to run the yeast cellular assays to study their dose-dependent effects on the growth. The negative log values observed for the binding constants using AutoDock indicated strong interactions between the A43 subunit surface, which would lead to the disruption of the RNA Pol I-RRN3 complex.
Cell lines and cell culture conditions
The ovarian cancer cells (A2780) and the lung cancer cells (H460) were maintained in the Roswell Park Memorial Institute (RPMI) 1640 medium. With the exception of H460, which was supplemented with 15% heat-inactivated fetal bovine serum (FBS) and 10% glutamine, A2780 were cultured in RPMI supplemented with 10% FBS and 1% penicillin/streptomycin. All the cells were grown at 310 K in a humidified atmosphere containing 5% CO2.
Cell viability assay
Cells (2 × 10³) were plated on 96-well plates and treated the next day with a dose response of drugs for 96 h. Cell viability was determined using MTT assays.
Conflicts of interest
The authors declare no competing financial interest.
Supplementary Material
Acknowledgments
We appreciate the generous gift of plasmid YIP-lac211-TG1 and yeast strain of YBR140C from the lab of Brian C. Rymond and for helpful experimental guidance. We thank Michael Mendenhall for helpful discussions. We thank the NCATS program for the small molecule library. We are grateful to the University of Kentucky for start-up funding.
Footnotes
†Electronic supplementary information (ESI) available: Growth inhibition, plasmid maps and characterization. See DOI: 10.1039/c9md00227h
References
- Drygin D., Lin A., Bliesath J., Ho C. B., O'Brien S. E., Proffitt C., Omori M., Haddach M., Schwaebe M. K., Siddiqui-Jain A., Streiner N., Quin J. E., Sanij E., Bywater M. J., Hannan R. D., Ryckman D., Anderes K., Rice W. G. Cancer Res. 2011;71:1418–1430. doi: 10.1158/0008-5472.CAN-10-1728. [DOI] [PubMed] [Google Scholar]
- Kulkens T., Riggs D. L., Heck J. D., Planta R. J., Nomura M. Nucleic Acids Res. 1991;19:5363–5370. doi: 10.1093/nar/19.19.5363. [DOI] [PMC free article] [PubMed] [Google Scholar]
- Nomura M., Nogi Y., Yano R., Oakes M., Keys D. A., Dodd L. V. A. Nature. 1969;224:234–237. [Google Scholar]
- Hadjiolov A. A., The Nucleolus and Ribosome Biogenesis, Cell Biology Monographs, Springer-Verlag, New York, 1985. [Google Scholar]
- Whitesell L., Lindquist S. Expert Opin. Ther. Targets. 2009;13:469–478. doi: 10.1517/14728220902832697. [DOI] [PubMed] [Google Scholar]
- Liebhaber S. A., Wolf S., Schlessinger D. Cell. 1978;13:121–127. doi: 10.1016/0092-8674(78)90143-5. [DOI] [PubMed] [Google Scholar]
- Bywater M. J., Poortinga C., Sanij E., Hein N., Peck A., Cullinane C., Wall M., Cluse L., Drygin D., Anderes K., Huser N., Proffitt C., Bliesath J., Haddach M., Schwaebe M. K., Ryckman D. M., Rice W. G., Schmitt C., Hannan R. D. Cancer Cell. 2012;22:51–65. doi: 10.1016/j.ccr.2012.05.019. [DOI] [PMC free article] [PubMed] [Google Scholar]
- Colis L., Ernst G., Sanders S., Liu H., Sirajuddin P., Peltonen K., DePasquale M., Barrow J. C., Laiho M. J. Med. Chem. 2014;57:4950–4961. doi: 10.1021/jm5004842. [DOI] [PMC free article] [PubMed] [Google Scholar]
- Andrews W. J., Panova T., Normand C., Gadal O., Tikhonova I. G., Panov K. I. J. Biol. Chem. 2013;288:4567–4582. doi: 10.1074/jbc.M112.411611. [DOI] [PMC free article] [PubMed] [Google Scholar]
- Peltonen K., Colis L., Liu H., Trivedi R., Moubarek M. S., Moore H. M., Bai B., Rudek M. A., Bieberich C. J., Laiho M. Cancer Cell. 2014;25:77–90. doi: 10.1016/j.ccr.2013.12.009. [DOI] [PMC free article] [PubMed] [Google Scholar]
- Cramer P., Armache K. J., Baumli S., Benkert S., Brueckner F., Buchen C., Damsma G. E., Dengl S., Geiger S. R., Jasiak A. J., Jawhari A., Jennebach S., Kamenski T., Kettenberger H., Kuhn C. D., Lehmann E., Leike K., Sydow J. F., Vannini A. Annu. Rev. Biophys. 2008;37:337–352. doi: 10.1146/annurev.biophys.37.032807.130008. [DOI] [PubMed] [Google Scholar]
- Fernández-Tornero C., Moreno-Morcillo M., Rashid U. J., Taylor N. M. I., Ruiz F. M., Gruene T., Legrand P., Steuerwald U., Muller C. W. Nature. 2013;502:644–649. doi: 10.1038/nature12636. [DOI] [PubMed] [Google Scholar]
- Engel C., Plitzko J., Cramer P. Nat. Commun. 2016;7:e12129. doi: 10.1038/ncomms12129. [DOI] [PMC free article] [PubMed] [Google Scholar]
- Russell J., Zomerdijk J. C. Biochem. Soc. Symp. 2006;73:203–216. doi: 10.1042/bss0730203. [DOI] [PMC free article] [PubMed] [Google Scholar]
- Smid A., Riva M., Bouet F., Sentenac A., Carles C. J. Biol. Chem. 1995;270:13534–13540. doi: 10.1074/jbc.270.22.13534. [DOI] [PubMed] [Google Scholar]
- Thuriaux P., Mariotte S., Buhler J. M., Sentenac A., Vu L., Lee B. S., Nomura M. J. Biol. Chem. 1995;270:24252–24257. doi: 10.1074/jbc.270.41.24252. [DOI] [PubMed] [Google Scholar]
- Yamamoto R. T., Nogi Y., Dodd J. A., Nomura M. EMBO J. 1996;15:3964–3973. [PMC free article] [PubMed] [Google Scholar]
- Russell J., Zomerdijk J. C. B. M. Trends Biochem. Sci. 2005;30:87–96. doi: 10.1016/j.tibs.2004.12.008. [DOI] [PMC free article] [PubMed] [Google Scholar]
- Peyroche G., Levillain E., Siaut M., Callebaut I., Schultz P., Sentenac A., Riva M., Carles Christophe. Proc. Natl. Acad. Sci. U. S. A. 2002;99:14670–14675. doi: 10.1073/pnas.232580799. [DOI] [PMC free article] [PubMed] [Google Scholar]
- Blattner C., Jennebach S., Herzog F., Mayer A., Cheung A. C. M., Witte G., Lorenzen K., Hopfner K., Aebersold R., Cramer P. Genes Dev. 2011;25:2093–2105. doi: 10.1101/gad.17363311. [DOI] [PMC free article] [PubMed] [Google Scholar]
- Drygin D., Lin A., Bliesath J., Ho C. B., O'Brien S. E., Proffitt C., Omori M., Haddach M., Schwaebe M. K., Siddiqui-Jain A., Streiner N., Quin J. E., Sanij E., Bywater M. J., Hannan R. D., Ryckman D., Anderes K., Rice W. G. Cancer Res. 2011;71:1418–1430. doi: 10.1158/0008-5472.CAN-10-1728. [DOI] [PubMed] [Google Scholar]
- Ghoshal K., Majumder S., Datta J., Motiwala T., Bai S., Sharma S. M., Frankel W., Jacob S. T. J. Biol. Chem. 2004;279:6783–6793. doi: 10.1074/jbc.M309393200. [DOI] [PMC free article] [PubMed] [Google Scholar]
- Seither P., Grummt I. Genomics. 1996;37:135–139. doi: 10.1006/geno.1996.0531. [DOI] [PubMed] [Google Scholar]
- Botstein D., Fink G. R. Science. 1988;240:1439–1443. doi: 10.1126/science.3287619. [DOI] [PubMed] [Google Scholar]
- Powers S., Kataoka T., Fasano O., Goldfarb M., Strathern J., Broach J., Wigler M. Cell. 1984;36:607–612. doi: 10.1016/0092-8674(84)90340-4. [DOI] [PubMed] [Google Scholar]
- Mokdad-Gargouri R., Belhadj K., Gargouri A. Nucleic Acids Res. 2001;29:1222–1227. doi: 10.1093/nar/29.5.1222. [DOI] [PMC free article] [PubMed] [Google Scholar]
- Morris G. M., Huey R., Lindstrom W., Sanner M. F., Belew R. K., Goodsell D. S., Olson A. J. J. Comput. Chem. 2009;30:2785–2791. doi: 10.1002/jcc.21256. [DOI] [PMC free article] [PubMed] [Google Scholar]
- SYBYL-X 1.3, Tripos International, 1699 South Hanley Rd., St. Louis, Missouri 63144, USA, 2010.
- Homer R. W., Swanson J., Jilek R. J., Hurst T., Clark R. D. J. Chem. Inf. Model. 2008;48:2294–2307. doi: 10.1021/ci7004687. [DOI] [PubMed] [Google Scholar]
- National Center for Advancing Translational Sciences, Small-Molecule Repository, 2018.
- Ilan J., Quastel J. H. Biochem. J. 1966;100(2):441–447. doi: 10.1042/bj1000441. [DOI] [PMC free article] [PubMed] [Google Scholar]
- Kirk J. M. Biochim. Biophys. Acta. 1960;42:167–169. doi: 10.1016/0006-3002(60)90769-1. [DOI] [PubMed] [Google Scholar]
- Warringer J., Anevski D., Liu B., Blomberg A. BMC Chem. Biol. 2008;8:3. doi: 10.1186/1472-6769-8-3. [DOI] [PMC free article] [PubMed] [Google Scholar]
- Lee A. Y., St. Onge R. P., Proctor M. J., Wallace I. M., Nile A. H., Spagnuolo P. A., Jitkova Y., Gronda M., Wu Y., Kim M. K., Cheung-Ong K., Torres N. P., Spear E. D., Han M. K. L., Schlecht U., Suresh S., Duby G., Heisler L. E., Surendra A., Fung E., Urbanus M. L., Gebbia M., Lissina E., Miranda M., Chiang J. H., Aparicio A. M., Zeghouf M., Davis R. W., Cherfils J., Boutry M., Kaiser C. A., Cummins C. L., Trimble W. S., Brown G. W., Schimmer A. D., Bankaitis V. A., Nislow C., Bader G. D., Giaever G. Science. 2014;344:208–211. doi: 10.1126/science.1250217. [DOI] [PMC free article] [PubMed] [Google Scholar]
- Livak K. J., Schmittgen T. D. Methods. 2001;25:402–408. doi: 10.1006/meth.2001.1262. [DOI] [PubMed] [Google Scholar]
- Lee A. Y., St. Onge R. P., Proctor M. J., Wallace I. M., Nile A. H., Spagnuolo P. A., Jitkova Y., Gronda M., Wu Y., Kim M. K., Cheung-Ong K., Torres N. P., Spear E. D., Han M. K. L., Schlecht U., Suresh S., Duby G., Heisler L. E., Surendra A., Fung E., Urbanus M. L., Gebbia M., Lissina E., Miranda M., Chiang J. H., Aparicio A. M., Zeghouf M., Davis R. W., Cherfils J., Boutry M., Kaiser C. A., Cummins C. L., Trimble W. S., Brown G. W., Schimmer A. D., Bankaitis V. A., Nislow C., Bader G. D., Giaever G. Science. 2014;344:208–211. doi: 10.1126/science.1250217. [DOI] [PMC free article] [PubMed] [Google Scholar]
- Horuchi T., Horiuchi S., Mizuno D. Nature. 1959;183:1529–1530. doi: 10.1038/1831529b0. [DOI] [PubMed] [Google Scholar]
- Sun Y., Sun T. L., Huang H. W. Biophys. J. 2014;107:2082–2090. doi: 10.1016/j.bpj.2014.09.034. [DOI] [PMC free article] [PubMed] [Google Scholar]
- Masek T., Vopalensky V., Suchomelova P., Pospisek M. Anal. Biochem. 2005;336:46–50. doi: 10.1016/j.ab.2004.09.010. [DOI] [PubMed] [Google Scholar]
- Wang X. W., Seed B. Nucleic Acids Res. 2003;31:e154. doi: 10.1093/nar/gng154. [DOI] [PMC free article] [PubMed] [Google Scholar]
- Marini A. M., Soussi-Boudekou S., Vissers S., Andre B. Mol. Cell. Biol. 1997;17:4282–4293. doi: 10.1128/mcb.17.8.4282. [DOI] [PMC free article] [PubMed] [Google Scholar]
- Lorenz M. C., Heitman J. EMBO J. 1998;17:1236–1247. doi: 10.1093/emboj/17.5.1236. [DOI] [PMC free article] [PubMed] [Google Scholar]
- O'Boyle N. M., Banck M., James C. A., Morley C., Vandermeersch T., Hutchison G. R. J. Cheminf. 2011;3:33. doi: 10.1186/1758-2946-3-33. [DOI] [PMC free article] [PubMed] [Google Scholar]
Associated Data
This section collects any data citations, data availability statements, or supplementary materials included in this article.


