

ABSTRACT
Cervical cancer (CC) is a leading cause of cancer-related death in women. Limited studies have investigated whether immune-related genes (IRGs) or tumor immune microenvironment (TIME) could be indicators for CC prognoses. The aim of this study was to develop an improved prognostic signature for CC based on IRGs or TIME to predict survival and response to immune checkpoint inhibitors (ICIs). A prognostic signature was constructed using bioinformatics method and its predictive capability was validated. The mechanisms underlying the signature’s predictive capability were explored with CIBERSORT algorithm and mutation analysis. Immunophenoscore (IPS) is validated for ICIs response, and was therefore explored in relation to the signature. A prognostic signature based on 11 IRGs was developed. A multivariate analysis revealed that the 11-IRG signature was an independent prognostic factor for overall survival (OS) and progression-free interval in CC patients. In the 11-IRG signature high-risk group, CD8 T cells and resting mast cells, which are found to associate with better OS in our study, were lower; activated mast cells, associated with poorer OS, were higher, compared with the low-risk group. An IPS analysis suggested that the 11-IRG signature low-risk group, which possessed a higher IPS, represented a more immunogenic phenotype that was more inclined to respond to ICIs. In short, an 11-IRG prognostic signature for predicting CC patients’ survival and response to ICIs was firmly established. The predictive capability of this model in CC requires further testing with the goal of better prognostic stratification and treatment management.
KEYWORDS: Immune signature, cervical cancer, prognosis, immune checkpoint inhibitor response, tumor immune microenvironment
Introduction
Cervical cancer (CC) is the fourth most frequently diagnosed cancer and the fourth leading cause of cancer death in women, making CC a major public health concern.1 In 2018, there were an estimated 570,000 new cases, and 311,000 deaths from CC worldwide.1 There are two primary histological types of CC: cervical squamous cell carcinoma (CSCC), which accounts for approximately 80% to 85% of cervical cancers cases; and cervical adenocarcinoma (CAC), which accounts for 15% to 20% of cases.2 Standard treatments including chemotherapy, radiotherapy, and surgical resection have improved the prognosis of early-stage CC. However; it is difficult to prevent metastasis and recurrence of CC, which is responsible for most CC deaths.3,4 Considering the molecular mechanisms of human papilloma virus (HPV) related CC; immunotherapy provides an additional, rational treatment option for CC. Human papilloma virus related CC presents a unique viral antigen enabling T cells to distinguish between tumor cells and normal cells, and this serves as an ideal candidate for immunotherapy.5 In addition, increased mutational burden aids in the identification of neoantigens, which are targetable and present in most CCs.6 Checkpoint inhibitor-based immunotherapy targeting cytotoxic T lymphocyte antigen 4 (CTLA4), programmed cell death-ligand 1 (PD-L1), or programmed cell death 1 (PD1) have achieved impressive success in the treatment of various cancer types.7,8 While initial studies have shown activity of immune checkpoint inhibitor (ICI) in CC, response rates are disappointing.9 This suggests only a subset of CC patients can obtain clinical benefit. Despite these low response rates, pembrolizumab was approved by the United States Food and Drug Administration (FDA) for patients with recurrent or metastatic CC with disease progression during or after chemotherapy.10 To take a precision medicine approach in cancer immunotherapy, it is critical to identify and develop predictive biomarkers of checkpoint inhibitor-based immunotherapy responsiveness. Tumor immune microenvironment (TIME) is an important variable relating to the progression of CC.11,12 Additionally, several immune prognostic signatures have been reported to predict the prognosis of patients with cancer, such as lung cancer,13 ovarian cancer,14 colorectal cancer,15 and hepatocellular carcinoma.16 These studies indicate that IRGs or TIME can serve as promising biomarkers for estimating survival in corresponding cancer. However, limited studies have explored whether immune-related genes (IRGs) or TIME could be indicators for the prognosis of CC. An improved prognostic signature of CC based on IRGs or TIME is urgently needed to predict outcomes and response to ICI.
Our study aimed to develop a new immune signature with predictive power based on IRGs or TIME. Following the development of the immune signature, its relationship to clinicopathological characteristics, and prognosis (overall survival (OS) and progression-free interval (PFI)) in CC was investigated. Moreover, immune cell infiltration, mutation data, and immunophenoscore (IPS) associated with this signature in CC was thoroughly explored. This may help to provide a more complete understanding of, and more precise immunotherapy for, CC.
Materials and methods
Patient data
Cervical cancer patients with gene expression profiles and clinical information were obtained from the Cancer Genome Atlas (TCGA) data portal (https://portal.gdc.cancer.gov/). The comprehensive list of IRGs was downloaded from the Immunology Database and Analysis Portal (ImmPort) database (https://immport.niaid.nih.gov), which shares immunology data and provides a list of IRGs for cancer researchers.17 The IRGs that actively participated in the immune process were identified.17
Differential gene analysis
To select the IRGs that contributed to the development and progression of CC, differentially expressed genes (DEGs) between tumor samples and normal samples were screened using the edgeR package.18 A differential expression analysis was conducted, with an adjusted P-value < 0.05 and |log2 (fold change)| > 1 as the thresholds. Differentially expressed immune-related genes (DE IRGs) were identified at points of intersection between the IRG list (mentioned above) and the DEG list.
Functional enrichment analyses
Functional enrichment analyses were performed to investigate the possible molecular mechanisms of DE IRGs. We performed gene ontology (GO), and Kyoto Encyclopedia of Genes and Genomes (KEGG) enrichment analyses using DAVID.19 Terms in GO and KEGG with a false discovery rate (FDR) < 0.05 were considered significantly enriched and were visualized using R package “ggplot2”.20
Development and validation of the immune related signature for CC
The Cancer Genome Atlas CC patients were divided into a training set and a testing set. The training set was used for identifying the prognostic immune related signature and establishing a prognostic immune related risk model, and the testing set was used for validating its prognostic capability.21 To explore the putative DE IRGs related to prognosis for CC patients, a univariate Cox proportional hazard regression analysis was used to identify the relationship between DE IRGs and OS in the training set. If P < 0.05, the corresponding DE IRGs were considered prognostic variables. Prognosis-related DE IRGs (P < 0.05) were evaluated using a least absolute shrinkage and selection operator (LASSO) penalized Cox proportional hazards regression to minimize overfitting, and to find the best gene model using the R package “glmnet”.22,23 This model was used to construct the immune related risk signature predicting the prognosis in CC patients. The risk score was established with the following formula: Risk score = expression of Gene 1 * coefficient + expression of Gene 2 * coefficient + … expression of Gene n * coefficient.24 The risk score was calculated based on this model for each patient in the training set, testing set and total set. Patients were then divided into high- and low-risk groups according to the median cutoff of the risk score. To validate the prognostic capability of the immune related risk signature, we calculated the area under the curve (AUC) with R package “survivalROC” and evaluated the significance of the survival difference between high-and low-risk groups.25 The Kaplan–Meier survival curves demonstrated the OS of the high-risk group and low-risk group, which were stratified according to immune signature. A survival analysis was performed using the “survival” R package.26 The concordance (c)-index27 was applied to validate the predictive ability of this signature in the training, testing, and total sets using the “survcomp” R package.28 The high c-index value suggested accurate predictive capability of the signature.27
Estimate of tumor-infiltrating immune cells
The Cancer Genome Atlas gene expression RNA-sequencing data were used to estimate the proportions of 22 types of infiltrating immune cells using the CIBERSORT algorithm following the procedure as previously reported.29
Mutation analysis
Subject to availability, the mutation data for TCGA CC patients were downloaded from the TCGA data portal (https://portal.gdc.cancer.gov/). The data containing somatic variants were stored in the form of Mutation Annotation Format (MAF). Mutation data were analyzed and summarized using maftools.30 For each CC patient, we calculated the tumor mutation burden (TMB) score as follows: (total mutation/total covered bases) × 10^6.31
IPS analysis
As previously described, a patient’s IPS can be derived without bias using machine learning through consideration of the four major categories of genes that determine immunogenicity: effector cells, immunosuppressive cells, MHC molecules, and immunomodulators. This is accomplished by analyzing gene expression in the cell types comprising the four categories.32 The IPS is calculated using a scale with a range of 0–10 based on representative cell type gene expression z-scores, where higher scores are associated with increased immunogenicity.32 The IPSs of patients with CC were retrieved from The Cancer Immunome Atlas (TCIA) (https://tcia.at/home).
Statistical analysis
Continuous variables were summarized as mean ± SE or median; categorized variables were described by frequency (n) and proportion (%). Differences among variables were tested using t-tests, nonparametric tests, chi-square tests, or ANOVA tests. Univariate cox regression analysis and multivariate cox regression analysis were performed to evaluate the prognostic effect of the immune signature and various clinicopathological features including age, clinical stage, grade, and T/N/M stage. Statistical analyses were performed using Graphpad prism 7 and R software, version 3.5.1. The volcano plot was generated using R package “ggplot2”. The heatmap was generated using R package “pheatmap”. A two-sided P value < 0.05 was considered statistically significant.
Results
Patient characteristics
According to the defined criteria, RNA-sequencing expression profiles and clinical information for 304 CC patients were downloaded from the TCGA data portal. Patients were randomly divided into the training set (n = 152) and the testing set (n = 152). There were no significant differences (P > 0.05) in clinical variables between the patients in the training and testing sets (Table 1).
Table 1.
Clinical variables in the training and testing sets.
| Variables | Group | Total set(n = 304) | Training set (n = 152) |
Testing set (n = 152) | P value | Method |
|---|---|---|---|---|---|---|
| Survival time (days) | 1027 ± 65.76* | 1033 ± 93.17 | 1021 ± 93.13 | 0.9265 | t-test | |
| Vital status | Alive | 233(76.64%) | 118(77.63%) | 115(75.66%) | 0.6842 | χ2 test |
| Dead | 71(23.36%) | 34(22.37%) | 37(24.34%) | |||
| Clinical stage | I | 162(53.29%) | 87(57.24%) | 75(49.34%) | 0.5823 | χ2 test |
| II | 69(22.70%) | 29(19.08%) | 40(26.32%) | |||
| III | 45(14.80%) | 22(14.47%) | 23(15.13%) | |||
| IV | 21(6.91%) | 11(7.24%) | 10(6.58%) | |||
| NA | 7(2.30%) | 3(1.97%) | 4(2.63%) | |||
| T stage | T1 | 173(56.91%) | 94(61.84%) | 79(51.97%) | 0.2356 | χ2 test |
| T2 | 80(26.32%) | 39(25.66%) | 41(26.97%) | |||
| T3 | 20(6.58%) | 8(5.26%) | 12(7.89%) | |||
| T4 | 10(3.29%) | 3(1.97%) | 7(4.61%) | |||
| TX | 21(6.91%) | 8(5.26%) | 13(8.55%) | |||
| N stage | N0 | 168(55.26%) | 82(53.95%) | 86(56.58%) | 0.7153 | χ2 test |
| N1 | 70(23.03%) | 38(25%) | 32(21.05) | |||
| NX | 66(21.71%) | 32(21.05%) | 34(22.37%) | |||
| M stage | M0 | 128(42.11%) | 64(42.11%) | 64(42.11%) | >0.9999 | χ2 test |
| M1 | 10(3.29%) | 5(3.29%) | 5(3.29%) | |||
| MX | 166(54.61%) | 83(54.61%) | 83(54.61%) | |||
| Age(years) | ≤65 | 269(88.49%) | 140(92.11%) | 129(84.87%) | 0.0712 | Fisher’s exact test |
| >65 | 35(11.51%) | 12(7.89%) | 23(15.13%) | |||
| Histological grade | G1 | 18(5.92%) | 6(3.95%) | 12(7.89%) | 0.4765 | Fisher’s exact test |
| G2 | 135(44.41%) | 69(45.39%) | 66(43.42%) | |||
| G3 | 118(38.82%) | 62(40.79%) | 56(36.84%) | |||
| G4 | 1(0.33%) | 0 | 1(0.66%) | |||
| GX | 32(10.53%) | 15(9.87%) | 17(11.18%) | |||
| Histological type | Squamous Cell Carcinoma | 252(82.89%) | 125(82.24%) | 127(83.55%) | 0.8882 | χ2 test |
| Adenosquamous | 5(1.64%) | 3(1.97%) | 2(1.32%) | |||
| Adenocarcinoma | 47(15.46%) | 24(15.79%) | 23(15.13%) |
NA: Not Available; TX: unknown T stage; MX: unknown M stage, GX: unknown histological grade; NX: unknown N stage. * The data are presented as mean ± SE
Identification of DE IRGs
Based on the adjusted P-value < 0.05 and |log2 (fold change)| > 1, a total of 3,739 differentially expressed genes were identified: 2,062 were up-regulated and 1,677 were down-regulated. From this set of genes, 213 DE IRGs were extracted (Figure 1). Enrichment analyses for these DE IRGs were performed using DAVID. The six most highly enriched terms for biological process, cellular component, and molecular function are shown in Figure 2(a). The most enriched terms for biological process, cellular component, and molecular function were “regulation of cell proliferation”, “extracellular space”, and “growth factor activity”, respectively. The six pathways in terms of enrichment by these genes were: “cytokine-cytokine receptor interaction”, “neuroactive ligand-receptor interaction”, “JAK-STAT signaling pathway”, “axon guidance”, “melanoma”, and “B cell receptor signaling pathway” (Figure 2(b)).
Figure 1.
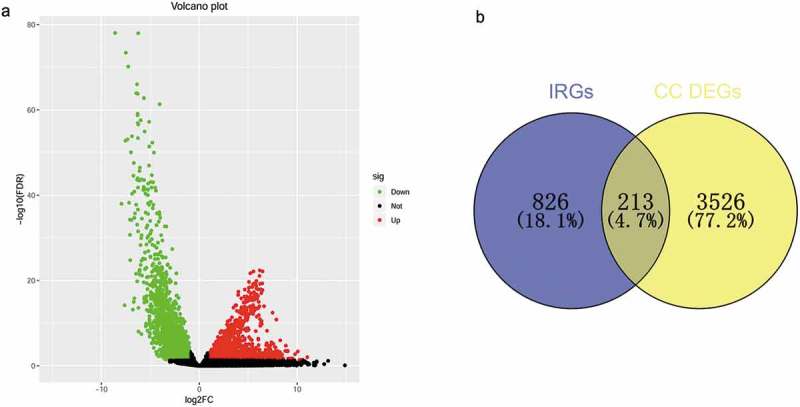
Identification of differentially expressed immune-related genes. (a) Volcano plot of differentially expressed genes in cervical cancer based on data from TCGA. (b)Venn diagram for the intersections between cervical cancer differentially expressed genes and immune-related genes.
Figure 2.
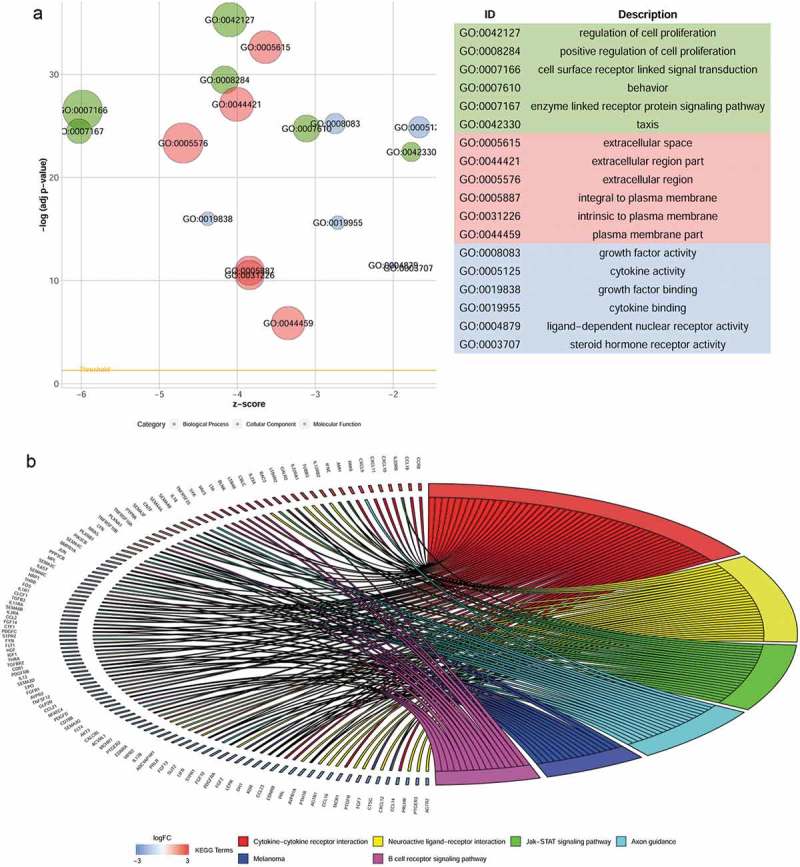
Functional enrichment analyses of differentially expressed immune-related genes. (a) Gene ontology analysis. (b) The top six most significant Kyoto Encyclopedia of Genes and Genomes pathways.
Construction of immune related risk signature
To explore the prognostic value of the above 213 DE IRGs, a univariate Cox regression analysis was performed. Seventeen DE IRGs were significantly linked to the OS of CC patients in the training set (P < 0.05). To minimize overfitting, these 17 DE IRGs underwent LASSO analysis, and 11 of the 17 DE IRGs were identified (Figure 3). We utilized these 11 DE IRGs to establish the immune signature (Table 2). As previously described, 24 the predictive model was defined as the linear combination of the expression levels of the 11 IRGs weighted by their relative coefficient in multivariate Cox regression as follows: risk score = (0.32196 * LEPR) + (−0.64921* PRLHR) + (−0.32677 *NR2F2) + (0.23573*PRL) + (0.39005*NRP1) + (0.02975*TNFRSF10B) + (0.39830*TNFRSF10A) + (0.14607*PLAU) + (−0.68625 *IFI30) + (0.38166 *ANGPTL5) + (−0.03522*IGF1). Seven of these 11 IRGs were associated with high risk (LEPR, PRL, NRP1, TNFRSF10B, TNFRSF10A, PLAU, ANGPTL5, Coef > 0) and four were protective (PRLHR, NR2F2, IFI30, IGF1, Coef < 0) (Table 2).
Figure 3.
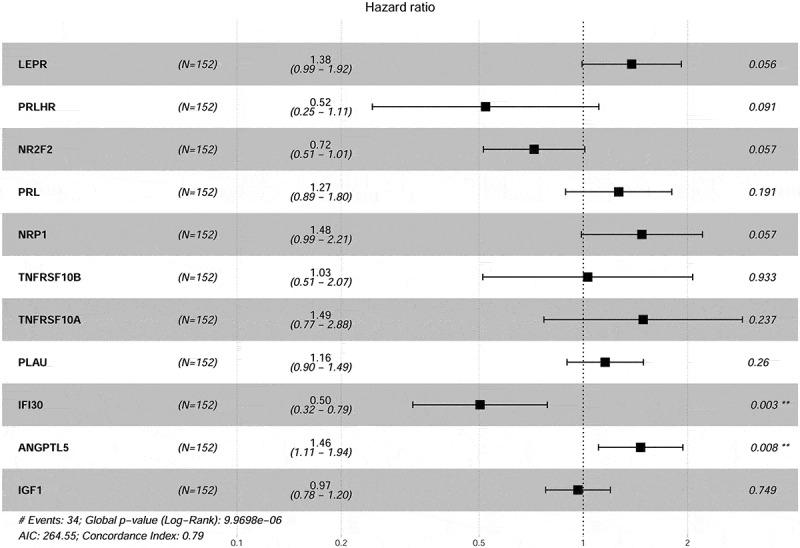
Forest plot illustrating the multivariable Cox model results of each gene in 11-IRG risk signature.
Table 2.
Coefficients and multivariable Cox model results of each gene in 11-IRG risk signature.
| Gene | Log FC | Regulation | Coefficient | HR | Z score | P value |
|---|---|---|---|---|---|---|
| LEPR | −3.67 | Down | 0.32196 | 1.37982 | 1.911 | 0.05602 |
| PRLHR | −6.70 | Down | −0.64921 | 0.52246 | −1.689 | 0.09113 |
| NR2F2 | −2.70 | Down | −0.32677 | 0.72125 | −1.901 | 0.0573 |
| PRL | −4.03 | Down | 0.23573 | 1.26584 | 1.309 | 0.19058 |
| NRP1 | −1.58 | Down | 0.39005 | 1.47706 | 1.901 | 0.05735 |
| ANGPTL5 | −2.37 | Down | 0.38166 | 1.46472 | 2.666 | 0.00768 |
| IGF1 | −2.30 | Down | −0.03522 | 0.96539 | −0.32 | 0.74867 |
| TNFRSF10B | 1.74 | Up | 0.02975 | 1.03019 | 0.084 | 0.9334 |
| TNFRSF10A | 1.78 | Up | 0.39830 | 1.48929 | 1.183 | 0.23695 |
| PLAU | 3.18 | Up | 0.14607 | 1.15728 | 1.127 | 0.25966 |
| IFI30 | 2.10 | Up | −0.68625 | 0.50346 | −3.009 | 0.00262 |
HR: hazard ratio; FC: fold change.
Risk scores for each patient in the training set were calculated (based on the 11 IRGs expression). All of the patients in the training set were classified into either a high-risk group (n = 76) or a low-risk group (n = 76) according to their median risk score. Overall survival was significantly different between the two predicted groups (P = 4.83e−06, log-rank test) (Figure 4(a)). High-risk patients had poorer OS than low-risk patients. The AUC for the 11-IRG risk signature was 0.835 at five years for OS. The AUC was 0.834 at three years (Figure 4(b)). We ranked the risk scores of patients in the training set and analyzed their distribution in Figure 4(c). The survival status of CC patients in the training set was marked on the dot plot (Figure 4(d)). The heatmap revealed expression patterns of 11 IRGs between two different prognostic patient groups (Figure 4(e)).
Figure 4.
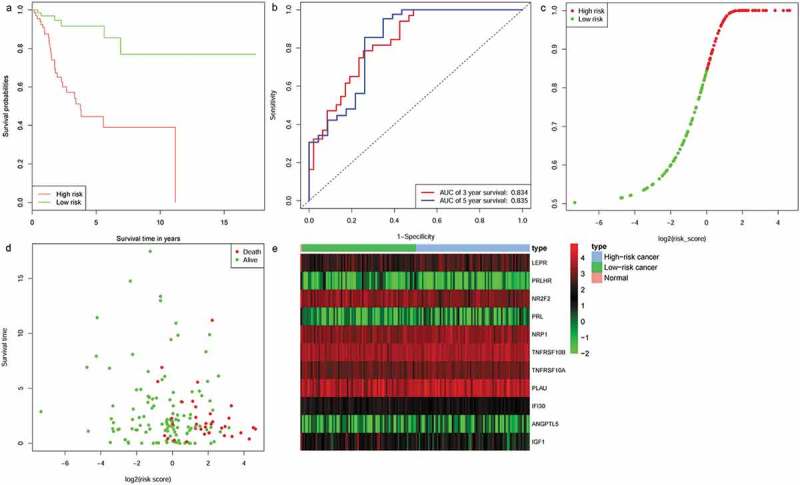
Identification of an 11-IRG signature in the training set. (a) Kaplan-Meier curve analysis of overall survival of cervical cancer patients in high- and low-risk groups. (b)Time-dependent ROC curves analysis. Risk score distribution (c), survival status (d), and 11 IRGs expression patterns (e) for patients in normal, high- and low-risk groups by the 11-IRG signature.
Evaluating the predictive capability of the 11-IRG risk signature
To determine the robustness of the 11-IRG signature, its predictive capability was further verified using the testing set and total set. The risk score was calculated for patients in the testing set and total set based on the expression level of 11 IRGs. Each patient in the testing set was marked as high-risk or low-risk, as previously described. There were 76 high-risk patients and 76 low-risk patients among the testing set. Kaplan-Meier survival curves were significantly different in the two predicted risk groups (Figure 5(a), P = 1.96e-02). Similarly, the OS for low-risk patients was higher than that of the high-risk patients. In the testing set, the three year AUC was 0.656 and the five year AUC was 0.634 (Figure 5(b)). The distribution of risk score, survival status, and expression of 11 IRGs in the testing set are displayed in Figure 5(c-e). Prognostic predictions using 11-IRG signature for patients in the total set were similar to the training set (Figure 6). Patients in the total set were divided into high-risk (n = 152) and low-risk (n = 152) groups. The high-risk patients had shorter median survival than the low-risk patients (1.6 vs. 2.036 years, P = 1.29e−06) (Figure 6(a)). In the total set, the three year AUC was 0.733 and the five year AUC was 0.747 (Figure 6(b)). The distribution of risk score, survival status, and expression of 11 IRGs for CC patients in the total set are displayed in Figure 6(c-e). The c‐index for the training, testing, and total set was 0.793, 0.725, and 0.751, respectively.
Figure 5.
Validation of the 11-IRG signature in the testing set. (a) Kaplan-Meier curve analysis of overall survival of cervical cancer patients in high- and low-risk groups. (b)Time-dependent ROC curves analysis. Risk score distribution (c), survival status (d), and 11 IRGs expression patterns (e) for patients in normal, high- and low-risk groups by the 11-IRG signature.
Figure 6.
The prognostic role of the 11-IRG signature in the total set. (a) Kaplan-Meier curve analysis of overall survival of cervical cancer patients in high- and low-risk groups. (b)Time-dependent ROC curves analysis. Risk score distribution (c), survival status (d), and 11 IRGs expression patterns (e) for patients in normal, high- and low-risk groups by the 11-IRG signature.
Relationship between the immune related risk signature and the patients’ prognosis
A univariate Cox regression model was used to analyze the relationship between OS, PFI, clinicopathological variables, and 11-IRG risk signature in the total set (Table 3). This signature could act as an independent prognostic factor for OS in the total set in the multivariate analysis (HR (95% CI) = 3.042(1.631–5.671), P < 0.001, Table 4). The signature could also independently predict PFI in the total set (HR (95%CI) = 2.774(1.448–5.310), P = 0.002, Table 4). The sample size was small after we excluded cases with unknown M stage (MX, n = 169, >50%), therefore M stage was not included in the multivariable model.
Table 3.
Univariate analysis with Cox proportional hazard model.
| Overall survival |
Progression-free interval |
|||
|---|---|---|---|---|
| Covariates | HR (95% CI) | P value | HR (95% CI) | P value |
| Age(≤65 vs. >65) | 2.739(1.321–5.679) | 0.007 | 2.267(1.005–5.114) | 0.049 |
| Histological grade | ||||
| G1 | 1 | 1 | ||
| G2 | 2.779(0.375–20.58) | 0.317 | 1.064(0.245–4.611) | 0.934 |
| G3 | 3.198(0.426–23.92) | 0.258 | 2.281(0.536–9.701) | 0.264 |
| Clinical stage | ||||
| Stage I | 1 | 1 | ||
| Stage II | 0.521(0.183−1.478) | 0.220 | 0.479(0.169–1.359) | 0.166 |
| Stage III | 1.399(0.642–3.049) | 0.398 | 0.873(0.338–2.253) | 0.779 |
| Stage IV | 2.998(1.048–8.568) | 0.041 | 2.651(0.805–8.731) | 0.109 |
| N stage(N0 vs.N1) | 2.185(1.227–3.889) | 0.008 | 1.688(0.905–3.149) | 0.100 |
| T stage | ||||
| T1 | 1 | 1 | ||
| T2 | 0.764(0.354−1.649) | 0.493 | 0.548(0.229–1.311) | 0.177 |
| T3 | 1.582(0.378–6.616) | 0.530 | 2.104(0.503–8.799) | 0.308 |
| T4 | 38.822(7.647–197.092) | <0.001 | 18.233(3.935–84.496) | <0.001 |
| 11-IRG risk score(low vs. high) | 2.893(1.579–5.299) | <0.001 | 2.567(1.364–4.831) | 0.003 |
HR: hazard ratio; CI: confidence interval.
Table 4.
Multivariate analysis with Cox proportional hazard model.
| Overall survival |
Progression-free interval |
|||
|---|---|---|---|---|
| Covariates | HR (95% CI) | P value | HR (95% CI) | P value |
| Age(≤65 vs. >65) | 3.203(1.386–7.400) | 0.006 | 2.188(0.897–5.339) | 0.085 |
| Histological grade | ||||
| G1 | 1 | 1 | ||
| G2 | 2.690(0.353–20.478) | 0.339 | 1.143(0.253–5.158) | 0.862 |
| G3 | 2.616(0.339–20.195) | 0.356 | 2.474(0.562–10.891) | 0.231 |
| Clinical stage | ||||
| Stage I | 1 | 1 | ||
| Stage II | 0.955(0.287–3.177) | 0.940 | 0.780(0.201–3.032) | 0.720 |
| Stage III | 1.433(0.634–3.239) | 0.387 | 0.677(0.244–1.880) | 0.454 |
| Stage IV | 1.667(0.342–8.126) | 0.527 | 0.866(0.107–6.907) | 0.892 |
| N stage(N0 vs. N1) | 2.226(1.135–4.368) | 0.020 | 1.883(0.927–3.827) | 0.080 |
| T stage | ||||
| T1 | 1 | 1 | ||
| T2 | 0.364(0.120–1.100) | 0.073 | 0.553(0.165–1.851) | 0.337 |
| T3 | 1.076(0.239–4.848) | 0.924 | 1.309(0.269–6.374) | 0.739 |
| T4 | 15.37(1.526–154.874) | 0.020 | 13.90(1.085–178.190) | 0.043 |
| 11-IRG risk score(low vs. high) | 3.042(1.631–5.671) | <0.001 | 2.774(1.448–5.310) | 0.002 |
HR: hazard ratio; CI: confidence interval
Association between the immune related risk signature and clinicopathological factors
The relationships between the immune signature and clinicopathological factors were analyzed. The 11-IRG risk score was significantly higher in advanced N stage cases and in increased tumor burden cases (Figure 7). The 11-IRG risk score is meaningful in the correlation of subtype classification. However, no difference was observed between age, M stage, histological grade, clinical stage, and T stage (Figure 7).
Figure 7.
The relationships between the immune related risk signature and (a) tumor burden; (b) T stage; (c) M stage; (d) N stage; (e) age; (f) histological type; (g) grade; and (h) clinical stage.
TIME changing associated with the immune related risk signature
Immune cells were the main part of TIME and we strived to determine which classes of immune cells were associated with the immune related risk signature. CIBERSORT was applied to RNA-sequencing data to assess the relative proportion of the 22 immune cells in each CC sample (Figure S1). A heatmap of the 22 immune cell proportions is presented in Figure S2. Immune cell type abundance between the 11-IRG signature low-risk group and the high-risk group in the total set are displayed in Table 5. Among the 22 immune cell types, memory B cells, activated mast cells, resting NK cells, and M0 macrophages were positively correlated with the 11-IRG risk score(Figure 8). Resting mast cells, monocytes, CD8 T cells, and regulatory T cells were negatively correlated with the 11-IRG risk score (Figure 8). Among the 22 types of immune cells, the relative proportion of mast cells, activated (Figure 9(a)); mast cells, resting (Figure 9(b)); NK cells, resting (Figure 9(c)); memory CD4 T cells, activated (Figure 9(d)); memory CD4 T cells, resting (Figure 9(e)); and CD8 T cells (Figure 9(f)) were significantly associated with OS in the survival analyses. In the 11-IRG signature high-risk group, CD8 T cells and resting mast cells which were lower levels were found to associate with better OS, and activated mast cells which were higher levels were found to associate with poorer OS. These results may partially explain the poorer prognosis for the high-risk group.
Table 5.
Immune cell type abundance between the 11-IRG signature low-risk group and high-risk group in the total set.
| Abundance |
||||
|---|---|---|---|---|
| Immune cell type# | Low-risk (n = 121) | High-risk (n = 118) |
Method | P value |
| B cells naive | 0.006118* | 0.004982* | Mann Whitney test | 0.582 |
| B cells memory | 0 | 0 | Mann Whitney test | 0.018 |
| Plasma cells | 0.04045 | 0.03793 | Mann Whitney test | 0.662 |
| T cells CD8 | 0.1766 | 0.1224 | Mann Whitney test | 0.002 |
| T cells CD4 memory resting | 0.05931 | 0.08927 | Mann Whitney test | 0.315 |
| T cells CD4 memory activated | 0.02884 | 0.03178 | Mann Whitney test | 0.944 |
| T cells follicular helper | 0.05201 | 0.04484 | Mann Whitney test | 0.123 |
| T cells regulatory | 0.05578 | 0.03317 | Mann Whitney test | 0.0001 |
| T cells gamma delta | 0 | 0 | Mann Whitney test | 0.527 |
| NK cells resting | 0 | 0 | Mann Whitney test | 0.002 |
| NK cells activated | 0.04077 | 0.03975 | Mann Whitney test | 0.775 |
| Monocytes | 0.000449 | 0 | Mann Whitney test | 0.015 |
| Macrophages M0 | 0.08207 | 0.1324 | Mann Whitney test | 3.43e-05 |
| Macrophages M1 | 0.1044 | 0.09134 | Mann Whitney test | 0.144 |
| Macrophages M2 | 0.08075 | 0.07147 | Mann Whitney test | 0.635 |
| Dendritic cells resting | 0.02452 | 0.01757 | Mann Whitney test | 0.065 |
| Dendritic cells activated | 0.008952 | 0.01998 | Mann Whitney test | 0.073 |
| Mast cells resting | 0.03694 | 0.02397 | Mann Whitney test | 0.0001 |
| Mast cells activated | 0 | 0 | Mann Whitney test | 1.04e-05 |
| Eosinophils | 0 | 0 | Mann Whitney test | 0.123 |
| Neutrophils | 0 | 0 | Mann Whitney test | 0.055 |
*The data are presented as median. # The naive CD4 T cells were absent in all CC samples.
Figure 8.
The association of immune cells infiltration and the immune related risk signature in cervical cancer. A green violin represents the 11-IRG signature low-risk group. A red violin represents the 11-IRG signature high-risk group. The white points inside the violin represent median values.
Figure 9.
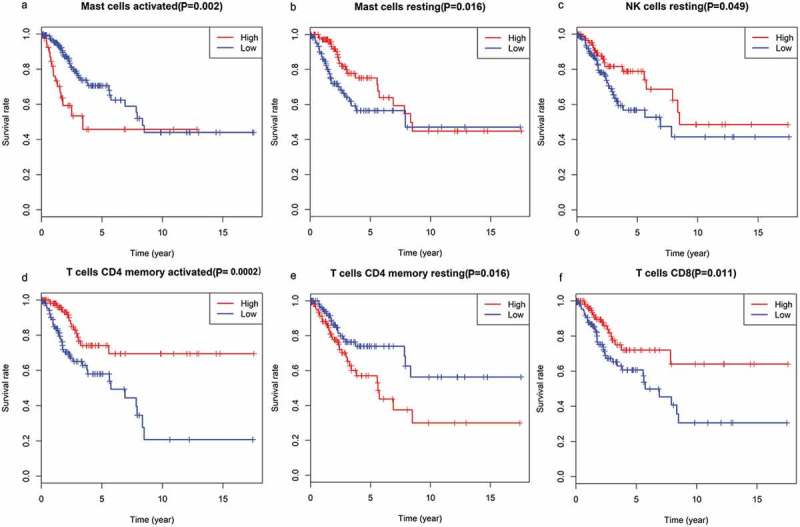
The association of immune cells infiltration and OS in TCGA cervical cancer dataset. (a) activated mast cells; (b) resting mast cells; (c) resting NK cells; (d) memory CD4 T cells, activated; (e) memory CD4 T cells, resting; (f) CD8 T cells.
The immune related risk signature and mutation profile
The relationship between mutation profile and the signature was evaluated in TCGA CC patients with available somatic mutation data. The summary of the overall mutation profile of TCGA CC dataset was illustrated in Figure S3. The top ten mutated genes in CC patients were: TTN, MUC4, PIK3CA, MUC16, KMT2C, KMT2D, SYNE1, FLG, EP300, and DMD. The most frequently mutated genes in the low-risk and high-risk groups are presented in Figure 10(a). Surprisingly, TMB was higher in low-risk patients; however, the result was not statistically significant (P = 0.7864; Figure 10(b)). Furthermore, we found that TMB was not associated with OS (P = 0.544) and PFI (P = 0.633) (Figure 10(c))
Figure 10.
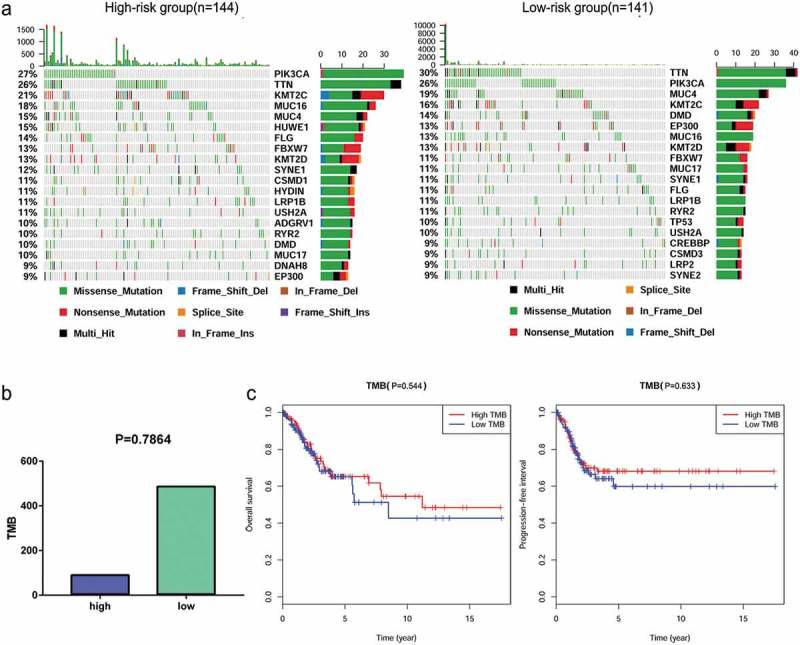
The mutation profile and TMB among low-risk and high-risk groups. (a) Mutation profile of low-risk and high-risk groups. (b) The relationship between the immune related risk signature and TMB.(c) The association of TMB and OS and PFI in TCGA cervical cancer dataset.
The immune related risk signature and response to ICI
Recent studies have revealed the role of IPS in predicting response to ICI in melanoma patient based on high pre-existing immunogenic potential .32 In this study, we thoroughly explored the association between IPS and our immune signature in CC patients. The IPS, IPS-PD1/PD-L1/PD-L2, IPS-CTLA4, and IPS-PD1/PD-L1/PD-L2 + CTLA4 scores were designed to estimate the potential to be placed on ICI for patients. The resulting scores were significantly increased in the 11-IRG signature low-risk group (Figure 11(a)): IPS, P = 0.0363; IPS-PD1/PD-L1/PD-L2, P = 0.0017; IPS-CTLA4, P = 0.0028; and IPS-PD1/PD-L1/PD-L2 + CTLA4, P = 0.0002. This indicated that the 11-IRG signature low-risk group, displaying a higher IPS, appeared to have a more immunogenic phenotype. In our study, low-risk patients presented higher gene expression of PD1 (P < 0.0001) and CTLA4 (P = 0.0004, Figure 11(b)). The expression of PD-L1 and PD-L2 was high in low-risk patients, although not statistically significant (Figure 11(b)).These results suggested that 11-IRG signature low-risk patients were promising candidates for ICI.
Figure 11.
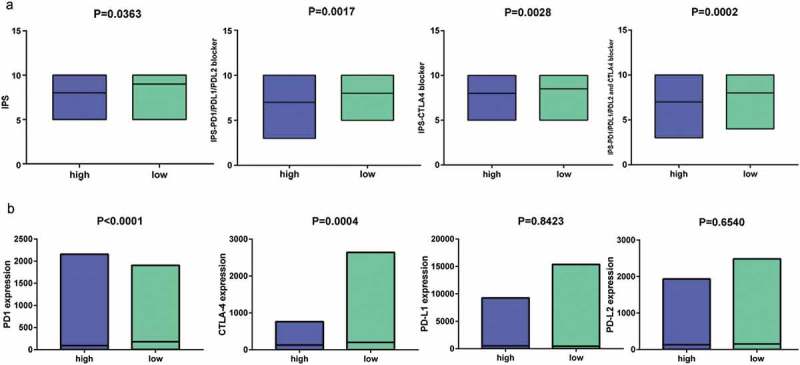
IPS and immunotherapy gene expression analysis. (a) The association between IPS and the immune related risk signature in CC patients. (b) The gene expression of PD1, CTLA4, PD-L1, and PD-L2 in low-risk and high- risk groups.
Discussion
Evidence has accumulated demonstrating the potential of ICI in CC treatment.33 However, only a small portion of CC patients obtain therapeutic effect from ICI. It is critical to identify and develop predictive biomarkers for ICI response. The complexity of the immune response and tumor biology makes it unlikely that a single biomarker will be sufficiently predictive of clinical outcomes and response to immunotherapy. Rather, the integration of multiple tumor and immune response parameters, including genomics and transcriptomics, may be necessary for accurate predictions.34 Moreover, given the critical role of TIME in tumor progression, it is of great importance to find out immune related model for the prognosis of CC patients, which may also play a significant role in identifying which patients would obtain clinical benefit from immunotherapy.
The prognostic value of this signature
We constructed and validated an immune related risk signature for CC using TCGA dataset. The signature was composed of 11 DE IRGs with prognostic capability. Among the 11 DE IRGs, seven DE IRGs (LEPR, PRL, NRP1, TNFRSF10B, TNFRSF10A, PLAU and ANGPTL5) were associated with high risk and four (PRLHR, NR2F2, IFI30, and IGF1) were protective factors. Seven genes (LEPR, PRLHR, NR2F2, PRL, NRP1, ANGPTL5, and IGF1) were downregulated in the cervical cancer tissues compared to the normal tissues based on the TCGA CC dataset. Four genes (TNFRSF10B, TNFRSF10A, PLAU, and IFI30) were upregulated. PRL, NRP1, and PLAU have been reported to be involved in CC pathogenesis or significant in predicting prognosis. A previous study has reported that PRL has antiapoptotic effect on cervical cancer cells.35 In our study, NRP1 was downregulated in the cervical cancer tissues compared to the normal tissues. However, a recent study has demonstrated that the expression of NRP1 was upregulated in the tumor tissues compared with the cervical intraepithelial neoplasia and normal tissues and high NRP1 expression was correlated with a poorer survival in Chinese patients with CC.36NRP1 has been shown to involve in regulation of vascular endothelial cell migration and angiogenesis and promoting tumor growth, invasion and metastasis.37 It is reported that PLAU (uPA) overexpresses in cervical cancer and plays a significant role in invasion and metastasis during advanced stages of cervical carcinoma.38 Moreover, PLAU is a predictor of early relapse and poor prognosis in patients with cervical cancer.39 Despite the remaining 8 genes have not been previously reported for their prognostic value in CC patients, these genes could serve as potential biomarkers. We found that these DE IRGs were cytokines or cytokine receptors (Table S1). In addition, some articles suggest that these cytokines and cytokine receptors can modulate the tumor microenvironment promoting the pathogenesis of cancer.40–44 Therefore, for CC patients in the high-risk group these genes may reflect a changing TIME, which may contribute to CC progression and a poorer prognosis. There were significant differences in survival curves between patients with high-risk and low-risk scores. The signature exhibited firm predicting capability in the training, testing, and total sets. Additionally, our signature was significantly related to CC patients’ prognosis, including OS and PFI. When clinicopathological factors were combined a multivariate Cox regression analysis demonstrated that the 11-IRG signature remained an independent prognostic factor for OS and PFI in CC patients. These results indicate that the signature is a firm prognostic tool. Our study revealed there were relationships between the signature and some clinicopathological factors including N stage and tumor burden. Furthermore, our signature was on the grounds of IRGs or TIME and presented links to tumor-infiltrating immune cells. CIBERSORT was used to assess the relative proportions of 22 immune cells in each CC sample. The abundance of CD8 T cells and resting mast cells were low in the 11-IRG signature high-risk group and associated with better OS. The abundance of activated mast cells was high in the 11-IRG signature high-risk group and associated with poorer OS. The association between CD8 T cells infiltration and CC prognosis is established .45 In our study, CD8 T cells infiltration was related to longer survival in CC patients, which is consistent with previous studies. Nonetheless, the function of mast cells in CC prognosis remains unknown. These results may partially explain the predictive value of this signature. Mutation analysis was also performed to explore the possible mechanisms of the signature’s prognostic value. Mutation profiles of the 11-IRG signature high-risk group and low-risk group were different. We reasoned that the 11-IRG signature low-risk group might have higher TMB, and that higher TMB was associated with a better prognosis in this study. These assumptions may partially explain the predictive value of this signature. Contrary to expectations, this study did not find a significant difference in TMB between 11-IRG signature high-risk group and low-risk group. Furthermore, we found that TMB was not associated with OS and PFI, which was not consistent with previous studies.46,47
Prediction of ICI response
The association between IPS and our immune signature in CC was explored. The IPS, IPS-PD1/PD-L1/PD-L2, IPS-CTLA4, and IPS-PD1/PD-L1/PD-L2 + CTLA4 scores were markedly increased in the 11-IRG signature low-risk group. Meanwhile, low-risk patients had high gene expression of PD1 and CTLA4. Our study suggested that the 11-IRG signature low-risk group may stand for an immunogenic tumor microenvironment. These results provide further support for the hypothesis that the immune signature was a potential model to determine which CC patients with immunogenic tumors are more inclined to respond to ICI. In addition, TMB and PD-L1 expression may predict the response to ICI and clinical benefit in some studies, 48–52 but the positive results are not observed in several other studies.53–56 In our study, we did not find significant differences in TMB and PD-L1 expression between the 11-IRG signature high-risk group and the low-risk group. The relevance of the signature to ICI response is not yet fully understood and further research is needed.
We constructed a valid immune related risk signature that can comprehensively assess the TIME and predict CC patients’ survival and response to immunotherapy. To the best of our knowledge, this is the first immune related predictive model for CC patients using RNA-sequencing technology. This is the first study that presents overall mutation profile and assesses the relative proportion of 22 immune cells of TCGA CC dataset. Additionally, this is the first systematic exploration of the correlation between TMB, abundance of immune cells, and CC prognosis. Our signature can predict patient survival and disease progression. Despite these promising results, questions remain. First, the signature was constructed from public data and retrospective studies. Second, in this TCGA CC cohort, the proportion of Asian patients was small. It is unclear whether this signature will function effectively for Asian patients. Future studies should incorporate a larger number of Asian CC samples.
Conclusions
We constructed a valid, reliable 11-IRG prognostic model predicting CC patient outcomes and response to ICI based on TIME or IRGs. This may provide a deeper understanding, and increased precision in the application of immunotherapy for CC. The predictive capability of this model in CC requires further testing aimed at better prognostic stratification and treatment management.
Funding Statement
This study was supported by National Natural Science Foundation of China (No. 81471670); the International Cooperative Project of Shaanxi province, China (No. 2016KW-008) and the Key research and development plan, Shaanxi Province, China (2017ZDXM-SF-066).
List of abbreviations
- TCGA
The Cancer Genome Atlas
- IRGs
immune-related genes
- CC
cervical cancer
- TIME
tumor immune microenvironment
- ICI
immune checkpoint inhibitor
- DE IRGs
differentially expressed immune-related genes
- OS
overall survival
- LASSO
least absolute shrinkage and selection operator
- IPS
immunophenoscore
- PFI
progression-free interval
- CSCC
cervical squamous cell carcinoma
- CAC
cervical adenocarcinoma
- HPV
human papilloma virus
- CTLA4
cytotoxic T lymphocyte antigen 4
- PD1
programmed cell death 1
- PD-L1
programmed cell death-ligand 1
- PD-L2
programmed cell death-ligand 2
- FDA
Food and Drug Administration
- ImmPort
the Immunology Database and Analysis Portal database
- DEGs
differentially expressed genes
- GO
gene ontology
- KEGG
Kyoto Encyclopedia of Genes and Genomes
- FDR
false discovery rate
- AUC
the area under the curve
- CI
confidence interval
- HR
hazard ratio
- MAF
Mutation Annotation Format
- TMB
tumor mutation burden
- NA
Not Available
- TX
unknown T stage
- MX
unknown M stage
- GX
unknown histological grade
- NX
unknown N stage
- TCIA
The Cancer Immunome Atlas
- Coef
coefficient
Availability of data and material
The gene expression RNA-sequencing data, mutation data and clinical information of cervical cancer in the current study were obtained from the TCGA data portal (https://portal.gdc.cancer.gov/). The comprehensive list of IRGs was downloaded from the Immunology Database and Analysis Portal (ImmPort) database (https://immport.niaid.nih.gov). The IPSs of patients with cervical cancer were retrieved from The Cancer Immunome Atlas (TCIA) (https://tcia.at/home).
Authors’ contributions
SY, YW, and YJD collected and analyzed the data, wrote the manuscript. LHZ, PTY, and YZ analyzed the data and reviewed the manuscript. DZ and ZZ participated in analyzing the data.NL, QH, and DLS participated in preparation of the figures and tables. HFK and ZJD designed the study and revised the manuscript. All the authors read and approved the final manuscript.
Declaration of interest statement
The authors declare that they have no competing interests.
Supplementary material
Supplemental data for this article can be accessed on the publisher’s website.
References
- 1.Bray F, Ferlay J, Soerjomataram I, Siegel RL, Torre LA, Jemal A.. Global cancer statistics 2018: GLOBOCAN estimates of incidence and mortality worldwide for 36 cancers in 185 countries. CA Cancer J Clin. 2018;68:1–14. doi: 10.3322/caac.21492. [DOI] [PubMed] [Google Scholar]
- 2.Wang SS, Sherman ME, Hildesheim A, Lacey JV Jr., Devesa S. Cervical adenocarcinoma and squamous cell carcinoma incidence trends among white women and black women in the United States for 1976–2000. Cancer. 2004;100:1035–1044. doi: 10.1002/cncr.20064. [DOI] [PubMed] [Google Scholar]
- 3.Tewari KS, Monk BJ. New strategies in advanced cervical cancer: from angiogenesis blockade to immunotherapy. Clin Cancer Res. 2014;20:5349–5358. doi: 10.1158/1078-0432.CCR-14-1099. [DOI] [PubMed] [Google Scholar]
- 4.Green JA, Kirwan JM, Tierney JF, Symonds P, Fresco L, Collingwood M, Williams CJ. Survival and recurrence after concomitant chemotherapy and radiotherapy for cancer of the uterine cervix: a systematic review and meta-analysis. Lancet. 2001;358:781–786. doi: 10.1016/S0140-6736(01)05965-7. [DOI] [PubMed] [Google Scholar]
- 5.Roszik J, Ring KL, Wani KM, Lazar AJ, Yemelyanova AV, Soliman PT, Frumovitz M, Jazaeri AA. Gene expression analysis identifies novel targets for cervical cancer therapy. Front Immunol. 2018;9:2102. doi: 10.3389/fimmu.2018.02102. [DOI] [PMC free article] [PubMed] [Google Scholar]
- 6.Qin Y, Ekmekcioglu S, Forget MA, Szekvolgyi L, Hwu P, Grimm EA, Jazaeri AA, Roszik J. Cervical cancer neoantigen landscape and immune activity is associated with human papillomavirus master regulators. Front Immunol. 2017;8:689. doi: 10.3389/fimmu.2017.00689. [DOI] [PMC free article] [PubMed] [Google Scholar]
- 7.Schachter J, Ribas A, Long GV, Arance A, Grob JJ, Mortier L, Daud A, Carlino MS, McNeil C, Lotem M, et al. Pembrolizumab versus ipilimumab for advanced melanoma: final overall survival results of a multicentre, randomised, open-label phase 3 study (KEYNOTE-006). Lancet. 2017;390:1853–1862. doi: 10.1016/S0140-6736(17)31601-X. [DOI] [PubMed] [Google Scholar]
- 8.Herbst RS, Baas P, Kim DW, Felip E, Perez-Gracia JL, Han JY, Molina J, Kim J-H, Arvis CD, Ahn M-J, et al. Pembrolizumab versus docetaxel for previously treated, PD-L1-positive, advanced non-small-cell lung cancer (KEYNOTE-010): a randomised controlled trial. Lancet. 2016;387:1540–1550. doi: 10.1016/S0140-6736(15)01281-7. [DOI] [PubMed] [Google Scholar]
- 9.Frenel JS, Le Tourneau C, O’Neil B, Ott PA, Piha-Paul SA, Gomez-Roca C, van Brummelen EMJ, Rugo HS, Thomas S, Saraf S, et al. Safety and efficacy of pembrolizumab in advanced, programmed death ligand 1-positive cervical cancer: results from the phase ib keynote-028 trial. J Clin Oncol. 2017;35:4035–4041. doi: 10.1200/JCO.2017.74.5471. [DOI] [PubMed] [Google Scholar]
- 10.Chung HC, Ros W, Delord JP, Perets R, Italiano A, Shapira-Frommer R, Manzuk L, Piha-Paul SA, Xu L, Zeigenfuss S, et al. Efficacy and safety of pembrolizumab in previously treated advanced cervical cancer: results from the phase II KEYNOTE-158 study. J Clin Oncol.2019;37:1470–1478. [DOI] [PubMed] [Google Scholar]
- 11.Tang A, Dadaglio G, Oberkampf M, Di Carlo S, Peduto L, Laubreton D, Desrues B, Sun C-M, Montagutelli X, Leclerc C. B cells promote tumor progression in a mouse model of HPV-mediated cervical cancer. Int J Cancer. 2016;139:1358–1371. doi: 10.1002/ijc.30169. [DOI] [PubMed] [Google Scholar]
- 12.Heeren AM, Koster BD, Samuels S, Ferns DM, Chondronasiou D, Kenter GG, Jordanova ES, de Gruijl TD. High and interrelated rates of PD-L1+CD14+ antigen-presenting cells and regulatory T cells mark the microenvironment of metastatic lymph nodes from patients with cervical cancer. Cancer Immunol Res. 2015;3:48–58. doi: 10.1158/2326-6066.CIR-14-0149. [DOI] [PubMed] [Google Scholar]
- 13.Song Q, Shang J, Yang Z, Zhang L, Zhang C, Chen J, Wu X. Identification of an immune signature predicting prognosis risk of patients in lung adenocarcinoma. J Transl Med. 2019;17:70. doi: 10.1186/s12967-019-1973-5. [DOI] [PMC free article] [PubMed] [Google Scholar]
- 14.Shen S, Wang G, Zhang R, Zhao Y, Yu H, Wei Y, Chen F. Development and validation of an immune gene-set based Prognostic signature in ovarian cancer. EBioMedicine. 2019;40:318–326. doi: 10.1016/j.ebiom.2018.12.054. [DOI] [PMC free article] [PubMed] [Google Scholar]
- 15.Wu J, Zhao Y, Zhang J, Wu Q, Wang W. Development and validation of an immune-related gene pairs signature in colorectal cancer. Oncoimmunology. 2019;8:1596715. doi: 10.1080/2162402X.2019.1596715. [DOI] [PMC free article] [PubMed] [Google Scholar]
- 16.Long J, Wang A, Bai Y, Lin J, Yang X, Wang D, Yang X, Jiang Y, Zhao H. Development and validation of a TP53-associated immune prognostic model for hepatocellular carcinoma. EBioMedicine. 2019;42:363–374. doi: 10.1016/j.ebiom.2019.03.022. [DOI] [PMC free article] [PubMed] [Google Scholar]
- 17.Bhattacharya S, Andorf S, Gomes L, Dunn P, Schaefer H, Pontius J, Berger P, Desborough V, Smith T, Campbell J, et al. ImmPort: disseminating data to the public for the future of immunology. Immunol Res. 2014;58:234–239. doi: 10.1007/s12026-014-8516-1. [DOI] [PubMed] [Google Scholar]
- 18.Robinson MD, McCarthy DJ, Smyth GK. edgeR: a Bioconductor package for differential expression analysis of digital gene expression data. Bioinformatics. 2010;26:139–140. doi: 10.1093/bioinformatics/btp616. [DOI] [PMC free article] [PubMed] [Google Scholar]
- 19.Huang Da W, Sherman BT, Lempicki RA. Systematic and integrative analysis of large gene lists using DAVID bioinformatics resources. Nat Protoc. 2009;4:44–57. doi: 10.1038/nprot.2008.211. [DOI] [PubMed] [Google Scholar]
- 20.Ito K, Murphy D. Application of ggplot2 to Pharmacometric Graphics. CPT Pharmacometrics Syst Pharmacol. 2013;2:e79. doi: 10.1038/psp.2013.56. [DOI] [PMC free article] [PubMed] [Google Scholar]
- 21.Wang Z, Song Q, Yang Z, Chen J, Shang J, Ju W. Construction of immune-related risk signature for renal papillary cell carcinoma. Cancer Med. 2019;8:289–304. doi: 10.1002/cam4.1905. [DOI] [PMC free article] [PubMed] [Google Scholar]
- 22.Wang H, Lengerich BJ, Aragam B, Xing EP. Precision Lasso: accounting for correlations and linear dependencies in high-dimensional genomic data. Bioinformatics. 2019;35:1181–1187. doi: 10.1093/bioinformatics/bty750. [DOI] [PMC free article] [PubMed] [Google Scholar]
- 23.Friedman J, Hastie T, Tibshirani R. Regularization paths for generalized linear models via coordinate descent. J Stat Softw. 2010;33:1–22. [PMC free article] [PubMed] [Google Scholar]
- 24.Chen HY, Yu SL, Chen CH, Chang GC, Chen CY, Yuan A, Cheng CL, Wang CH, Terng HJ, Kao SF, et al. A five-gene signature and clinical outcome in non-small-cell lung cancer. N Engl J Med. 2007;356:11–20. doi: 10.1056/NEJMoa060096. [DOI] [PubMed] [Google Scholar]
- 25.Lorent M, Giral M, Foucher Y. Net time-dependent ROC curves: a solution for evaluating the accuracy of a marker to predict disease-related mortality. Stat Med. 2014;33:2379–2389. doi: 10.1002/sim.6079. [DOI] [PubMed] [Google Scholar]
- 26.Holleczek B, Brenner H. Model based period analysis of absolute and relative survival with R: data preparation, model fitting and derivation of survival estimates. Comput Methods Programs Biomed. 2013;110:192–202. doi: 10.1016/j.cmpb.2012.10.004. [DOI] [PubMed] [Google Scholar]
- 27.Harrell FE Jr., Lee KL, Mark DB. Multivariable prognostic models: issues in developing models, evaluating assumptions and adequacy, and measuring and reducing errors. Stat Med. 1996;15:361–387. doi:. [DOI] [PubMed] [Google Scholar]
- 28.Schroder MS, Culhane AC, Quackenbush J, Haibe-Kains B. survcomp: an R/Bioconductor package for performance assessment and comparison of survival models. Bioinformatics. 2011;27:3206–3208. doi: 10.1093/bioinformatics/btr511. [DOI] [PMC free article] [PubMed] [Google Scholar]
- 29.Newman AM, Liu CL, Green MR, Gentles AJ, Feng W, Xu Y, Hoang CD, Diehn M, Alizadeh AA. Robust enumeration of cell subsets from tissue expression profiles. Nat Methods. 2015;12:453–457. doi: 10.1038/nmeth.3337. [DOI] [PMC free article] [PubMed] [Google Scholar]
- 30.Mayakonda A, Lin DC, Assenov Y, Plass C, Koeffler HP. Maftools: efficient and comprehensive analysis of somatic variants in cancer. Genome Res. 2018;28:1747–1756. doi: 10.1101/gr.239244.118. [DOI] [PMC free article] [PubMed] [Google Scholar]
- 31.Robinson DR, Wu YM, Lonigro RJ, Vats P, Cobain E, Everett J, Cao X, Rabban E, Kumar-Sinha C, Raymond V, et al. Integrative clinical genomics of metastatic cancer. Nature. 2017;548:297–303. doi: 10.1038/nature23306. [DOI] [PMC free article] [PubMed] [Google Scholar]
- 32.Charoentong P, Finotello F, Angelova M, Mayer C, Efremova M, Rieder D, Hackl H, Trajanoski Z. Pan-cancer immunogenomic analyses reveal genotype-immunophenotype relationships and predictors of response to checkpoint blockade. Cell Rep. 2017;18:248–262. doi: 10.1016/j.celrep.2016.12.019. [DOI] [PubMed] [Google Scholar]
- 33.Liu Y, Wu L, Tong R, Yang F, Yin L, Li M, You L, Xue J, Lu Y. PD-1/PD-L1 inhibitors in cervical cancer. Front Pharmacol. 2019;10:65. doi: 10.3389/fphar.2019.00848. [DOI] [PMC free article] [PubMed] [Google Scholar]
- 34.Masucci GV, Cesano A, Hawtin R, Janetzki S, Zhang J, Kirsch I, Dobbin KK, Alvarez J, Robbins PB, Selvan SR, et al. Validation of biomarkers to predict response to immunotherapy in cancer: Volume I - pre-analytical and analytical validation. J Immunother Cancer. 2016;4:76. doi: 10.1186/s40425-016-0178-1. [DOI] [PMC free article] [PubMed] [Google Scholar]
- 35.Ramírez De Arellano A, Riera Leal A, Lopez-Pulido EI, González-Lucano LR, Macías Barragan J, Del Toro Arreola S, García-Chagollan M, Palafox-Sánchez CA, Muñoz-Valle JF, Pereira-Suárez AL. A 60 kDa prolactin variant secreted by cervical cancer cells modulates apoptosis and cytokine production. Oncol Rep. 2018;39:1253–1260. doi: 10.3892/or.2018.6222. [DOI] [PubMed] [Google Scholar]
- 36.Yang L, Liu L, Zhu YH, Wang BB, Chen YN, Zhang F, Zhang XA, Ren CC. Neuropilin-1 is associated with the prognosis of cervical cancer in Henan Chinese population. Onco Targets Ther. 2019;12:2911–2920. doi: 10.2147/OTT.S194349. [DOI] [PMC free article] [PubMed] [Google Scholar]
- 37.Miao HQ, Lee P, Lin H, Soker S, Klagsbrun M. Neuropilin-1 expression by tumor cells promotes tumor angiogenesis and progression. Faseb J. 2000;14:2532–2539. doi: 10.1096/fj.00-0250com. [DOI] [PubMed] [Google Scholar]
- 38.Au Yeung CL, Tsang TY, Yau PL, Kwok TT. Human papillomavirus type 16 E6 induces cervical cancer cell migration through the p53/microRNA-23b/urokinase-type plasminogen activator pathway. Oncogene. 2011;30:2401–2410. doi: 10.1038/onc.2010.613. [DOI] [PubMed] [Google Scholar]
- 39.Kobayashi H, Fujishiro S, Terao T. Impact of urokinase-type plasminogen activator and its inhibitor type 1 on prognosis in cervical cancer of the uterus. Cancer Res. 1994;54:6539–6548. [PubMed] [Google Scholar]
- 40.Abolhassani M, Aloulou N, Chaumette MT, Aparicio T, Martin-Garcia N, Mansour H, Le Gouvello S, Delchier JC, Sobhani I. Leptin receptor-related immune response in colorectal tumors: the role of colonocytes and interleukin-8. Cancer Res. 2008;68:9423–9432. doi: 10.1158/0008-5472.CAN-08-1017. [DOI] [PubMed] [Google Scholar]
- 41.Hansen W. Neuropilin 1 guides regulatory T cells into VEGF-producing melanoma. Oncoimmunology. 2013;2:e23039. doi: 10.4161/onci.23039. [DOI] [PMC free article] [PubMed] [Google Scholar]
- 42.Hansen W, Hutzler M, Abel S, Alter C, Stockmann C, Kliche S, Albert J, Sparwasser T, Sakaguchi S, Westendorf AM, et al. Neuropilin 1 deficiency on CD4+Foxp3+ regulatory T cells impairs mouse melanoma growth. J Exp Med. 2012;209:2001–2016. doi: 10.1084/jem.20111497. [DOI] [PMC free article] [PubMed] [Google Scholar]
- 43.Iyori M, Zhang T, Pantel H, Gagne BA, Sentman CL. TRAIL/DR5 plays a critical role in NK cell-mediated negative regulation of dendritic cell cross-priming of T cells. J Immunol. 2011;187:3087–3095. doi: 10.4049/jimmunol.1003879. [DOI] [PMC free article] [PubMed] [Google Scholar]
- 44.Zhu J, Petit PF, Van den Eynde BJ. Apoptosis of tumor-infiltrating T lymphocytes: a new immune checkpoint mechanism. Cancer Immunol Immunother. 2019;68:835–847. doi: 10.1007/s00262-018-2269-y. [DOI] [PMC free article] [PubMed] [Google Scholar]
- 45.de Vos van Steenwijk PJ, Ramwadhdoebe TH, Goedemans R, Doorduijn EM, van Ham JJ, Gorter A, van Hall T, Kuijjer ML, van Poelgeest MIE, van der Burg SH, et al. Tumor-infiltrating CD14-positive myeloid cells and CD8-positive T-cells prolong survival in patients with cervical carcinoma. Int J Cancer. 2013;133:2884–2894. doi: 10.1002/ijc.28309. [DOI] [PubMed] [Google Scholar]
- 46.Innocenti F, Ou FS, Qu X, Zemla TJ, Niedzwiecki D, Tam R, Mahajan S, Goldberg RM, Bertagnolli MM, Blanke CD. Mutational analysis of patients with colorectal cancer in CALGB/SWOG 80405 identifies new roles of microsatellite instability and tumor mutational burden for patient outcome. J Clin Oncol. 2019;37:1217–1227. [DOI] [PMC free article] [PubMed] [Google Scholar]
- 47.Goodman AM, Kato S, Bazhenova L, Patel SP, Frampton GM, Miller V, Stephens PJ, Daniels GA, Kurzrock R. Tumor mutational burden as an independent predictor of response to immunotherapy in diverse cancers. Mol Cancer Ther. 2017;16:2598–2608. doi: 10.1158/1535-7163.MCT-17-0386. [DOI] [PMC free article] [PubMed] [Google Scholar]
- 48.Johnson DB, Frampton GM, Rioth MJ, Yusko E, Xu Y, Guo X, Ennis RC, Fabrizio D, Chalmers ZR, Greenbowe J, et al. Targeted next generation sequencing identifies markers of response to PD-1 blockade. Cancer Immunol Res. 2016;4:959–967. doi: 10.1158/2326-6066.CIR-16-0143. [DOI] [PMC free article] [PubMed] [Google Scholar]
- 49.Singal G, Miller PG, Agarwala V, Li G, Kaushik G, Backenroth D, Gossai A, Frampton GM, Torres AZ, Lehnert EM, et al. Association of patient characteristics and tumor genomics with clinical outcomes among patients with non-small cell lung cancer using a clinicogenomic database. Jama. 2019;321:1391–1399. doi: 10.1001/jama.2019.3241. [DOI] [PMC free article] [PubMed] [Google Scholar]
- 50.Goodman AM, Kato S, Chattopadhyay R, Okamura R, Saunders IM, Montesion M, Frampton GM, Miller VA, Daniels GA, Kurzrock R. Phenotypic and genomic determinants of immunotherapy response associated with squamousness. Cancer Immunol Res. 2019;7:866–873. doi: 10.1158/2326-6066.CIR-18-0716. [DOI] [PMC free article] [PubMed] [Google Scholar]
- 51.Vilain RE, Menzies AM, Wilmott JS, Kakavand H, Madore J, Guminski A, Liniker E, Kong BY, Cooper AJ, Howle JR, et al. Dynamic changes in PD-L1 expression and immune infiltrates early during treatment predict response to PD-1 blockade in melanoma. Clin Cancer Res. 2017;23:5024–5033. doi: 10.1158/1078-0432.CCR-16-0698. [DOI] [PubMed] [Google Scholar]
- 52.Hellmann MD, Nathanson T, Rizvi H, Creelan BC, Sanchez-Vega F, Ahuja A, Ni A, Novik JB, Mangarin LMB, Abu-Akeel M, et al. Genomic features of response to combination immunotherapy in patients with advanced non-small-cell lung cancer. Cancer Cell. 2018;33(5):843–852.e4. doi: 10.1016/j.ccell.2018.03.018. [DOI] [PMC free article] [PubMed] [Google Scholar]
- 53.Chae YK, Pan A, Davis AA, Raparia K, Mohindra NA, Matsangou M, Giles FJ. Biomarkers for PD-1/PD-L1 blockade therapy in non-small-cell lung cancer: is PD-L1 expression a good marker for patient selection? Clin Lung Cancer. 2016;17:350–361. doi: 10.1016/j.cllc.2016.03.011. [DOI] [PubMed] [Google Scholar]
- 54.Gibney GT, Weiner LM, Atkins MB. Predictive biomarkers for checkpoint inhibitor-based immunotherapy. Lancet Oncol. 2016;17:e542–e51. doi: 10.1016/S1470-2045(16)30406-5. [DOI] [PMC free article] [PubMed] [Google Scholar]
- 55.Hugo W, Zaretsky JM, Sun L, Song C, Moreno BH, Hu-Lieskovan S, Berent-Maoz B, Pang J, Chmielowski B, Cherry G, et al. Genomic and transcriptomic features of response to anti-PD-1 therapy in metastatic melanoma. Cell. 2016;165:35–44. doi: 10.1016/j.cell.2016.02.065. [DOI] [PMC free article] [PubMed] [Google Scholar]
- 56.Owada-Ozaki Y, Muto S, Takagi H, Inoue T, Watanabe Y, Fukuhara M, Yamaura T, Okabe N, Matsumura Y, Hasegawa T, et al. Prognostic impact of tumor mutation burden in patients with completely resected non-small cell lung cancer: brief report. J Thorac Oncol. 2018;13:1217–1221. doi: 10.1016/j.jtho.2018.04.003. [DOI] [PubMed] [Google Scholar]
Associated Data
This section collects any data citations, data availability statements, or supplementary materials included in this article.
Supplementary Materials
Data Availability Statement
The gene expression RNA-sequencing data, mutation data and clinical information of cervical cancer in the current study were obtained from the TCGA data portal (https://portal.gdc.cancer.gov/). The comprehensive list of IRGs was downloaded from the Immunology Database and Analysis Portal (ImmPort) database (https://immport.niaid.nih.gov). The IPSs of patients with cervical cancer were retrieved from The Cancer Immunome Atlas (TCIA) (https://tcia.at/home).