

ABSTRACT
HVEM (Herpes Virus Entry Mediator) engagement of BTLA (B and T Lymphocyte Attenuator) triggers inhibitory signals in T cells and could play a role in evading antitumor immunity. Here, HVEM expression levels in melanoma metastases were analyzed by immunohistochemistry, correlated with overall survival (OS) in 116 patients, and validated by TCGA transcriptomic data. Coincident expression of HVEM and its ligand BTLA was studied in tumor cells and tumor-infiltrating lymphocytes (TILs) by flow cytometry (n = 21) and immunofluorescence (n = 5). Candidate genes controlling HVEM expression in melanoma were defined by bioinformatics studies and validated by siRNA gene silencing. We found that in patients with AJCC stage III and IV melanoma, OS was poorer in those with high HVEM expression on melanoma cells, than in those with a low expression, by immunohistochemistry (p = .0160) or TCGA transcriptomics (p = .0282). We showed a coincident expression of HVEM at the surface of melanoma cells and of BTLA on TILs. HVEM was more widely expressed than PD-L1 in melanoma cells. From a mechanistic perspective, in contrast to PDL1, HVEM expression did not correlate with an IFNγ signature but with an aggressive gene signature. Interestingly, this signature contained MITF, a key player in melanoma biology, whose expression correlated strongly with HVEM. Finally, siRNA gene silencing validated MITF control of HVEM expression. In conclusion, HVEM expression seems to be a prognosis marker and targeting this axis by checkpoint-inhibitors may be of interest in metastatic melanoma.
KEYWORDS: HVEM/TNFRSF14, BTLA, melanoma, prognosis, MITF
Introduction
Metastatic melanoma had one of the poorest prognoses among metastatic cancers until the arrival of immunotherapies based on anti-CTLA-4 and anti-PD-1 antibodies.1−3 Although anti-CTLA-4 and anti-PD-1 treatment dramatically improved overall survival, almost half of patients do not benefit, notably because hyporesponsiveness may depend also on other co-inhibitory molecules than PD-1. Therefore, it is likely that combined immunotherapy targeting other appropriate co-inhibitory pathways will be required to optimize therapeutic benefit. It is thus important to characterize novel co-inhibitory pathways expressed in tumor-infiltrating Lymphocytes (TILs) and to validate them as targets for novel antitumor therapy. Accordingly, we focused our interest on the Herpes Virus Entry Mediator (HVEM)/B-lymphocyte and T-lymphocyte attenuator (BTLA) co-inhibitory axis in melanoma.
HVEM (also known as TNFRSF14) is a member of the TNF receptor superfamily, which is expressed on several types of cells, including T cells, B cells, natural killer cells, dendritic cells, and myeloid cells. HVEM functions as either a ligand or a receptor in diverse physiological and pathological conditions.4,5 For instance, HVEM is a ligand for the TNF superfamily members LIGHT and lymphotoxin α. Binding of T cell-expressed LIGHT to HVEM expressed by antigen presenting cells results in enhanced T cell proliferation and cytokine production.6 Conversely, when HVEM engages BTLA – a member of the immunoglobulin superfamily – or CD160 on T cells, it triggers inhibitory signals resulting in decreased T cell proliferation and cytokine production.7 However, a recent publication suggests that BTLA can use the cytosolic adaptor GRB2 to trigger co-stimulatory signals in T cells.8 Therefore, HVEM and BTLA appear to play a dual role in T cell activation depending on the ligands and intracytoplasmic effectors they interact with.
HVEM was originally thought to be primarily expressed on hematopoietic cells. However, a recent study9 showed, using in vitro assays, that around 75% of melanomas expressed HVEM and that the presence of HVEM on melanoma cells inhibited the proliferation of and production of IFNγ by BTLA+ tumor-specific CD8+ T cells. These results suggest that the inhibitory signals caused by HVEM/BTLA interactions contribute to tumor evasion. Indeed a dual BTLA and PD-1 blockade enhanced the expansion, proliferation, and cytokine production of NY-ESO-1-specific CD8+ T cells from melanoma patients compared to PD-1 blockade alone.10 In a similar way, BTLA blockade enhances the efficacy of anti-PD1 treatment in murine syngeneic tumor models of bladder, colorectal, and breast cancer.11 High levels of HVEM expression in human esophageal squamous cell carcinoma are associated with significantly lower survival rates.12 Similar results have been obtained in colorectal cancer,13 hepatocellular carcinoma, 14 breast cancer, 15 ovarian serous adenocarcinoma, 16 clear renal cell carcinoma17 and glioblastoma18. However, the problem is more complex, since high levels of HVEM expression were associated with improved cancer-specific survival in other tumor like pancreatic, ampullary, 19 and bladder cancer.20 Likewise, adoptive cell therapy trials in melanoma revealed that the presence of CD8+ BTLA+ TILs is associated with a better clinical outcome.21
The contrasting findings described above led us to address the prognostic role of HVEM in melanoma, an unexplored issue to date.
Material and methods
Patients and specimens
The cohort used for immunohistochemistry (IHC) comprises formalin-fixed paraffin-embedded (FFPE) samples of melanoma metastases collected from 116 patients consecutively during tumor excision for tumor mass sterilization or palliative care, between 2009 and 2012, in the Departments of Pathology of La Timone Hospital (Marseille, France) and Guy de Chauliac Hospital (Montpellier, France). When more than one specimen was available from a patient, the last resected sample was arbitrarily used. Table 1 summarizes the clinical characteristics of patients. The median follow-up for patients, calculated from the date of initial diagnosis to the date of death or loss of follow-up, was 56.3 months (range, 2.4–396.3 months).
Table 1.
Clinical characteristics of the cohort of 116 melanoma metastases subjected to immunohistochemistry analysis and HVEM expression scoring.
| HVEM score |
|||
|---|---|---|---|
| Variables | Nb of patients | Low n (%) | High n (%) |
| Cohort | 116 | 65 (56) | 51 (44) |
| Men | 65 | 31 (48) | 34 (52) |
| Women | 51 | 34 (67) | 17 (33) |
| Median age at initial diagnostic [range] | 56 [19-89] | 54 [25-86] | |
| At the time of sampling | |||
| Staging according to AJCC 8th edition | |||
| III | 66 | 34 (52) | 32 (48) |
| IIIB | 13 | 7 (54) | 6 (46) |
| IIIC | 51 | 26 (51) | 25 (49) |
| IIID | 2 | 1 (50) | 1 (50) |
| IV | 50 | 28 (56) | 22 (44) |
| M1a | 1 | 1 (100) | 0 (0) |
| M1b | 6 | 4 (67) | 2 (33) |
| M1c | 16 | 8 (50) | 8 (50) |
| M1d | 27 | 15 (56) | 12 (44) |
| Number of metastatic sites ≥ 3 | 34 | 17 (50) | 17 (50) |
| Presence of liver metastases | 16 | 9 (56) | 7 (44) |
| Tumor B-RAF mutated / data available | 31/70 | 19/33 | 12/37 |
| Treatment received before the sampling | |||
| Adjuvant interferon or vaccine | 26 | 12 (46) | 14 (54) |
| Chemotherapy alone | 8 | 6 (80) | 2 (20) |
| Targeted therapy | 3 | 0 (0) | 3 (100) |
| Anti-CTLA-4 | 5 | 2 (40) | 3 (60) |
| Treatment received after the sampling | |||
| Chemotherapy alone | 30 | 14 (47) | 16 (53) |
| Targeted therapy | 14 | 9 (64) | 5 (36) |
| Anti-CTLA-4 | 22 | 7 (32) | 15 (68) |
| Anti-CTLA-4 then Anti-PD-1 | 5 | 4 (80) | 1 (20) |
| Targeted therapy then Anti-CTLA-4 or Anti-PD-1 | 9 | 4 (44) | 5 (56) |
| Anti-CTLA-4 or Anti-PD-1 then Targeted therapy | 3 | 2 (66) | 1 (33) |
The flow cytometry and co-immunofluorescence cohorts were prospectively obtained from 21 fresh tumor samples taken during planned surgical procedures occurring between 2014 and 2016 at La Timone and Nord Hospital in Marseille. Samples for flow cytometry and co-immunofluorescence were immediately stored in RPMI at 4°C or frozen at −90°C, respectively. Tumor samples included 76% lymph nodes, 19% skin, and 5% liver metastases. Among those samples, 67% originated from patients who were treatment-free before sampling, while 14% had received IFN, 14% a checkpoint inhibitor, and 5% a targeted therapy.
Written informed consent was obtained from all living patients and the present study was approved by our Institutional Review Board (RO-2014/04).
Survival assessment
Overall survival was defined as the time from initial diagnosis to last assessment or date of death from any cause. Survival from biopsy was defined as the time from sampling (used to assess HVEM and PD-L1 scoring) to last assessment or date of death from any cause.
HVEM immunohistochemistry
The 79 tissue samples from La Timone Hospital (Marseille, France) were analyzed by tissue microarrays (TMA): briefly, four representative 0.6-mm cores were taken from each tumor sample after selection by a pathologist. The 37 samples from Guy de Chauliac Hospital (Montpellier, France) were studied on whole-slide cuts to observe the overall pattern and heterogeneity of immunostaining in the tumor. An anti-HVEM antibody (94804, R&D) was used at 1:150 dilutions, while additional immunostainings were performed using anti-Melan-A (MART1) (A103, Cell-marque) and anti-PS100 (RP035, Clinisciences) antibodies to stain melanoma cells and anti-CD68 (KP1, Dako) and anti-CD163 (10D6, Leica) antibodies to stain histiocytes/macrophages. Four-micrometer thick sections were cut and mounted on SuperFrost Plus adhesive slides (Thermoshandon, Pittsburgh, PA) and IHC was performed on the Benchmark XT automated immunostaining instrument (Ventana Medical Systems Inc, Roche, Tucson, AZ, USA), using an indirect biotin-free system based on polymers (Ultraview universal RED kit, Ventana medical Systems Inc.). Negative isotype controls were used for each antibody: these control slides, cut from the TMA, were incubated with a nonimmune immunoglobulin in the same temperature and pretreatment conditions as those used for the primary antibody and revealed by the ultraview universal RED kit in the same automated instrument.
HVEM expression scoring
HVEM expression was evaluated by a pathologist without prior knowledge of the patient’s clinical status. Since HVEM expression patterns in melanoma were unknown, we used an immunoreactive score37 adapted to HVEM linear expression to evaluate the immunostaining. First, the pathologist reviewed the 79 samples embedded in the TMA to determine the overall expression profile of HVEM: spots with the least and most intense staining on the TMA matrix were identified and compared with the HVEM expression of normal lymphoid, kidney, and brain tissue taken from patients without other history of malignancy. Those non-tumoral tissues were embedded on the TMA matrix and used as internal controls and standards for HVEM staining scores. Scoring was then performed for each TMA spot, taking into account the intensity of the immunostaining relative to normal lymphoid tissue, which was arbitrarily scored as 2. Therefore, the intensity of each spot was scored as 0 (negative, complete absence of signal), 1 (weak, very faint cytoplasmic staining, only visible at high magnification, and less than the intensity of HVEM in normal lymphoid tissue), 2 (intermediate signal, equal to the intensity in normal lymphoid tissue), or 3 (intense staining, greater than the intensity in normal lymphoid tissue) (Figure 1(b)). To take into account the possibility of heterogeneous HVEM expression, four different TMA spots were taken from different locations or from different blocks of the same melanoma specimen. A global score was calculated, corresponding to the sum of the HVEM intensities observed in the four spots of each sample: this global score thus ranged from 0 to 12 (Figure 1(a)). When fewer than four TMA spots could be analyzed, the global score was normalized. To avoid false negatives resulting from sampling bias, all negative spots were confirmed a second time on a fresh whole-slide cut taken from the donor block. In addition, 33 samples were directly analyzed on whole slides and HVEM expression was scored as described above, using lymphocytes present on the slide as a 2+ standard. To account for signal heterogeneity, HVEM was scored on four different 0.60 mm2 microscopic fields. For each part of the slide reviewed, HVEM intensity was interpreted globally and only the highest score was retained when different staining intensities were present in a single microscopic field. A global score was also calculated corresponding to the sum of the HVEM intensities observed in the four analyzed fields of the slide. TMA spots or whole-slide cases were excluded from the analysis when no tumor cells were present (confirmed by the absence of staining for MART1 and PS100), when HVEM+ macrophages (identified using CD68 and/or CD163 expression) were too numerous, or when melanin pigment interfered with proper HVEM interpretation.
Figure 1.
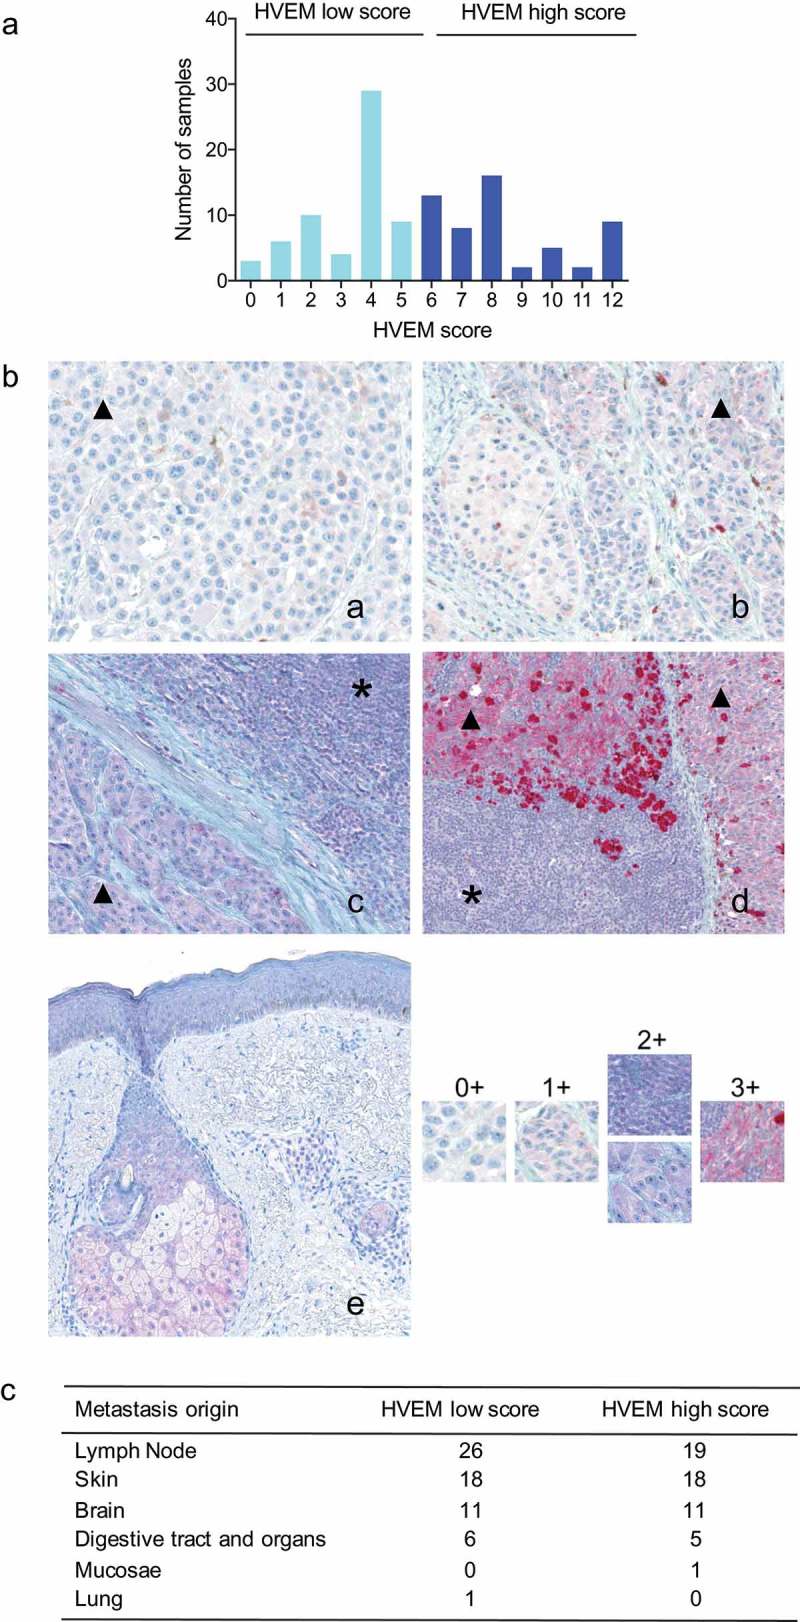
HVEM expression scoring.
(a) Our developed HVEM expression score (see Materials and Methods) revealed the broad and heterogeneous pattern of HVEM expression at the surface of melanoma cells. (b) Representative section of four melanoma metastases (a–d; magnification: X200) and of a normal skin control (e; magnification: X100) stained for HVEM. Four representative TMA spots were taken from each melanoma metastases sample (melanoma cells identified with black triangles) and each was ranked as 0: negative, absence of signal (panel a), 1: weak and inferior to the level of HVEM signal on lymphocytes (*) (panel b); 2: intermediate signal, equal to the level of HVEM signal on lymphocytes (panel c), and 3: intense signal, superior to the level of HVEM signal on lymphocytes (panel d). The sum of the intensities of the four TMA spots provided a score of 0–12. Note that in the normal skin section shown in panel e, HVEM is only expressed by sebaceous glands. (c) Distribution of high and low HVEM expression scores among melanoma metastatic sites assessed by immunohistochemistry.
PD-L1 expression scoring
PD-L1 expression was evaluated by an anti-PD-L1 antibody on whole slides cut from the FFPE blocks of 67 patients from the 79 initially used to build the TMA, due to the absence of surplus FFPE blocks for the remaining 12. Immunostaining was performed using an automated Ventana Benchmark ULTRA (Diagomics) (prediluted rabbit monoclonal QR1 anti-PD-L1 antibody; pretreatment: Cell Conditioning 1 solution; incubation: 32 min; detection: Ventana Ultraview DAB kit). A senior pathologist reviewed the slides; PD-L1 positivity threshold was defined as at least 5% of tumor cells displaying membranous PD-L1 staining of any intensity. Only slides containing at least 100 melanoma cells were evaluated.
TCGA transcriptomic data
HVEM transcriptomic data from the skin cutaneous melanoma (SKCM) project of The Cancer Genome Atlas (TCGA) were assessed, using distant and lymph node metastases cohorts to enable comparisons with the IHC cohort. The PROGgeneV2 database was used (http://watson.compbio.iupui.edu/chirayu/proggene/database) to study prognostic implications using median gene expression as a bifurcating point.38
Flow cytometry
After mechanical and gentleMACS (Miltenyi) dissociation, the cell suspension was filtered first at 70 μm and subsequently at 30 μm. The cell pellet was resuspended in PBS at 200 000 cells per well and used for the staining protocols of both the tumor cells and TILs if enough cells were available. Extracellular staining (30 min, 4°C) was performed for both protocols, as indicated by the manufacturer, with anti-CD3 (clone UCHT1, BC), anti-CD8 (clone HIT8a, BD), anti-CD45 (clone Immu19.2, BC), anti-panGD (clone Immu510, BC), anti-HVEM (clone CW10, BD), anti-BTLA (clone MIH12, Biolegend), anti-CD160 (clone BY55, ebiosciences), anti-LIGHT (clone 7–3(3), ebiosciences), and anti-PD-L1 antibodies (clone MIH1, BD Horizon), Live/Dead assays (Life technologies), and corresponding isotype controls. Intracellular staining was then used to gate melanoma cells. Accordingly, after permeabilization was performed with a BD Kit Cytoperm/Cytofix, cells were stained with a combination of melanoma-specific antibodies directed at HMB45, MART1, and tyrosinase (clones HMB45, DT100, BC199 and T311). The gating strategies used for melanoma tumor cells and TILs are shown in Supplementary Figures S1 and S2. PD-L1 staining was positively tested on the melanoma cell line Gerlach (kind gift from Pr. Coulie, UCL, Belgium), where increased PD-L1 expression following the addition of IFNγ was observed with two different conjugated fluorochromes (BV421 and APC). Stained cells were analyzed using a FACS CANTO II (BD Bioscience) cytometer and analyses were performed using FACSDIVA v8 and FLOWJOv10.4.
In situ immunofluorescence staining and analysis of tils and melanocytes
Tissue samples from patients with melanoma were frozen and stored at −80°C. A pathologist examined the sample quality using hematoxylin- and eosin-stained sections. Frozen specimens were sectioned at 4–6 µm with a cryostat, placed on slides, air dried, and fixed for 5 minutes with 100% acetone. Before incubation with antibodies, the slides were pretreated with avidin/biotin blocker (DAKO) for 10 minutes and Fc receptors were blocked with 10% FcR Blocking Reagent (Miltenyi Biotec) in PBS for 15 minutes. Staining for CD8 (IgG2b, rat, clone YTC182.20; Abcam), BTLA (IgG2b, mouse, clone 7.1; homemade), Melan-A (IgG, rabbit, clone A19-P; NovusBio), and HVEM (IgG1, mouse, clone 94804; R&D) were performed using non-labeled primary antibodies followed by fluorophore-labeled secondary antibodies: Alexa Fluor® 488 (Life), Cyanin-3, Cyanin-5, and biotinylated anti-mouse-IgG1 followed by a streptavidin-Alexa Fluor® 594 (Jackson Immunoresearch), respectively. Isotype-matched antibodies were used as negative controls. In each case, we checked that secondary antibodies did not cross-react with unrelated primary antibodies used in the combination. Nuclei were highlighted using DAPI mounting medium (Sigma).
Slides of stained melanoma sections were read with an automated VectraR microscope. As recommended for multiplex analysis, single-stained fluorophores (CD8-Alexa Fluor® 488, BTLA-Cyanin-3, Melan-A-Cyanin-5, HVEM-Alexa Fluor® 594, and DAPI) and non-stained slides were analyzed in Inform-coupled software to integrate the corresponding spectra in a fluorophore library. On each image, the Inform software integrates various signals, allowing a multiplex staining protocol.
Determining gene expression correlations with HVEM expression
To find genes whose expression correlates with HVEM expression in melanoma, data from the NCI-60 cancer cell line (GSE5846) was retrieved and processed using GEO2R at NCBI, then analyzed using Multiple Experiment Viewer. The NCI-60 panel was chosen in order to assess gene expression correlations in a wide panel of conditions, and on a wider dynamic range than restricting the analysis to melanoma only, aiming to increase the specificity of correlations with HVEM. Genes showing a Pearson correlation with HVEM higher than 0.8 were retained, resulting in a signature of 20 genes only overexpressed in melanoma cell lines: ACP5, CITED1, CPN1, DSTYK, GAB2, GNPTAB, GPNMB, GYPC, LYST, LZTS1, MITF, RXRG, S100A1, SNX10, ST6GAL1, ALX1, CAPN3, GAS7, MXI1, and SOX10 (data not shown). The dataset of the Cancer Cell Line Encyclopedia (CCLE, GSE36133) consortium was collected and used as external validation of the signature (data not shown). The CCLE gene expression also allowed the levels of HVEM and MITF expression to be assessed across various cellular types. Finally, the expression dataset from the SKCM project of TCGA consortium was collected to validate the signature in human samples of melanoma. The RNA-seq dataset (dataset ID: TCGA_SKCM_exp_HiSeqV2; version: 2015-02-24) was retrieved from the UCSC genome browser. In this dataset, gene-level transcription levels are estimated as RSEM normalized counts. The RSEM counts were log2 transformed and median centered, but not standardized, in order to retain a value similar to qRT-PCR cycles. Patient sample characteristics were downloaded from the UCSC genome browser. Methods and preprocessing are described at TCGA and UCSC websites.
Analysis of somatic mutations
Analysis for the presence of mutations in exon 15 of BRAF (codon 600), exons 11, 13, and 17 of KIT, and exons 2 and 3 of NRAS was performed as routine in the “Plateforme of Génétique Moléculaire des Cancers” in the Assistance Publique–Hôpitaux de Marseille. DNA extracted from FFPE specimens was analyzed by a sequence of PCR–high-resolution melting (PCR-HRM) followed by Sanger sequencing.
Small interfering RNA silencing of the MITF gene
MEL501, MeWo, and SKMEL28 melanoma cell lines or C.09.10 and C.10.01 short-term cultures isolated from lymph node metastases (all patients provided informed consent and this study was conducted with the formal approval of the local human subject committee) were transfected with siRNA using Lipofectamine® RNAiMAX (Invitrogen), according to the manufacturer’s recommendations. siMITF1 (GGUGAAUCGGAUCAUCAAG), siMITF2 (AGCAGUACCUUUCUACCAC), si Ctl (UUCUCCGAACGUGUCACGU).
Western blots
Cells (WM3912, SKMEL-28) were grown in Dulbecco’s modified Eagle’s medium (Invitrogen, Carlsbad, CA, USA) supplemented with 7% FCS and penicillin/streptomycin (100 U/ml/50 μg/ml) at 37°C and 5% CO2. Cells were transfected with siRNA against MITF as previously described.39 Briefly, cells at 50% confluency were transfected with 50 nM of siRNA using LipofectamineTM RNAiMAX in Opti-MEM medium (Invitrogen). Forty-eight hours later, cells were solubilized for 10 minutes at 4°C, in EDTA-free buffer containing 50 mM Tris pH 8, 150 mM NaCl, 1% Triton X-100, and protease inhibitors. Thirty micrograms of proteins were separated by electrophoresis by SDS–polyacrylamide gel electrophoresis and transferred onto a polyvinylidene difluoride membrane (Immobilon, Millipore). The membrane was saturated for 1 h at 25°C in 10 mM Tris HCl, pH 7.4, 150 mM NaCl, 1 mM EDTA, 0.1% Tween 20, 3% bovine serum albumin (weight/volume), and 5% gelatin (weight/volume). Primary antibodies (1/250) were incubated overnight at 4°C (MITF antibody, 12039, Abcam; HVEM antibody, 318802, Biolegend). After three washes of 5 minutes in 10 mM Tris pH 7.4, 150 mM NaCl, 1% Triton X-100, the secondary antibody coupled with horse radish peroxidase (Dakopatts) was then incubated for 1 h at room temperature. After three additional washes, proteins of interest were revealed by ECL (Amersham) using ImageQuant LAS-4000 Fujifilm (GE healthcare).
Statistical analysis
Statistical analyses were performed using GraphPad Prism v7 and in R 3.3.3 using the ComplexHeatmap package. Survival curves were calculated using the Kaplan–Meier method to estimate the probability of survival and significance was assessed by the log-rank test. Multivariate analysis was performed using the Cox proportional hazard model. A two-tailed paired t-test was used for comparison between control and target siRNA. A p-value <0.05 was considered to be statistically significant and p-values were computed using two-tailed tests by default.
Results
HVEM is expressed at the surface of most melanoma cell metastases, whereas its ligands are not
We first evaluated HVEM expression using IHC in 116 samples. HVEM staining was readily observed at the cell membrane and/or the cytoplasm of melanoma cells in 114 out of the 116 (98.3%) analyzed metastases (Figure 1(a,b)). HVEM expression occurred regardless of the site of origin of the melanoma metastases (Figure 1(c)) and 25% of the samples displayed intraspecimen heterogeneous levels of HVEM expression (data not shown). Flow cytometry analysis of cell suspensions prepared from fresh melanoma metastases also demonstrated the broad expression of HVEM at melanoma cell surfaces. All the fresh samples expressed HVEM at the cell surface, with 9–92% (median, 43%) of melanoma cells staining positive (Figure 2(a)). In contrast, melanoma cells in the analyzed metastases did not express BTLA, LIGHT, or CD160.
Figure 2.
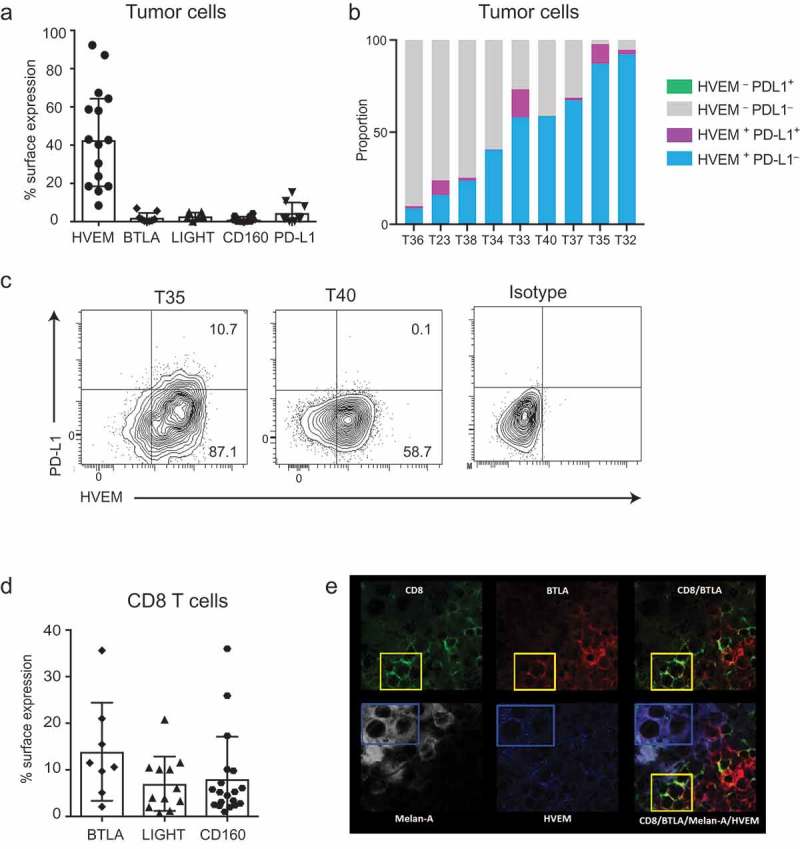
HVEM is expressed at the surface of melanoma cells and shows a coincident expression pattern with BTLA expressed by CD8+ TILs.
(a) Fresh melanoma metastases were analyzed by flow cytometry and the percentage of melanoma cells expressing HVEM, BTLA, LIGHT, CD160, and PD-L1 is shown. Respectively for each parameter, 15, 9, 6, 12, and 9 melanoma metastases were analyzed and the median with 95% IC is shown. (b) Each stacked bar plot represents a tumor sample for which the melanoma cell surface expression of HVEM and PD-L1 had been analyzed. 8.5–92.3% of cells were HVEM+PD-L1−, 0.1–15.3% HVEM+PD-L1+, while 0% were HVEM−PD-L1+. (c) Two representative examples of melanoma metastases analyzed for HVEM and PD-L1 co-expression and isotype controls are shown. In the example shown on the left panel, the few PD-L1+ cells were all HVEM+, whereas the majority of cells were HVEM+PD-L1–. In the example shown in the right panel, all the melanoma cells were HVEM+PD-L1–. (d) The TILs found in fresh melanoma metastases were analyzed by flow cytometry and the percentage of CD8+ TILs expressing BTLA, LIGHT, and CD160 is shown. Eight, 12, and 19 melanoma metastases were respectively analyzed and the median with 95% IC is shown. (e) A frozen section of a melanoma sample was stained for CD8 (green), BTLA (red), Melan-A (white), and HVEM (blue). The yellow box shows CD8+BTLA+ double-stained cells. The blue box shows Melan-A+HVEM+ cells. The merged image showing quadruple staining highlights the vicinity of CD8+BTLA+ cells and Melan-A+HVEM+ cells.
HVEM is more widely expressed than PD-L1 in melanoma cells with a mutually exclusive or coincident expression pattern
Next, we compared HVEM expression to PD-L1 expression and determined whether HVEM and PD-L1 showed a coincident or mutually exclusive pattern of expression on melanoma cells. Flow cytometry revealed a median expression of PD-L1 of 1.6% (range, 0.2–15.3%) (Figure 2(a)); expression in three out of nine samples was >5%. As illustrated in Figures 2(b,c) across the nine samples, all PD-L1+ melanoma cells co-expressed HVEM, accounting for 0.1–15.3% of total melanoma cells per sample. More interestingly, 8.5–92.3% of melanoma cells were HVEM+ and PD-L1−.
Since flow cytometry is not a common way of assessing PD-L1 levels, we performed PD-L1 IHC on 68/79 TMA cohort samples using a 5% cutoff. Interestingly, among the 55% of PD-L1− samples, 47% showed high levels of HVEM expression (Supplementary Figure S3a); 41% of PD-L1+ samples also exhibited high HVEM levels. HVEM and PD-L1 complementary patterns are illustrated in a HVEM-high and PD-L1+ metastasis (Supplementary Figure S3b).
Given that HVEM was largely expressed by melanoma metastases, we next evaluated the expression of HVEM ligands in the tumor microenvironment.
Expression of BTLA, LIGHT, and CD160 on tils found in melanoma metastases is variable
Flow cytometry analysis of CD8+ TILs found in melanoma metastases showed that 2.1–35.6% (median, 11.1%) of CD8+ TILS expressed BTLA on their surface (Figure 2(d)). Likewise, 12.6–61.5% (median, 34.6%) of CD4+ TILs were BTLA+ (data not shown). Analysis revealed LIGHT expression on an average of 5.1% (range, 0.7–20.8%) CD8+ TILs and 8.8% (range, 0.9–31.7%) of CD4+ TILs. CD160 was expressed on 5.2% (range, 1–36%) of CD8+ TILs and 2.3% (range, 0.1–21.6%) of CD4+ TILs (Figure 2(d)). The high and sporadic expression observed for BTLA, LIGHT, and CD160 on TILs was neither linked to the location of metastases nor to the treatment received by the patients prior to melanoma sampling.
HVEM+ melanoma cells are found contiguous to BTLA+ TILs
Sections of melanoma metastases were analyzed by multispectral immunofluorescence imaging to determine whether HVEM and BTLA showed coincident expression at the interface between melanoma cells and CD8+ TILs, respectively. As shown in Figure 2(e), co-immunofluorescence studies performed on metastases from five patients showed that HVEM+ melanoma cells were found in contiguity with BTLA+ CD8+ T cells, suggesting that HVEM on melanoma cells can engage BTLA expressed on the TILs present in the metastases.
Higher HVEM expression is associated with a significantly poorer prognosis
Using the patient cohort subjected to IHC analysis, we looked for a link between magnitude of HVEM expression by melanoma metastases and overall survival. We divided the cohort into two groups of similar sizes, using the median expression of HVEM: low HVEM expression (score 0–5; 52.6% of patients), and high HVEM expression (expression score 6–12; 47.4% of patients) groups, respectively. The cutoff was not optimized. We observed a similar distribution of known prognostic markers in melanoma (AJCC stage, number of metastatic sites, presence of brain metastasis, presence of liver metastasis, and treatment received) in the high and low HVEM expression groups (Table 1). Unfortunately, lactate dehydrogenase levels were not assessed before surgery between 2009 and 2012 in our departments. Patients with a HVEM score >5 had a significantly poorer overall survival than those with a score ≤5 (p = .0160), translating into median survival of 37.3 and 67.7 months, respectively (Figure 3(a)). Supplementary Figure S4 displays the univariate analysis of each prognostic marker. Multivariate analysis (Figure 3(a)) showed that HVEM status was an independent prognostic marker (p = .0158). The finding that a high HVEM expression score correlated with a poor prognosis also held true when survival was assessed from the date of sampling (p = .0254) (Supplementary Figure S5). It is important to note that only one patient (in the high HVEM group) had a non-melanoma-related death.
Figure 3.
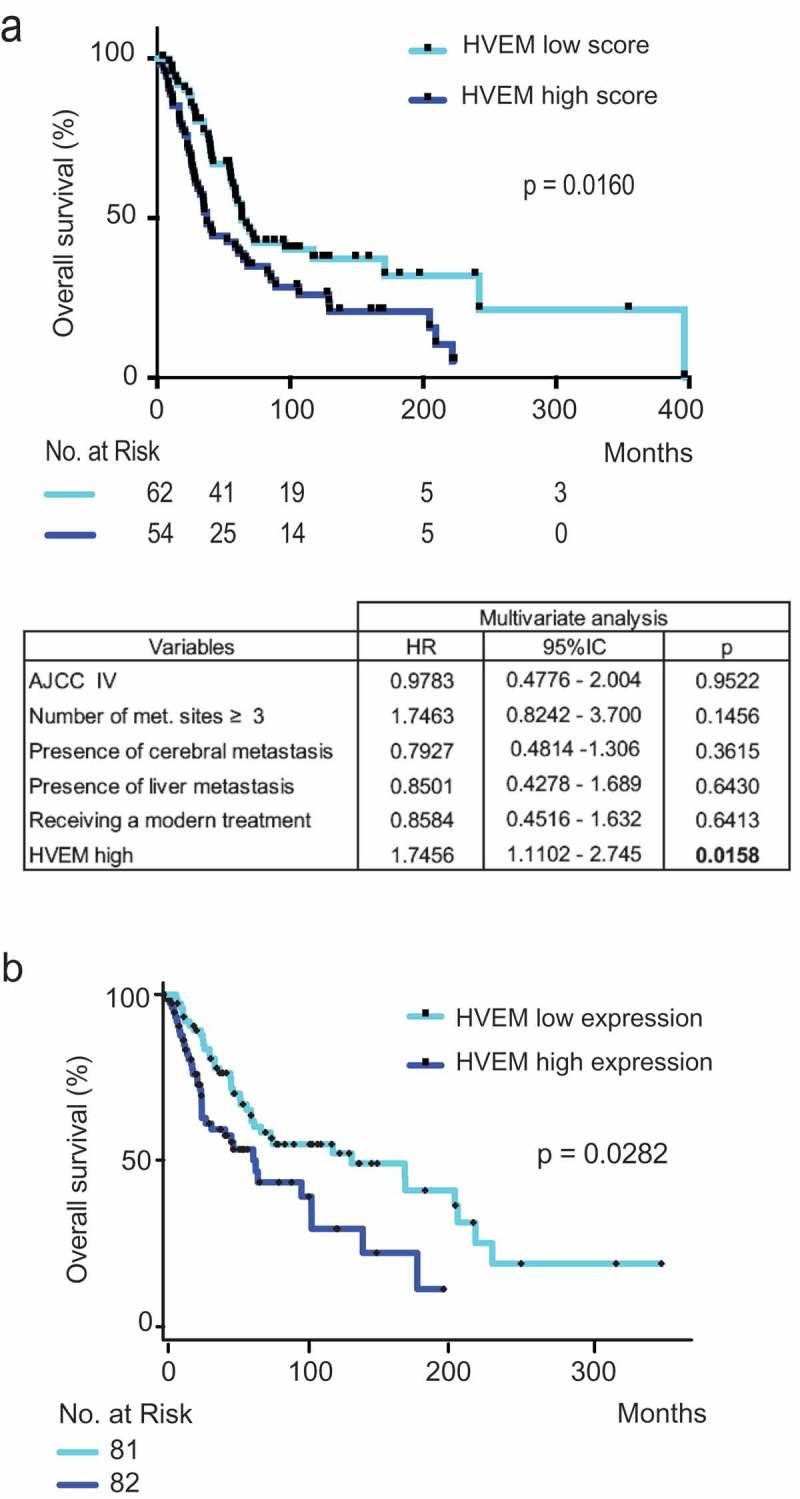
Patients with high levels of HVEM expression on tumor cells from melanoma metastases have a significantly poorer prognosis. HVEM expression was analyzed by immunohistochemistry on melanoma metastases from 116 patients (a) and by transcriptomics (b).
(a) Patients were divided in two groups: a group with low expression of HVEM (0–5 HVEM score) and a group with high expression of HVEM (6–12 HVEM score). The correlation with overall survival was determined. Low HVEM expression was associated with a significantly better overall survival (p = .0124). The table represents multivariate analysis of factors associated with overall survival. Data were obtained from the Cox proportional hazard model. Modern treatment refers to either targeted therapies or immune checkpoint blockade (no patient received any oncolytic virus in this study). (b) Transcriptomic data from the skin cutaneous melanoma dataset of The Cancer Genome Atlas (TCGA) showed that high HVEM expression was significantly associated with a lower median overall survival (p = .0282, PROGgeneV2 website). Median gene expression was used as a bifurcating point.
The generality of the finding based on our cohort of 116 patients was further validated using the SKCM cohort of TCGA. By analyzing this cohort, for which transcriptomics was used to assess the levels of HVEM expression, we also found that patients with high levels of HVEM expression in melanoma metastases had a significantly poorer overall survival than those with low levels (p = .0282) (Figure 3(b)). Therefore, considering that HVEM expressed by melanoma cells can interact with BTLA expressed by TILs (Figure 2(d)) and that high HVEM expression levels are a marker of poor prognosis in melanoma (Figure 3(a–b)), it is likely that HVEM contributes to melanoma escape from T cell immune responses.
Genes co-expressed with HVEM are associated with aggressive features in melanoma
To better understand the mechanisms controlling HVEM expression and compare them to those controlling PD-L1 expression, we analyzed publicly available expression databases. Using unsupervised hierarchical clustering analysis, we defined and validated a “HVEM signature” (Figure 4(a) and Material and Methods). It comprised 20 genes whose expression was co-regulated with HVEM (TNFRSF14) expression in different melanoma datasets and was melanoma specific (data not shown).
Figure 4.
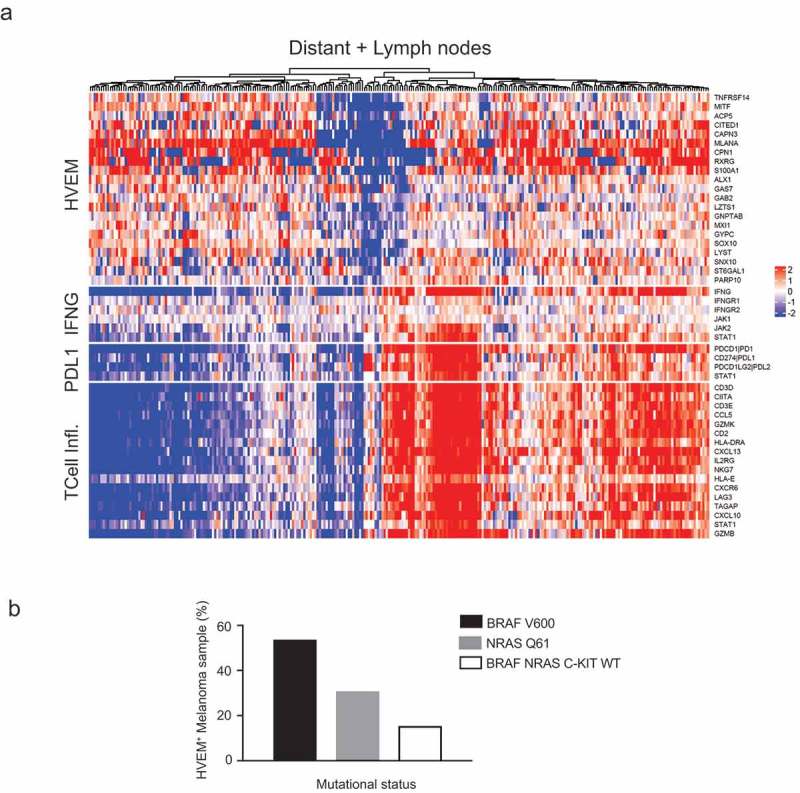
The genes co-expressed with HVEM are distinct from those associated with a T cell-inflamed signature and correspond to genes involved in melanoma aggressiveness.
(a) Unsupervised hierarchical clustering of the TCGA skin cutaneous melanoma dataset identified genes whose expression is co-regulated with HVEM (TNFRSF14) expression. This allowed definition of an “HVEM signature” (see top of heatmap) that comprises genes involved in melanoma proliferation and aggressiveness. This analysis also demonstrated that HVEM neither correlates with an IFNγ signature as PD-L1 does, nor links to a T cell-inflamed pattern (see T Cell Infl at bottom of heatmap). Gene expressions were log2 transformed and median centered. (b) HVEM expression is not linked to BRAF, NRAS, or c-KIT mutational status in melanoma metastases. Analysis of BRAF, NRAS, and c-KIT hotspot mutations among 13 melanoma samples identified by flow cytometry as HVEM+ found expected percentages of samples with BRAF V600 mutations, NRAS Q61 mutations, and wild-type BRAF, NRAS, and c-KIT.
This HVEM signature is essentially a mixture of genes involved in melanoma proliferation (MITF, CAPN3, MLANA, GNPTAB, CPN1, SOX10, and GYPC40,41) and of genes involved in invasive melanoma features (CITED1, 42 ACP5, 43 LZTS1, 44 GAB2, 45 SNX10, 46 and RXRG26,36); among these, it is interesting to note that targeting RXR signaling may delay relapse in melanoma47 and that the MXI1 hypoxia responsive48 gene is a putative tumor suppressor gene involved in melanoma progression.35
Among the remaining genes, GAS7, ALX1, and S100AI were reported in the Rambow melanoma signature, 41 but their respective role(s) in melanocyte lineage biology is unclear. ST6GAL1 expression was identified as being downregulated in a signature of anti-CTLA-4-induced treatment autoimmunity49 and upregulated in colorectal cancer tumorigenesis.50 LYST, associated with pigmentation-specific processes,51 has been previously reported to be involved in melanoma biology, whereas the PARP10 gene is involved in cancer biology.32 Therefore, the HVEM signature correlates with aggressive melanoma features underlined by different mechanisms.
Among the 20 genes constituting the HVEM signature, the gene whose expression most strongly co-regulated with HVEM was MITF, a gene well known for its role as a “master melanocyte transcription factor” in melanoma. Interestingly, six genes from the HVEM signature have links to MITF biology. For instance, SOX10 is a transcriptional activator of MITF, and ACP5, GNPTAB, MLANA, CAPN3, and LYST have all been reported to be targets of MITF.51 Therefore, the HVEM signature revealed that HVEM is co-regulated with genes involved in proliferative and invasive phenotypes in melanoma, among which is MITF, essential for melanocyte biology.
HVEM and MITF expression correlate strongly in melanoma
As documented in Figure 4(a), Figure 5(a), and Figure 5(b), HVEM expression in melanoma correlates strongly with MITF expression. In contrast to HVEM, the role of MITF in melanoma has been studied thoroughly. MITF regulates genes essential for melanocyte development, function, survival, and senescence.52
Figure 5.
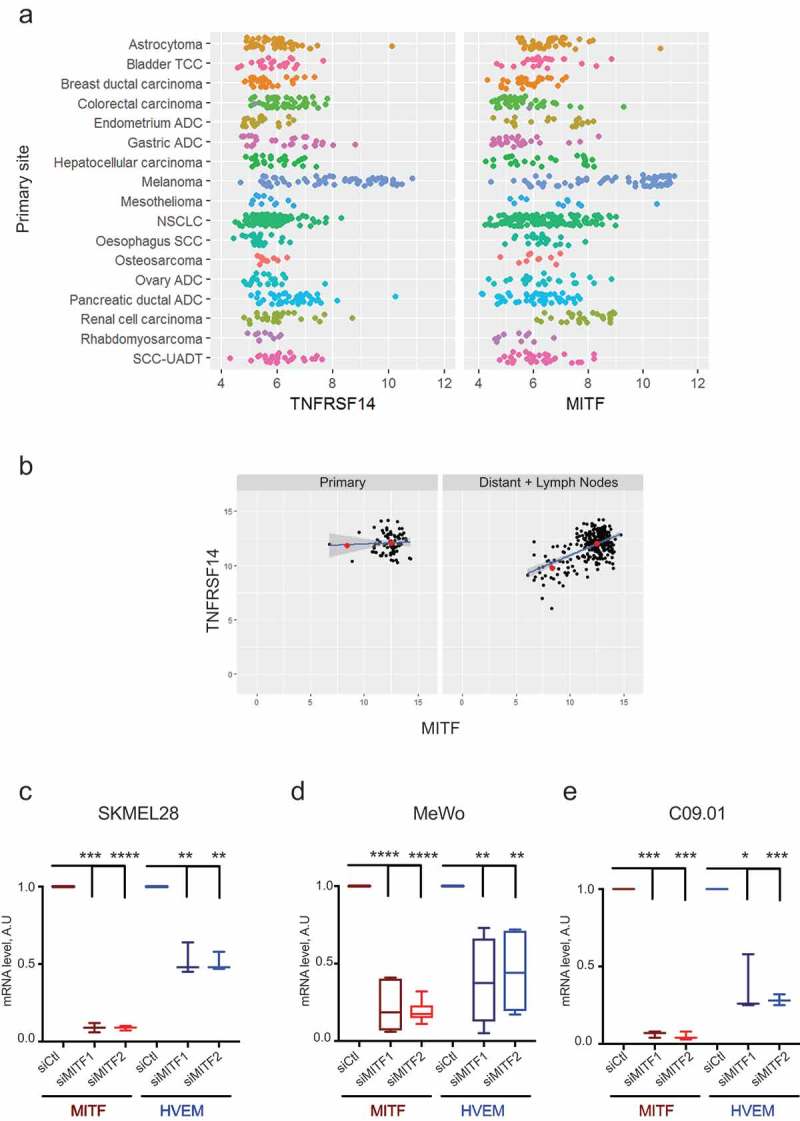
Expression of HVEM and microphthalmia-associated transcription factor (MITF) correlate strongly.
(a) The strong correlation existing in the range of expression of HVEM (TNFRSF14) and MITF is specific to skin melanoma compared to other cancer cell lines of the Cancer Cell Line Encyclopedia (CCLE). (b) HVEM and MITF strongly correlated at the metastatic (distant + lymph node) stage on TCGA data (p = 2.282e-13) and not at the primary stage (p = .7703). The red dots represent the mean of MITF-low and MITF-high groups. The SEM for the MITF-low group and MITF-high group was 0.4473 and 0.0114, respectively, at the primary stage, and 0.0339 and 0.0041 at the metastatic stage, respectively. (c, d, e) Two melanoma cell lines, SKMEL28 and MeWo, and one short-term culture isolated from patient (C.09.10) were transfected with control siRNA (siCtl) or two different MITF siRNAs (siMITF1, siMITF2). MITF and HVEM expression was quantified by qPCR. Results are mean±SD of two experiments carried out in triplicate for MeWo, and one experiment carried out in triplicate for SKMEL28 and C.09.10. A two-tailed paired t-test was used for comparison between control and target siRNA (*: p < .05, **: p < .01, ***: p < .001, ****: p < .0001)ADC: Adenocarcinoma, NSCLC: Non-Small Cell Lung Carcinoma, SCC: Squamous Cell Carcinoma, TCC: Transitional Cell Carcinoma, UADT: Upper-aero-digestive tract.
Using TCGA data, we found a strong correlation between MITF and HVEM expression at the metastatic stage (p = 2.282e-13) (Figure 5(b)) but a non-significant correlation at the primary stage (p = .7703), presumably due to a late role for HVEM in melanoma progression. The strong dynamics of correlation noted for expression of HVEM (TNFRSF14) and MITF at the metastatic stage of melanoma was specific for melanoma compared to other cancer (Figure 5(a)). There are recent mechanistic data supporting such correlations. For instance, a two-step DNA microarray-based approach showed that HVEM expression was regulated via MITF51 and analysis of ChIP-Seq data extracted from Sturb et al.53 identified binding of MITF in the promoter region of the TNFRSF14 gene via two E-Box motifs (data not shown). Moreover, using siRNA-based gene silencing in the MEL 501 melanoma cell line, the SKMEL28 cell line, and three cell lines obtained from patients, we formally established that MITF downregulation resulted in a significant decrease in HVEM mRNA (Figure 5(c–e) and Supplementary Figure S6a). Western blot validated siRNA efficiency (Supplementary Figure S6b). Therefore, the correlation we observed between HVEM and MITF in melanoma can be mechanistically accounted for by the fact that MITF controls HVEM expression.
HVEM expression differs from that of PD-L1 and is neither correlated with an IFNγ signature, nor linked to known somatic mutations in melanoma
As the PD-1/PD-L1 co-inhibitory pathway is induced by IFNγ, we analyzed whether HVEM expression was also subjected to regulation by IFN. Hierarchical clustering SKCM/TCGA analysis (Figure 4(a)) revealed an absence of correlation between HVEM (TNFRSF14) gene expression and an IFNγ signature, contrasting with the positive correlation observed between the PD-L1 and T cell-inflamed signatures.54 Next, using the melanoma metastases identified as HVEM+ by flow cytometry (Figure 4(b)), we studied the distribution of hotspot mutations of the oncogenes BRAF and NRAS. We found that 53.8% of HVEM+ samples contained BRAF V600 mutations, 30.8% of the samples contained NRAS Q61 mutations, and the remaining 15.4% showed wild-type forms of BRAF, NRAS, and c-KIT. These rates correspond to the expected percentages of activating mutations in metastatic melanoma, 23 confirming that HVEM is neither inducible by IFNγγnor linked to BRAF, NRAS, or c-KIT mutations in melanoma.
Discussion
Immunotherapy strategies based on the blockade of co-inhibitory molecules aim to boost host immune responses against tumors and circumvent tumor evasion. In that context, blockade of the HVEM/BTLA pathway could be of therapeutic value in melanoma due to its complementarity to PD-1/PD-L1 blockade, as demonstrated in vitro10 and in mouse models.11 Therefore, to provide a rationale for these observations, it was important to determine whether high levels of HVEM expression were found in melanoma metastases and associated with a poor clinical outcome, and to understand better the mechanisms controlling HVEM expression on melanoma cells.
Accordingly, we confirmed that HVEM was expressed by melanoma metastases, in 98.3% of the 116 specimens analyzed by IHC and 100% of the fresh samples analyzed by flow cytometry. Our data are thus consistent with a previous study by Derré and colleagues that showed HVEM expression by 26 of the 40 melanoma cell lines analyzed and 12 of the 16 paraffin-embedded metastases studied.9 Importantly, to avoid biased interpretation due to the presence of melanin, we used a red staining for IHC. Flow cytometry analysis identified BTLA expression at the surface of CD4+ and CD8+ TILs present in fresh melanoma samples. A total of 11.1% (range, 2.1–35.6%) of CD8+ TILs expressed BTLA, a value lower than previously reported by Derré et al..9 Like PD-1, the expression of BTLA even low is sufficient to provide inhibition of CD8 directed against NY-ESO-110 or directed against minor histocompatibilty antigen.55 In fact in these two papers the function of both PD-1 and BTLA was investigated and demonstrated to be effective even with low expression levels. In addition co-immunofluorescence demonstrated a coincident expression between HVEM broadly expressed at the surface of melanoma cells and BTLA expressed by TILs. An additional information that we have to keep in mind is that BTLA is also present on CD4+ melanoma TILS (data not shown) and might also be targeted. This would increase the number of immune effectors affected.
We also showed that metastatic melanoma patients with a high HVEM expression had a significantly poorer overall survival than those with a low expression and the analysis of TCGA data further supported the results obtained with our 116 patients. These findings are congruent with prior results obtained in seven other solid tumors (esophageal squamous cell carcinoma, 12 colorectal cancer, 13 hepatocellular carcinoma, 14 breast cancer, 15 ovarian serous adenocarcinoma, 16 clear renal cell carcinoma17 and glioblastoma18), suggesting a role for HVEM in tumor progression.
Using flow cytometry to compare HVEM and PD-L1 expression at the surface of melanoma cells, we found that HVEM had a broader expression (median, 43%; range, 9–92%) than PD-L1 (median, 1.6%; range, 0.2–15.3%). Because no data assessing PD-L1 in fresh melanoma samples by flow cytometry were available for an external validation of our results, we used IHC. As published recently in lung, 28 we used different scoring systems for HVEM and PD-L1 to take into account the diffuse pattern of HVEM inside each tumor cell (PD-L1 is mostly expressed at the interface between tumor and lymphocytes). In our cohort, 55% of samples were PD-L1+, in agreement with the 33–83% of samples reported to be PD-L1+ in recently published clinical trials with stage III and IV patients.24,33 HVEM and PD-L1 complementary patterns were also noted at a microscopic scale by IHC: PD-L1− neoplastic melanocytes harbored HVEM, suggesting that HVEM could represent a complementary or even, in some situations, an alternative therapeutic target to PD-1/PD-L1.
Considering that BTLA is evolutionary related to PD-1, 30 BTLA can likely substitute for PD-1 in conditions in which immune-checkpoint inhibitors target PD-1, by taking over and performing the exact same co-inhibitory function. A recent study31 using human T cells and quantitative interactomics provided a mechanistic proof for the functional redundancy existing between BTLA and PD-1 coinhibitors and suggested that combination therapy using anti-BTLA and anti-PD-1 may be of clinical interest. A recent study performed in mouse29 supports the view that engagement of the BTLA pathway is likely to mask the phenotypic consequences of blocking the PD-1 pathway, and illustrates that coadministration of PD-1 and BTLA antibodies augment the therapeutic benefit of PD-1 blockade.
Furthermore, in contrast to PD-L1 expression, HVEM expression correlated with genes independent of the PD-L1, T cell-inflamed, and IFNγ signatures, and BTLA upregulation occurs independently of functional exhaustion of T cells driven by antigen load.10
Interestingly, we found that HVEM belongs to a constitutionally aggressive subgroup of co-regulated genes involved in melanoma proliferation and invasion, which is a first for an immune gene. This feature, as well as the correlation with MITF expression, appears melanoma specific, as it was not found in other malignancies with known HVEM links. Given that these correlations were not significant at the initial tumor stage (i.e., in primary skin melanoma), it may constitute a late phenomenon in melanoma progression.
Besides, numerous data have been gathered25,34 indicating that hypoxia dampens immune response in tumors. MITF, that was demonstrated in this study to control HVEM expression, was also reported to be negatively regulated by hypoxia.27,39 Therefore, we can expect to observed a decrease in HVEM level in hypoxic tumors or region However, in our IHC we did not observed a clear increase in HVEM around vessel, suggesting that HVEM expression is not only regulated by MITF. It should be also noted that the interplay between MITF and HIF1A is rather complex. Indeed, upon hypoxia, HIF1A increase leads to an inhibition of MITF expression. However, MITF was also reported to increase HIF1A expression.56 Therefore, the correlation between HIF1A, MITF and its targets cannot be simply linear.
Published data suggest that manipulating the HVEM/BTLA co-inhibitory axis is of translational value in tumor immunotherapy, via different techniques: monoclonal antibodies10,11 targeting HVEM/BTLA axis, or alternatively, a small HVEM peptide corresponding to residues 23–39 blocking BTLA interaction with HVEM in vitro.22 By delivering a vaccine comprising a eukaryotic expression plasmid that expressed the extracellular domain of mouse BTLA and a HSP, it was possible to induce an antitumor effect in TC-1 mouse model of cervical cancer. In addition, a vaccine expressing the HPV-16 E7 protein fused to herpes simplex virus glycoprotein D (an antagonist of BTLA) and CD160 induced a more sustained regression of large HPV-16 E7 thyroid adenocarcinoma tumor masses compared to a vaccine expressing E7 alone.57 Our present study also suggests an additional and arguably less specific possibility of blocking the HVEM/BTLA axis by targeting MITF.
In conclusion, our study provides new information on the role of the HVEM/BTLA co-inhibitory pathway in melanoma. We showed that the percentages of HVEM+ melanoma cells is variable in different patients. Importantly, HVEM+ melanoma cells were found in contiguity with BTLA+ CD8+ TILs, suggesting that the HVEM/BTLA axis is likely functional in melanoma. We also established a significant correlation between high HVEM expression in melanoma metastases, and poor clinical outcomes. Finally, analysis of the mechanisms regulating HVEM expression in melanoma revealed that, in contrast to PD-L1, HVEM expression did not correlate with an IFNγ signature and strongly correlated with MITF expression. Altogether, these data make HVEM and BTLA promising targets for antibody-mediated ‘checkpoint blockade’ therapy in melanoma.
Funding Statement
D.O.’s team was supported by the grant “Equipe FRM DEQ20180339209”. D.O. is Senior Scholar of the Institut Universitaire de France. Financial support was also provided by ITMO Cancer AVIESAN (Alliance Nationale pour les Sciences de la Vie et de la Santé/National Alliance for Life Sciences & Health) within the framework of the Cancer Plan and Vaincre le Mélanome.
Acknowledgments
The authors wish to acknowledge all patients and families affected by melanoma for their contribution. The authors appreciate the dedicated melanoma team at La Timone, hospital, APHM, who provided all the fresh melanoma specimens for this study. We acknowledge Fred Frasinetti, Isabelle Lepizerra, Orianne Albert, and Agnès Marfia for their excellent technical work. We thank the cytometry facility (CRCM-INSERM U1068, Marseille) and IBISA Cancer Immunomonitoring facility (Paoli Calmettes Institut, Marseille) for their help. We thank the APHM Tumor Bank (authorization number: AC2018-31053; CRB BB-0033-00097) for providing TMA samples and the CRB Collection (RECH/P271) of the University Hospital of Montpellier – France.
Authors’ Contributions
Conception and design: Nausicaa Malissen, Daniel Olive, Christine Pasero, Caroline Gaudy, and Nicolas Macagno
Development of methodology: Nausicaa Malissen, Daniel Olive, Christine Pasero, Nicolas Macagno, Samuel Granjeaud, Clémence Granier, Eric Tartour, Nadia Habel, and Robert Ballotti
Acquisition of data (e.g., provided animals, acquired and managed patients, provided facilities): Nausicaa Malissen, Nicolas Macagno, Clémence Granier, Vincent Moutardier, Caroline Gaudy, Nadia Habel, Marion Mandavit, Bernard Guillot, Christine Pasero, Eric Tartour, Robert Ballotti, Jean-Jacques Grob, and Daniel Olive
Analysis and interpretation of data (e.g., statistical analysis, biostatistics, computational analysis): Nausicaa Malissen, Nicolas Macagno, Samuel Granjeaud, Clémence Granier, Eric Tartour, Robert Ballotti, Jean-Jacques Grob, and Daniel Olive
Writing, review, and/or revision of the manuscript: Nausicaa Malissen, Nicolas Macagno, Samuel Granjeaud, Clémence Granier, Caroline Gaudy, Eric Tartour, Robert Ballotti, Jean-Jacques Grob, and Daniel Olive
Administrative, technical, or material support (e.g., reporting or organizing data, constructing databases): Nausicaa Malissen and Nicolas Macagno
Study supervision: Nausicaa Malissen, Daniel Olive, and Jean-Jacques Grob
COI statement
DO is cofounder and a shareholder of Imcheck Therapeutics. CP is now an employee of Imcheck Therapeutics. No potential conflicts of interest were disclosed by the other authors.
Supplementary material
Supplemental data for this article can be accessed on the publisher’s website.
References
- 1.Maio M, Grob -J-J, Aamdal S, Bondarenko I, Robert C, Thomas L, Garbe C, Chiarion-Sileni V, Testori A, Chen TT, et al. Five-year survival rates for treatment-naive patients with advanced melanoma who received ipilimumab plus dacarbazine in a phase III trial. J Clin Oncol Off J Am Soc Clin Oncol. 2015. April 1;33(10):1–14. doi: 10.1200/JCO.2014.56.6018. [DOI] [PMC free article] [PubMed] [Google Scholar]
- 2.Schachter J, Ribas A, Long GV, et al. Pembrolizumab versus ipilimumab for advanced melanoma: final overall survival results of a multicentre, randomised, open-label phase 3 study (KEYNOTE-006)1. Lancet Lond Engl. 2017. August 16;390:1853–1862. doi: 10.1016/S0140-6736(17)31601-X. [DOI] [PubMed] [Google Scholar]
- 3.Wolchok JD, Chiarion-Sileni V, Gonzalez R, et al. Overall survival with combined Nivolumab and ipilimumab in advanced melanoma. N Engl J Med. 2017. 05;377(14):1345–1356. doi: 10.1056/NEJMoa1709684. [DOI] [PMC free article] [PubMed] [Google Scholar]
- 4.Cai G, Freeman GJ.. The CD160, BTLA, LIGHT/HVEM pathway: a bidirectional switch regulating T-cell activation. Immunol Rev. 2009. May;229(1):244–258. doi: 10.1111/imr.2009.229.issue-1. [DOI] [PubMed] [Google Scholar]
- 5.Wang Y, Subudhi SK, Anders RA, Lo J, Sun Y, Blink S, Wang Y, Wang J, Liu X, Mink K, et al. The role of herpesvirus entry mediator as a negative regulator of T cell-mediated responses. J Clin Invest. 2005. March;115(3):711–717. doi: 10.1172/JCI200522982. [DOI] [PMC free article] [PubMed] [Google Scholar]
- 6.Duhen T, Pasero C, Mallet F, Barbarat B, Olive D, Costello RT.. LIGHT costimulates CD40 triggering and induces immunoglobulin secretion; a novel key partner in T cell-dependent B cell terminal differentiation. Eur J Immunol. 2004. December;34(12):3534–3541. doi: 10.1002/eji.200324241. [DOI] [PubMed] [Google Scholar]
- 7.Croft M. The evolving crosstalk between co-stimulatory and co-inhibitory receptors: HVEM-BTLA. Trends Immunol. 2005. June;26(6):292–294. doi: 10.1016/j.it.2005.03.010. [DOI] [PubMed] [Google Scholar]
- 8.Ritthipichai K, Haymaker C, Martinez-Paniagua M, Aschenbrenner A, Yi X, Zhang M, Kale C, Vence LM, Roszik J, Hailemichael Y, et al. Multifaceted role of BTLA in the control of CD8+ T cell fate after antigen encounter. Clin Cancer Res Off J Am Assoc Cancer Res. 2017. July 28;23:6151–6164. doi: 10.1158/1078-0432.CCR-16-1217. [DOI] [PMC free article] [PubMed] [Google Scholar]
- 9.Derré L, Rivals J-P, Jandus C, Pastor S, Rimoldi D, Romero P, Michielin O, Olive D, Speiser DE. BTLA mediates inhibition of human tumor-specific CD8+ T cells that can be partially reversed by vaccination. J Clin Invest. 2010. January;120(1):157–167. doi: 10.1172/JCI40070. [DOI] [PMC free article] [PubMed] [Google Scholar]
- 10.Fourcade J, Sun Z, Pagliano O, et al. CD8(+) T cells specific for tumor antigens can be rendered dysfunctional by the tumor microenvironment through upregulation of the inhibitory receptors BTLA and PD-1. Cancer Res. 2012. February 15;72(4):887–896. doi: 10.1158/0008-5472.CAN-11-2637. [DOI] [PMC free article] [PubMed] [Google Scholar]
- 11.Miselis NR, Linn D, Restaino C, et al. Abstract 577: antagonism of the co-inhibitory receptor BTLA enhances efficacy of anti-PD-1 treatment in murine syngeneic tumor models. Cancer Res. 2017. July 1;77(13 Supplement):577. [Google Scholar]
- 12.Migita K, Sho M, Shimada K, et al. Significant involvement of herpesvirus entry mediator in human esophageal squamous cell carcinoma. Cancer. 2014. March 15;120(6):808–817. doi: 10.1002/cncr.28491. [DOI] [PubMed] [Google Scholar]
- 13.Inoue T, Sho M, Yasuda S, et al. HVEM expression contributes to tumor progression and prognosis in human colorectal cancer. Anticancer Res. 2015. March, 35(3), 1361–1367. [PubMed] [Google Scholar]
- 14.Hokuto D, Sho M, Yamato I, et al. Clinical impact of herpesvirus entry mediator expression in human hepatocellular carcinoma. Eur J Cancer Oxf Engl 1990. 2015. January, 51(2), 157–165. [DOI] [PubMed] [Google Scholar]
- 15.Tsang JYS, Chan K-W, Ni Y-B, et al. Expression and clinical significance of Herpes Virus Entry Mediator (HVEM) in breast cancer. Ann Surg Oncol. 2017. June 13;24:4042–4050. doi: 10.1245/s10434-017-5924-1. [DOI] [PubMed] [Google Scholar]
- 16.Fang Y, Ye L, Zhang T, He Q-Z, Zhu J-L. High expression of herpesvirus entry mediator (HVEM) in ovarian serous adenocarcinoma tissue. J BUON Off J Balk Union Oncol. 2017. February;22(1):80–86. [PubMed] [Google Scholar]
- 17.Tang M, Cao X, Li Y, et al. High expression of herpes virus entry mediator is associated with poor prognosis in clear cell renal cell carcinoma. Am J Cancer Res. 2019;9(5):975–987. [PMC free article] [PubMed] [Google Scholar]
- 18.Han M-Z, Wang S, Zhao W-B, et al. Immune checkpoint molecule herpes virus entry mediator is overexpressed and associated with poor prognosis in human glioblastoma. EBioMedicine. 2019. May;43:159–170. doi: 10.1016/j.ebiom.2019.04.021. [DOI] [PMC free article] [PubMed] [Google Scholar]
- 19.Sideras K, Biermann K, Yap K, et al. Tumor cell expression of immune inhibitory molecules and tumor-infiltrating lymphocyte count predict cancer-specific survival in pancreatic and ampullary cancer. Int J Cancer. 2017. August 1;141(3):572–582. doi: 10.1002/ijc.30760. [DOI] [PubMed] [Google Scholar]
- 20.Zhu Y-D, Lu M-Y. Increased expression of TNFRSF14 indicates good prognosis and inhibits bladder cancer proliferation by promoting apoptosis. Mol Med Rep. 2018. September;18(3):3403–3410. [DOI] [PubMed] [Google Scholar]
- 21.Haymaker CL, Wu RC, Ritthipichai K, et al. BTLA marks a less-differentiated tumor-infiltrating lymphocyte subset in melanoma with enhanced survival properties. Oncoimmunology. Internet]. 2015. August [accessed 2016 December15];4(8). https://www-ncbi-nlm-nih-gov.gate2.inist.fr/pmc/articles/PMC4570103/ [DOI] [PMC free article] [PubMed] [Google Scholar]
- 22.Spodzieja M, Lach S, Iwaszkiewicz J, Cesson V, Kalejta K, Olive D, Michielin O, Speiser DE, Zoete V, Derré L, et al. Design of short peptides to block BTLA/HVEM interactions for promoting anticancer T-cell responses. PLoS One. 2017;12(6):e0179201. doi: 10.1371/journal.pone.0179201. [DOI] [PMC free article] [PubMed] [Google Scholar]
- 23.Lovly CM, Dahlman KB, Fohn LE, Su Z, Dias-Santagata D, Hicks DJ, Hucks D, Berry E, Terry C, Duke M, et al. Routine multiplex mutational profiling of melanomas enables enrollment in genotype-driven therapeutic trials. PLoS One. 2012;7(4):e35309. doi: 10.1371/journal.pone.0035309. [DOI] [PMC free article] [PubMed] [Google Scholar]
- 24.Weber J, Mandala M, Del Vecchio M, Gogas HJ, Arance AM, Cowey CL, Dalle S, Schenker M, Chiarion-Sileni V, Marquez-Rodas I, et al, Adjuvant Nivolumab versus ipilimumab in resected stage III or IV melanoma. N Engl J Med. 2017. 09;377(19):1824–1835. doi: 10.1056/NEJMoa1709030. [DOI] [PubMed] [Google Scholar]
- 25.Petrova V, Annicchiarico-Petruzzelli M, Melino G, Amelio I. The hypoxic tumour microenvironment. Oncogenesis. 2018. January 24;7(1):10. doi: 10.1038/s41389-017-0011-9. [DOI] [PMC free article] [PubMed] [Google Scholar]
- 26.Papi A, Rocchi P, Ferreri AM, Guerra F, Orlandi M. Enhanced effects of PPARgamma ligands and RXR selective retinoids in combination to inhibit migration and invasiveness in cancer cells. Oncol Rep. 2009. April;21(4):1083–1089. doi: 10.3892/or_00000371. [DOI] [PubMed] [Google Scholar]
- 27.Feige E, Yokoyama S, Levy C, Khaled M, Igras V, Lin RJ, Lee S, Widlund HR, Granter SR, Kung AL, et al. Hypoxia-induced transcriptional repression of the melanoma-associated oncogene MITF. Proc Natl Acad Sci U S A. 2011. October 25;108(43):E924–933. doi: 10.1073/pnas.1106351108. [DOI] [PMC free article] [PubMed] [Google Scholar]
- 28.Ren S, Tian Q, Amar N, Yu H, Rivard CJ, Caldwell C, Ng TL, Tu M, Liu Y, Gao D, et al. The immune checkpoint, HVEM may contribute to immune escape in non-small cell lung cancer lacking PD-L1 expression. Lung Cancer Amst Neth. 2018. November;125:115–120. doi: 10.1016/j.lungcan.2018.09.004. [DOI] [PubMed] [Google Scholar]
- 29.Ahrends T, Spanjaard A, Pilzecker B, Bąbała N, Bovens A, Xiao Y, Jacobs H, Borst J, CD4+ T cell help confers a cytotoxic T cell effector program including coinhibitory receptor downregulation and increased tissue invasiveness. Immunity. 2017. 21;47(5):848–861.e5. doi: 10.1016/j.immuni.2017.10.009. [DOI] [PubMed] [Google Scholar]
- 30.Riley JL. PD-1 signaling in primary T cells. Immunol Rev. 2009. May;229(1):114–125. doi: 10.1111/j.1600-065X.2009.00767.x. [DOI] [PMC free article] [PubMed] [Google Scholar]
- 31.Celis-Gutierrez J, Blattmann P, Zhai Y, Jarmuzynski N, Ruminski K, Grégoire C, Ounoughene Y, Fiore F, Aebersold R, Roncagalli R, et al. Quantitative interactomics in primary T cells provides a rationale for concomitant PD-1 and BTLA coinhibitor blockade in cancer immunotherapy. Cell Rep. 2019. June 11;27(11):3315–3330.e7. doi: 10.1016/j.celrep.2019.05.041. [DOI] [PMC free article] [PubMed] [Google Scholar]
- 32.Márton J, Fodor T, Nagy L, Vida A, Kis G, Brunyánszki A, Antal M, Lüscher B, Bai P, Tan M. PARP10 (ARTD10) modulates mitochondrial function. PLoS One. 2018;13(1):e0187789. doi: 10.1371/journal.pone.0187789. [DOI] [PMC free article] [PubMed] [Google Scholar]
- 33.Eggermont AMM, Blank CU, Mandala M, Long GV, Atkinson V, Dalle S, Poncin M, Rakesh A, Page A-L, Stoitsova S, et al, Adjuvant Pembrolizumab versus placebo in resected stage III melanoma. N Engl J Med. 2018. 10;378(19):1789–1801. doi: 10.1056/NEJMc1711583. [DOI] [PubMed] [Google Scholar]
- 34.Chouaib S, Noman MZ, Kosmatopoulos K, Curran MA, Hypoxic stress: obstacles and opportunities for innovative immunotherapy of cancer. Oncogene. 2017. 26;36(4):439–445. doi: 10.1038/onc.2016.225. [DOI] [PMC free article] [PubMed] [Google Scholar]
- 35.Ariyanayagam-Baksh SM, Baksh FK, Swalsky PA, Finkelstein SD. Loss of heterozygosity in the MXI1 gene is a frequent occurrence in melanoma. Mod Pathol Off J U S Can Acad Pathol Inc. 2003. October;16(10):992–995. [DOI] [PubMed] [Google Scholar]
- 36.Chakravarti N, Lotan R, Diwan AH, Warneke CL, Johnson MM, Prieto VG. Decreased expression of retinoid receptors in melanoma: entailment in tumorigenesis and prognosis. Clin Cancer Res Off J Am Assoc Cancer Res. 2007. August 15;13(16):4817–4824. doi: 10.1158/1078-0432.CCR-06-3026. [DOI] [PubMed] [Google Scholar]
- 37.Remmele W, Stegner HE. Recommendation for uniform definition of an immunoreactive score (IRS) for immunohistochemical estrogen receptor detection (ER-ICA) in breast cancer tissue. Pathol. 1987. May;8(3):138–140. [PubMed] [Google Scholar]
- 38.Goswami CP, Nakshatri H. PROGgeneV2: enhancements on the existing database. BMC Cancer. 2014. December 17;14:970. doi: 10.1186/1471-2407-14-970. [DOI] [PMC free article] [PubMed] [Google Scholar]
- 39.Cheli Y, Guiliano S, Botton T, et al. Mitf is the key molecular switch between mouse or human melanoma initiating cells and their differentiated progeny. Oncogene. 2011. May;30(20):2307–2318. doi: 10.1038/onc.2010.598. [DOI] [PubMed] [Google Scholar]
- 40.Jeffs AR, Glover AC, Slobbe LJ, et al. A gene expression signature of invasive potential in metastatic melanoma cells. PLoS One. 2009. December 24;4(12):e8461. doi: 10.1371/journal.pone.0008461. [DOI] [PMC free article] [PubMed] [Google Scholar]
- 41.Rambow F, Job B, Petit V, et al. New functional signatures for understanding melanoma biology from tumor cell lineage-specific analysis. Cell Rep. 2015. October 27;13(4):840–853. doi: 10.1016/j.celrep.2015.09.037. [DOI] [PMC free article] [PubMed] [Google Scholar]
- 42.Cantelli G, Orgaz JL, Rodriguez-Hernandez I, et al. TGF-β-induced transcription sustains amoeboid melanoma migration and dissemination. Curr Biol CB. 2015. November 16;25(22):2899–2914. doi: 10.1016/j.cub.2015.05.025. [DOI] [PMC free article] [PubMed] [Google Scholar]
- 43.Scott KL, Nogueira C, Heffernan TP, et al. Proinvasion metastasis drivers in early-stage melanoma are oncogenes. Cancer Cell. 2011. July 12;20(1):92–103. doi: 10.1016/j.ccr.2011.05.025. [DOI] [PMC free article] [PubMed] [Google Scholar]
- 44.Onken MD, Worley LA, Harbour JW. A metastasis modifier locus on human chromosome 8p in uveal melanoma identified by integrative genomic analysis. Clin Cancer Res Off J Am Assoc Cancer Res. 2008. June 15;14(12):3737–3745. doi: 10.1158/1078-0432.CCR-07-5144. [DOI] [PubMed] [Google Scholar]
- 45.Horst B, Gruvberger-Saal SK, Hopkins BD, et al. Gab2-mediated signaling promotes melanoma metastasis. Am J Pathol. 2009. April;174(4):1524–1533. doi: 10.2353/ajpath.2009.080543. [DOI] [PMC free article] [PubMed] [Google Scholar]
- 46.Kaushik A, Bhatia Y, Ali S, Gupta D. Gene network rewiring to study melanoma stage progression and elements essential for driving melanoma. PLoS One. 2015. November 11;10(11):e0142443. doi: 10.1371/journal.pone.0142443. [DOI] [PMC free article] [PubMed] [Google Scholar]
- 47.Rambow F, Rogiers A, Marin-Bejar O, Aibar S, Femel J, Dewaele M, Karras P, Brown D, Chang YH, Debiec-Rychter M, et al. Toward minimal residual disease-directed therapy in melanoma. Cell. 2018. August 9;174(4):843–855.e19. doi: 10.1016/j.cell.2018.06.025. [DOI] [PubMed] [Google Scholar]
- 48.Olbryt M, Habryka A, Tyszkiewicz T, Rusin A, Cichoń T, Jarząb M, Krawczyk Z. Melanoma-associated genes, MXI1, FN1, and NME1, are hypoxia responsive in murine and human melanoma cells. Melanoma Res. 2011. October;21(5):417–425. doi: 10.1097/CMR.0b013e328348db2f. [DOI] [PubMed] [Google Scholar]
- 49.Bresler SC, Min L, Rodig SJ, Walls AC, Xu S, Geng S, Hodi FS, Murphy GF, Lian CG. Gene expression profiling of anti-CTLA4-treated metastatic melanoma in patients with treatment-induced autoimmunity. Lab Investig J Tech Methods Pathol. 2017. February;97(2):207–216. doi: 10.1038/labinvest.2016.126. [DOI] [PubMed] [Google Scholar]
- 50.Swindall AF, Londoño-Joshi AI, Schultz MJ, Fineberg N, Buchsbaum DJ, Bellis SL. ST6Gal-I protein expression is upregulated in human epithelial tumors and correlates with stem cell markers in normal tissues and colon cancer cell lines. Cancer Res. 2013. April 1;73(7):2368–2378. doi: 10.1158/0008-5472.CAN-12-3424. [DOI] [PMC free article] [PubMed] [Google Scholar]
- 51.Hoek KS, Schlegel NC, Eichhoff OM, Widmer DS, Praetorius C, Einarsson SO, Valgeirsdottir S, Bergsteinsdottir K, Schepsky A, Dummer R, et al. Novel MITF targets identified using a two-step DNA microarray strategy. Pigment Cell Melanoma Res. 2008. December;21(6):665–676. doi: 10.1111/pcr.2008.21.issue-6. [DOI] [PubMed] [Google Scholar]
- 52.Hartman ML, Czyz M. MITF in melanoma: mechanisms behind its expression and activity. Cell Mol Life Sci. 2015. April;72(7):1249–1260. doi: 10.1007/s00018-014-1791-0. [DOI] [PMC free article] [PubMed] [Google Scholar]
- 53.Strub T, Giuliano S, Ye T, Bonet C, Keime C, Kobi D, Le Gras S, Cormont M, Ballotti R, Bertolotto C, et al. Essential role of microphthalmia transcription factor for DNA replication, mitosis and genomic stability in melanoma. Oncogene. 2011. May 19;30(20):2319–2332. doi: 10.1038/onc.2010.612. [DOI] [PubMed] [Google Scholar]
- 54.Ayers M, Lunceford J, Nebozhyn M, Murphy E, Loboda A, Kaufman DR, Albright A, Cheng JD, Kang SP, Shankaran V, et al. IFN-γ-related mRNA profile predicts clinical response to PD-1 blockade. J Clin Invest. 2017. August 1;127(8):2930–2940. doi: 10.1172/JCI91190. [DOI] [PMC free article] [PubMed] [Google Scholar]
- 55.Hobo W, Norde WJ, Schaap N, et al. B and T lymphocyte attenuator mediates inhibition of tumor-reactive CD8+ T cells in patients after allogeneic stem cell transplantation. J Immunol Baltim Md 1950. 2012. July 1;189(1):39–49. [DOI] [PubMed] [Google Scholar]
- 56.Buscà R, Berra E, Gaggioli C, Khaled M, Bille K, Marchetti B, Thyss R, Fitsialos G, Larribère L, Bertolotto C, et al. Hypoxia-inducible factor 1{alpha} is a new target of microphthalmia-associated transcription factor (MITF) in melanoma cells. J Cell Biol. 2005. July 4;170(1):49–59. doi: 10.1083/jcb.200501067. [DOI] [PMC free article] [PubMed] [Google Scholar]
- 57.Lasaro MO, Sazanovich M, Giles-Davis W, Mrass P, Bunte RM, Sewell DA, Hussain SF, Fu Y-X, Weninger W, Paterson Y, et al. Active immunotherapy combined with blockade of a coinhibitory pathway achieves regression of large tumor masses in cancer-prone mice. Mol Ther J Am Soc Gene Ther. 2011. September;19(9):1727–1736. doi: 10.1038/mt.2011.88. [DOI] [PMC free article] [PubMed] [Google Scholar]
Associated Data
This section collects any data citations, data availability statements, or supplementary materials included in this article.