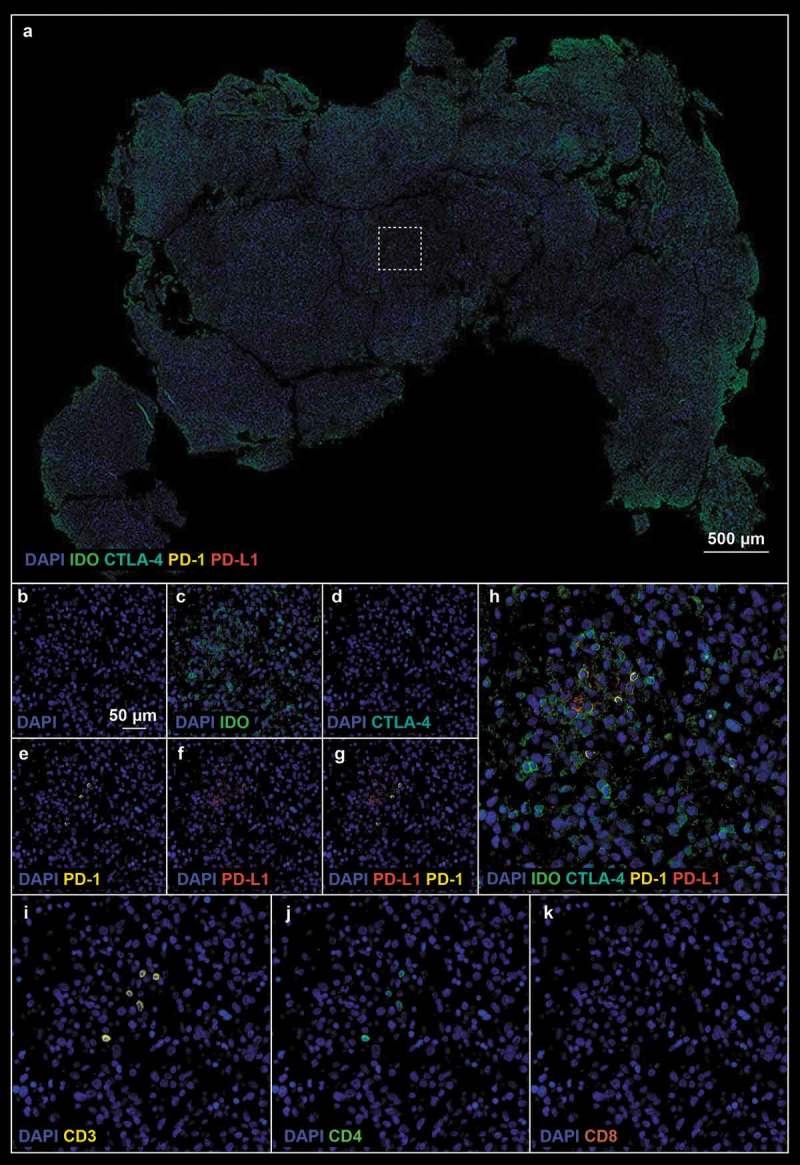
Figure 6.

(a). Pre-treatment tissue biopsy stained with checkpoint protein (Panel 2 from Suplemental Table 1) antibodies; white boxes define the region of interest. (b–k). Single marker pictures (b–f), PD-1 and PD-L1 (g), merge (h), and neuroinflammatory cell markers (i–k) of the ROI indicated in A. Blue: DAPI, green: IDO, cyan: CTLA-4, yellow: PD-1, red: PD-L1.
