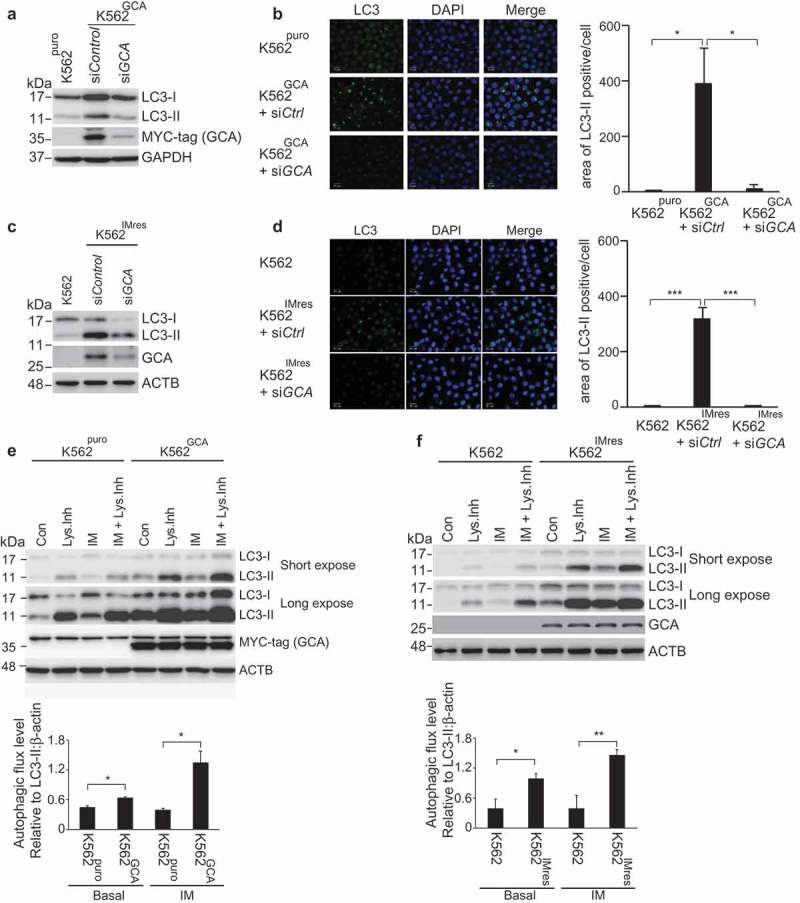
Figure 4.

GCA activated autophagy to induce imatinib resistance. (a) K562GCA cells were transfected with control and GCA siRNAs and subjected to immunoblotting for LC3-I, LC3-II, MYC-tag and ACTB along with K562puro. (b) The same cells were immunostained for LC3 to visualize autophagosomes (green) and stained with DAPI for nuclei (blue). Scale bar, 10 μm. The area of LC3 is quantified by ImageJ software. The graph showed the average of three independent experiments with error bar (S.D.). Student’s t-test, *p < 0.05, ***p < 0.001 (c-d) K562 and K562IMres cells were subjected to the same experiment in Figure 4a–b. (e) The autophagic flux quantification of K562puro and K562GCA cells. The cells were treated with imatinib (0.5 µM) for 3 h with/without lysosomal inhibitors (NH4Cl & E-64-d). Representative western blots (left panel) and the graph show the average of three independent experiments (right panel). The error bars indicate the S.D. Student’s t-test, *p < 0.05, **p < 0.01. (f) K562 and K562IMres cells were subjected to the same experiment for the autophagy flux quantification in Figure 4e.
