Figure 7.

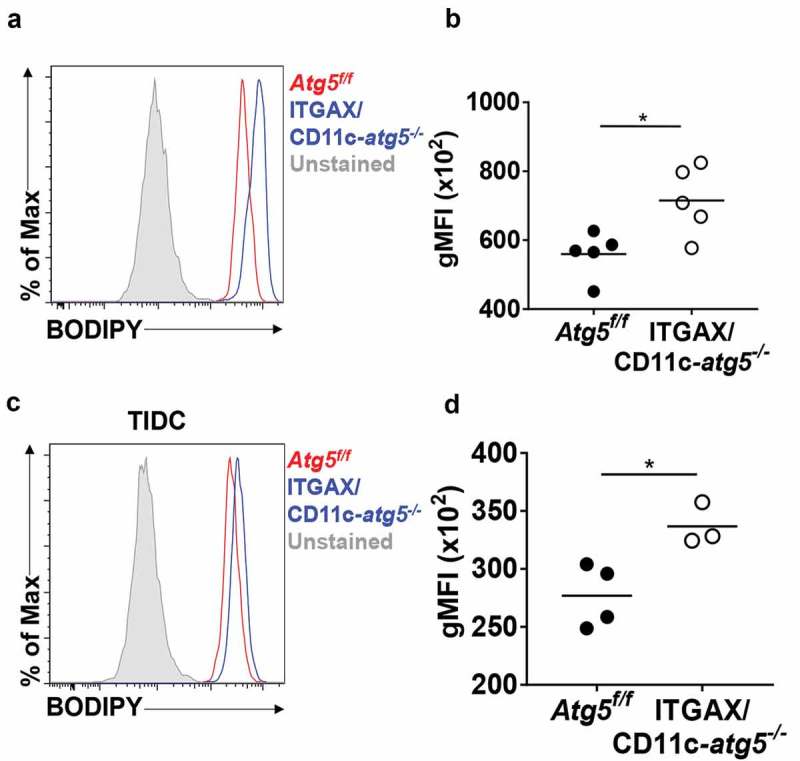
Increased lipid accumulation in Atg5-deficient dendritic cells in vivo. (a) Total amount of lipids in migratory dendritic cells from draining lymph nodes of normal Atg5f/f (red) or ITGAX/CD11c-atg5−/- mice (blue) were stained with BODIPY dye and monitored with flow cytometry. Unstained sample was used as negative control (gray). (b) Data shown in dot graph (5 mice per group; *P < 0.05). (c) Total amount of lipids in tumor-infiltrated dendritic cells from tumor-bearing Atg5f/f (red) or ITGAX/CD11c-atg5−/- mice (blue). (d) Data shown in dot graph (3 ~ 4 mice per group; *P < 0.05). Data are representative of 3 similar independent experiments.
