ABSTRACT
Non-small cell lung cancer (NSCLC) is a complex disease in need of new methods of therapeutic intervention. Recent interest has focused on using microRNAs (miRNAs) as a novel treatment method for various cancers. miRNAs negatively regulate gene expression post-transcriptionally, and have become attractive candidates for cancer treatment because they often simultaneously target multiple genes of similar biological function. One such miRNA is miR-146a-5p, which has been described as a tumor suppressive miRNA in NSCLC cell lines and tissues. In this study, we performed RNA-Sequencing (RNA-Seq) analysis following transfection of synthetic miR-146a-5p in an NSCLC cell line, A549, and validated our data with Gene Ontology and qRT-PCR analysis of known miR-146a-5p target genes. Our transcriptomic data revealed that miR-146a-5p exerts its tumor suppressive function beyond previously reported targeting of EGFR and NF-κB signaling. miR-146a-5p mimic transfection downregulated arachidonic acid metabolism genes, the RNA-binding protein HuR, and many HuR-stabilized pro-cancer mRNAs, including TGF-β, HIF-1α, and various cyclins. miR-146a-5p transfection also reduced expression and cellular release of the chemokine CCL2, and this effect was mediated through the 3ʹ untranslated region of its mRNA. Taken together, our work reveals that miR-146a-5p functions as a tumor suppressor in NSCLC by controlling various metabolic and signaling pathways through direct and indirect mechanisms.
KEYWORDS: Inflammation, lung adenocarcinoma, microRNA, gene expression, RNA-Seq, post-transcriptional regulation, HuR, CCL2
Introduction
Recent work has suggested that post-transcriptional regulation of gene expression plays a significant role in cancer development and progression. microRNAs (miRNAs) are a major part of this landscape. miRNAs are a conserved class of non-coding RNAs that are typically 18–22 nucleotides in length and negatively regulate expression of specific target genes. They carry out this function by associating with certain protein factors to form the RNA-induced silencing complex (RISC). miRNAs direct the RISC to target messenger RNA (mRNA) molecules, most often through sequences in the 3ʹ untranslated region (UTR) of the mRNA. Expression is repressed by either blocking translation, promoting mRNA instability, or through direct mRNA cleavage [1]. Despite their small size, miRNAs have powerful effects on gene expression in the cell.
Dysregulation of miRNA expression and function has been suggested to be a strong factor in initiating and promoting various diseases, including many cancers [2,3]. miRNAs have been described as tumor suppressive or oncogenic (oncomiR) based on its specific target repertoire. Tumor suppressive miRNAs tend to target genes that promote cancer, and are typically downregulated in the diseased state. Conversely, oncomiRs can suppress protein-coding tumor suppressor genes and are upregulated in cancer [4]. To make matters even more complex, specific miRNAs can act as a tumor suppressor in some cancer types, but as an oncomiR in others. They sometimes even differ within subtypes of a specific cancer [5]. For these reasons, careful and directed research must be done to establish the role of a particular miRNA in different cancers.
One frequently studied miRNA is miR-146a-5p, referred to hereafter as miR-146a. This miRNA has been established as a negative regulator of inflammation, especially through its most well established targets Interleukin-1 receptor-associated kinase 1 (IRAK1) and TNF receptor-associated factor 6 (TRAF6), adaptor proteins that lead to NF-κB activation [6]. As described above, miR-146a is overexpressed in some cancers, but repressed in others [7,8]. Our lab has recently focused on miR-146a in non-small cell lung cancer (NSCLC) [9,10]. We and others have shown that miR-146a is highly downregulated in NSCLC cell lines and patient samples [9,11,12], attributed in part to CpG methylation of the miR-146a promoter region [10]. Restoration of miR-146a expression in NSCLC cell lines resulted in decreased rates of cell proliferation, growth, migration, and survival [9,11,12]. Studies have shown that direct targets of miR-146a, like EGFR [11], contribute to these phenotypic effects in NSCLC. However, no global analysis has been performed to examine the overall effect of miR-146a expression on various cellular pathways in this cancer. Because miRNAs can target many genes simultaneously, they often have profound effects on cell phenotype and gene expression [3]. Additionally, they can have many indirect targets. For example, miR-146a-mediated repression of a transcription factor can result in downregulation of target genes of that particular transcription factor [13]. For this reason, we became interested in investigating other genes and pathways regulated by this miRNA.
Here, we performed Next Generation RNA Sequencing (RNA-Seq) on NSCLC samples transfected with synthetic miR-146a or negative control miRNA mimic. Overall, our data suggest that miR-146a plays a widespread role in NSCLC cells through regulation of multiple pathways. Its control of arachidonic acid (AA) metabolism is likely more widespread than initially believed. Notably, direct regulation of RNA-binding protein HuR allows miR-146a to negatively regulate many cancer promoting genes in an indirect manner. CCL2, an important chemokine involved in cancer, is one of these HuR target genes. These transcriptomic studies may be key for the development of miR-146a as a novel therapeutic treatment for NSCLC.
Results
RNA-sequencing (RNA-Seq) and gene ontology analysis
Several research groups have established that miR-146a can act as a tumor suppressor in NSCLC through various phenotypic assays [11,12]. However, only a few genes and pathways were described in these studies. We questioned whether the role of miR-146a in NSCLC is restricted to these genes, or whether other pathways are also involved. To explore this question, we chose to examine transcriptome-wide changes following miR-146a transient transfection. We performed our analysis on A549 cells, since it is a well-established and highly studied NSCLC cell line that expresses low levels of miR-146a endogenously [9]. These cells were transfected with 50 nM of either a synthetic miR-146a mimic or 50 nM of a negative control miRNA. RNA was isolated from these cells and purified. Prior to sequencing, poly(A)+ RNA was selected. Next Generation RNA-Seq was performed on these samples.
Overall, A549 cells transfected with synthetic miR-146a had about 2,688 genes with increased expression, 1,377 of which displayed a greater than 2-fold increase relative to A549 cells transfected with the negative control miRNA. Of the 5,966 downregulated genes, 1,601 showed a 50% or more decrease in expression. Gene Ontology analysis was performed in order to establish groups of genes that were significantly up- or downregulated following miR-146a treatment compared to the control. These genes were grouped in g:Profiler based on their overall biological function [14]. As seen in Table 1, numerous gene groups displayed significant enrichment. Notably, ‘cell killing’ genes increased in expression after synthetic miR-146a transfection, whereas decreased expression was observed for genes involved in the cell cycle process, DNA replication, and cellular movement. This analysis corroborates findings in the literature that restoration of miR-146a expression in NSCLC promotes apoptosis, while inhibiting cell proliferation and migration [9,11,12].
Table 1.
Gene Ontology (GO) enrichment analysis of A549 miR-146a RNA-Seq data. RNA-Seq data from A549 cells transfected with 50 nM of synthetic miR-146a or a non-targeting miRNA were used for GO enrichment analysis using g:Profiler. Genes were grouped based on their cellular function. Several groups with significant expression differences are listed below. Increased or decreased gene expression is based on expression levels post-miR-146a transfection (relative to the control).
| Increased Gene Expression | p-value | Decreased Gene Expression | p-value |
|---|---|---|---|
| Development process | 6.61 x 10⁻⁴ | Mitotic cell cycle | 4.08 x 10⁻² |
| Cell-cell signaling | 4.17 x 10⁻³ | DNA Replication | 8.79 x 10⁻⁵ |
| Cell killing | 4.91 x 10⁻⁴ | Cell cycle process | 6.01 x 10⁻⁹ |
| RNA processing | 4.73 x 10⁻³ | DNA repair | 1.58 x 10⁻⁵ |
| Negative regulation of transcription | 4.45 x 10⁻² | Cellular component movement | 3.74 x 10⁻² |
Chen and colleagues found that NSCLC patients with high levels of miR-146a had a greater overall probability of survival. However, this study only followed 32 individuals from two institutions: one in China and one in Belgium. Additionally, these patients were examined for only ~40–50 weeks [11]. We followed up on this finding by analysing publically available datasets from The Cancer Genome Atlas (TCGA). Two groups of 432 NSCLC patients each (864 total) were formed based on high or low mature miR-146a expression and monitored for nearly 11 years. As seen in Figure 1, these data also demonstrated a significantly greater overall probability of survival for individuals in the high miR-146a expression group (p = 0.017). Our results supported and expanded upon the notion proposed by Chen et al. that miR-146a expression has an important role in predicting NSCLC patient outcome, especially since our analysis included a larger number of patients, a variety of patient origins, and a much longer monitoring period [11].
Figure 1.
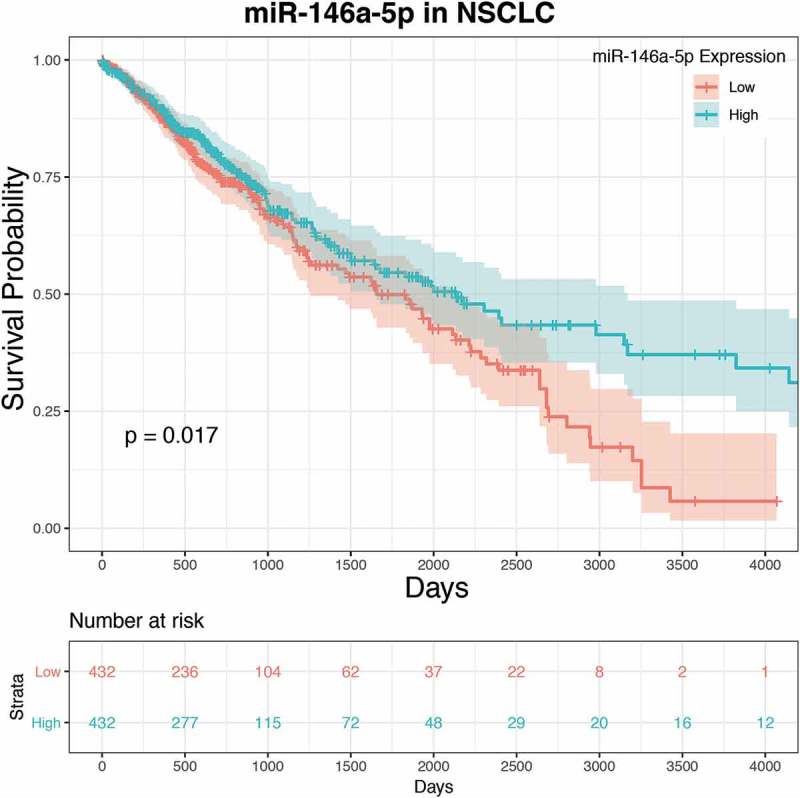
Low miR-146a expression is correlated with a lower overall probability of survival in NSCLC patients. Survival rates and expression data for miR-146a-5p were obtained from The Cancer Genome Atlas (TCGA) and analysed using R programming language and the TCGA-Assembler 2 package. Raw miR-Seq datasets were selected for NSCLC. Analysis indicated a statistically significant correlation between miR-146a expression and survival probability in NSCLC patients (p = 0.017).
Validation of RNA-Seq data
To identify specific pathways and genes affected by miR-146a, our RNA-Seq data were analysed using Ingenuity Pathway Analysis (IPA) software (Qiagen). Individual pathway networks were generated, and relative average fold changes for differentially expressed genes were displayed. qRT-PCR experiments were performed to validate expression differences for individual genes of interest. To begin, known direct targets of miR-146a were analysed to serve as positive controls. IRAK1 and TRAF6, the two most well-established miR-146a target genes, are adaptor proteins located downstream of cytokine receptors that lead to NF-κB activation [6]. Supplemental Figure 1 shows gene expression changes in the NF-κB pathway, as depicted by IPA, including IRAK1 and TRAF6. As expected, qRT-PCR analysis demonstrated that mRNA levels of these genes were significantly lower in A549 cells transfected with miR-146a (Figure 2), further supporting previous evidence that these two genes promote NSCLC progression [15,16]. Similarly, the miR-146a target gene EGFR [11] was also downregulated following miR-146a treatment (Figure 2).
Figure 2.
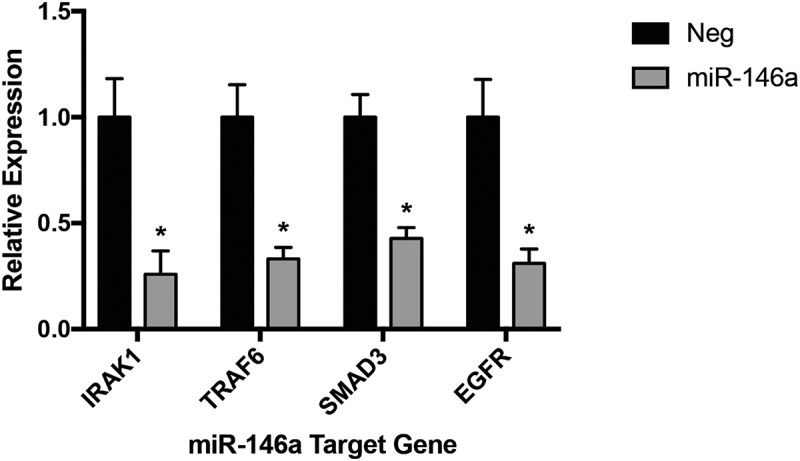
Several validated miR-146a direct target genes are downregulated in miR-146a-transfected A549 cells. ΔΔCT qRT-PCR analysis indicated decreased mRNA levels of IRAK1, TRAF6, SMAD3, and EGFR in A549 cells transfected with 50 nM of synthetic miR-146a compared to levels in cells transfected with 50 nM of a non-targeting miRNA. RNA was isolated 48 hours after transfection. Gene expression was normalized to GAPDH mRNA. (*) p< 0.02, n= 3.
Studies regarding miR-146a in NSCLC have only examined EGFR and NF-κB signaling [11]. However, miR-146a has been shown to regulate additional pathways in other cancers or cell types. The RNA-Seq data suggested both SMAD3 and NOTCH2 had reduced mRNA levels with synthetic miR-146a transfection, with respective fold changes of −1.904 and −2.178. Only SMAD3 expression could be reliably confirmed with qRT-PCR in A549 cells (Figure 2). SMAD3 is a transcription factor which propagates TGF-β signaling, resulting in induction of genes involved in cell proliferation, migration, and other cancer-related pathways [17]. It has been described as a miR-146a target in skeletal muscle cells [18,19]. SMAD4 has also been validated as a miR-146a direct target in glioblastoma, melanoma, and gastric cancer [20–23]. These observed changes in SMAD3 expression further emphasize the validity of our RNA-Seq data, but more importantly indicate for the first time that miR-146a can also regulate this pathway in an NSCLC cell line.
miR-146a affects arachidonic acid signaling at multiple levels
Next, we used IPA to focus on the arachidonic acid (AA) metabolic pathway (eicosanoid signaling). Our lab’s recent publications demonstrate that miR-146a is an endogenous dual inhibitor of this pathway in lung cells. Through its direct targeting of PTGS2 (COX-2) and ALOX5AP (FLAP), miR-146a can suppress lung cell production of pro-tumorigenic eicosanoids Prostaglandin E2 (PGE2) and Leukotriene B4 (LTB4) (Figure 3a and [9,10]). miR-146a had no effect on COX-1, the cyclooxygenase isoform responsible for homeostatic prostaglandin production [24], demonstrating the specificity of our analysis (Figure 3a). Surprisingly, our qRT-PCR analysis confirmed reduced ALOX5 (5-LO) expression in response to restoration of miR-146a (Figure 3a). 5-LO and FLAP work together to convert AA to a leukotriene intermediate, yet only the 3ʹ UTR of FLAP contains a putative miR-146a binding site. Due to their biological coupling, it is possible these genes are co-regulated, which is an interesting point for future investigation.
Figure 3.
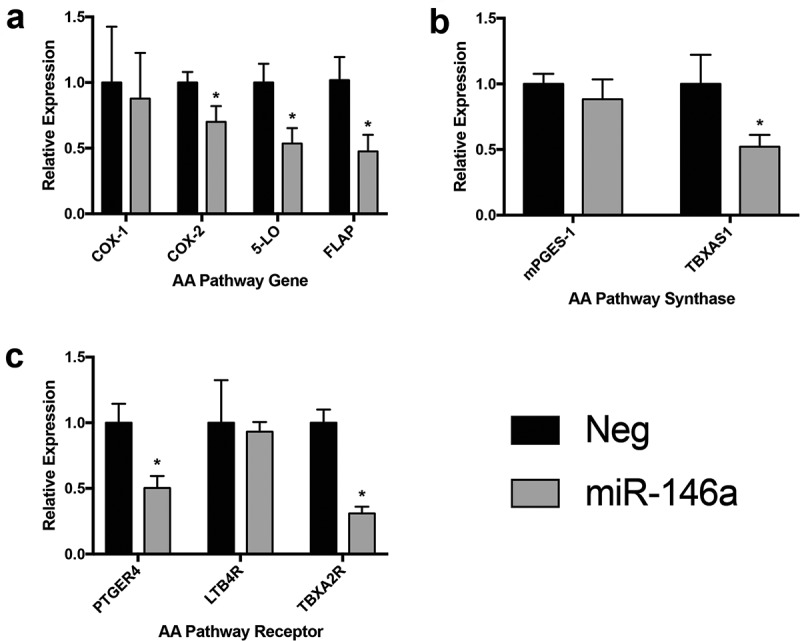
Synthetic miR-146a transfection affects multiple steps of arachidonic acid metabolism. ΔΔCT qRT-PCR analysis was used to compare specific gene expression in A549 cells transfected with 50 nM of synthetic miR-146a to expression in cells transfected with 50 nM of a non-targeting miRNA. RNA was isolated 48 hours after transfection. Gene expression was normalized to GAPDH mRNA. (a) Analysis of mRNA levels of COX-1, COX-2, 5-LO, and FLAP, the proteins involved in the rate-limiting steps of arachidonic acid metabolism. (*) p< 0.05, n= 3. (b) Analysis of mRNA levels of mPGES-1 and TBXAS1, downstream synthases that produce bioactive PGE2 and TXA2, respectively. (*) p< 0.05, n= 3. (c) Analysis of mRNA levels of PTGER4, LTB4R, and TBXA2R, respective receptors for PGE2, LTB4, and TXA2. (*) p< 0.03, n= 3.
Interestingly, the RNA-Seq data suggested that miR-146a also affects eicosanoid signaling outside of the key proteins mentioned above. The pathway diagram generated by IPA is shown in Supplemental Figure 2. Decreased expression was observed for several downstream synthases and receptors involved in prostaglandin, leukotriene, and thromboxane production and signaling. LTC4S, the synthase that converts Leukotriene A4 (LTA4) into Leukotriene C4 (LTC4), showed an ‘infinite’ negative fold change in the RNA-Seq data, meaning its mRNA was present in the negative control samples but was completely undetectable in the miR-146a-treated samples. We could not successfully detect LTC4S mRNA in any sample using qRT-PCR, suggesting this gene is not robustly expressed in A549 cells. mPGES-1 is the inducible form of the synthase that produces bioactive PGE2 [25]. mRNA levels of this gene were slightly decreased following miR-146a transfection, but the results were not statistically significant (Figure 3b). However, significant downregulation of TBXAS1 mRNA, the synthase responsible for Thromboxane A2 (TXA2) production, was observed (Figure 3b).
miR-146a was also predicted to downregulate several eicosanoid receptors (Supplemental Figure 2). As mentioned previously, miR-146a has been verified to target other receptors, such as EGFR and NOTCH1/2 [11,26–28]. No significant difference in expression was noted when examining LTB4R levels, but we did observe changes in expression for both TBXA2R and PTGER4, respective receptors for TXA2 and PGE2 (Figure 3c). Regulation of the eicosanoid receptors implies that this miRNA can control not only production of these lipid mediators, but also levels of the molecules that receive and transmit their signals that lead to changes in cellular gene expression and behaviour. Overall, these results provide more evidence for miR-146a’s role as a negative regulator of inflammation and suggest for the first time that it can affect AA metabolism and signaling outside of the rate-limiting enzymes.
miR-146a regulates HuR in lung cells
Previous work suggested that miR-146a can repress expression of the RNA-binding protein Human Antigen R (HuR) in human airway smooth muscle cells [29] and bone marrow-derived macrophages [30], while another study confirmed its direct targeting using 3ʹ UTR luciferase assays [31]. However, the data in these reports were limited and the implications of this regulation were not explored further. HuR binds to AU-rich elements (AREs) in the 3ʹ UTRs of specific, often short-lived, mRNAs, stabilizing them. In fact, many cancer-promoting genes are stabilized by HuR, such as Bcl-2. Because of this, negative regulation of HuR can indirectly control genes involved in multiple hallmarks of cancer, described in detailed review articles by Dr. Myriam Gorospe’s lab [32,33].
To further explore this, the Kaplan-Meier Plotter online tool specific for NSCLC (www.kmplot.com [34],) was utilized to examine the effect of HuR mRNA expression on overall survival in lung cancer patients. We analysed data from patient samples that had a subtype assigned to their disease, and HuR expression was designated as high or low depending on how their level compared to the median. In 524 lung squamous cell carcinoma patients, expression levels of HuR did not associate with overall survival rates (p = 0.038, HR = 0.78) (Figure 4a). Conversely, expression levels of HuR had a highly statistically significant association with overall survival in 720 lung adenocarcinoma patients (p = 0.0005, HR = 1.52) (Figure 4a). Additional in silico analysis demonstrated that the miR-146a binding site is highly conserved in HuR orthologs of various vertebrate species (Figure 4b,c), implying this regulation is quite important.
Figure 4.
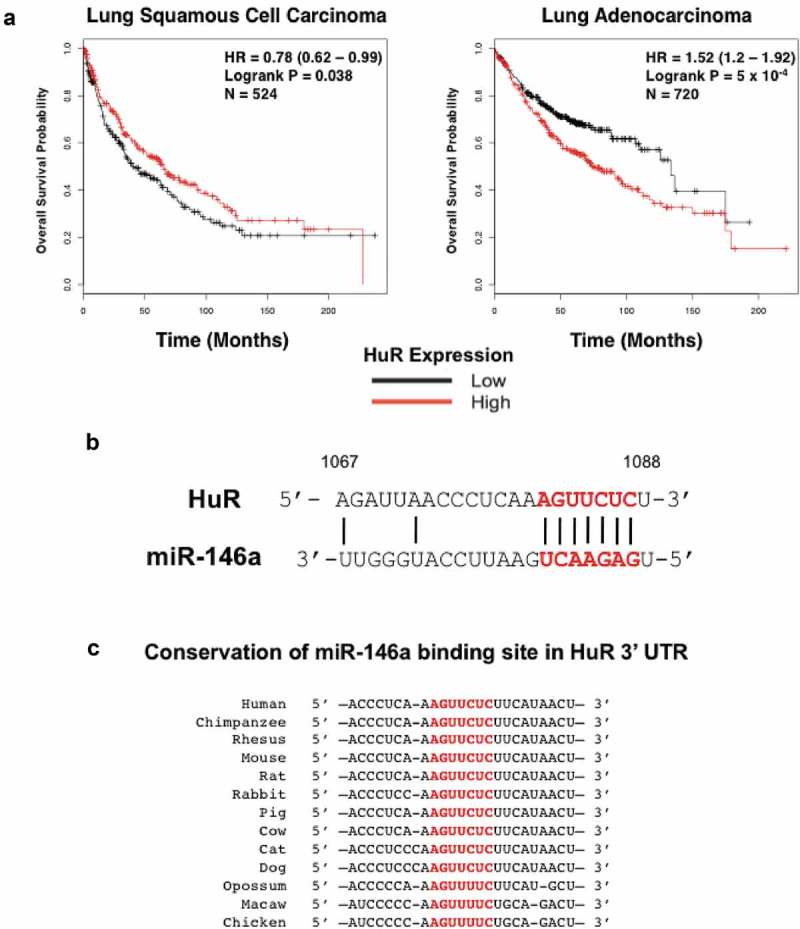
The RNA-binding protein HuR is a predicted target of miR-146a. (a) The NSCLC KM Plotter Tool (www.kmplot.com) was used to generate survival curves based on a patient’s overall survival in months and their HuR expression level (low or high) relative to the median value. No strong correlation was observed between HuR expression and overall survival in 524 lung squamous cell carcinoma patients, but there was a highly significant correlation between high HuR expression and overall survival in 720 lung adenocarcinoma patients (p = 5 x 10⁻⁴). (b) Predicted alignment of miR-146a binding to the HuR mRNA 3ʹ UTR. The 7-mer seed sequence is highlighted in red and bold. Numbers represent the base position within the 3ʹ UTR (1067 to 1088). (c) Diagram displaying the sequence conservation of the miR-146a seed sequence (highlighted in red) in the 3ʹ UTR of HuR orthologs across various vertebrate species. Sequences were obtained from TargetScan.
To further validate our RNA-Seq data, A549 cells were either mock-treated or transiently transfected with 50 nM of synthetic miR-146a or a negative control miRNA. HuR mRNA levels significantly decreased in only the cells treated with miR-146a (Figure 5a). Similarly, HuR protein expression was downregulated ~2.5-fold by miR-146a in A549 cells (Figure 5b). We also generated stable H1299 cell lines (lymph node metastatic lung adenocarcinoma cells) that inducibly express miR-146a in the presence of doxycycline, as described previously [10]. HuR protein expression decreased only in the cells with induced miR-146a expression and not in the controls (Figure 5c). These results corroborate the transient transfection data, and also demonstrate that our observations are not cell line-specific.
Figure 5.
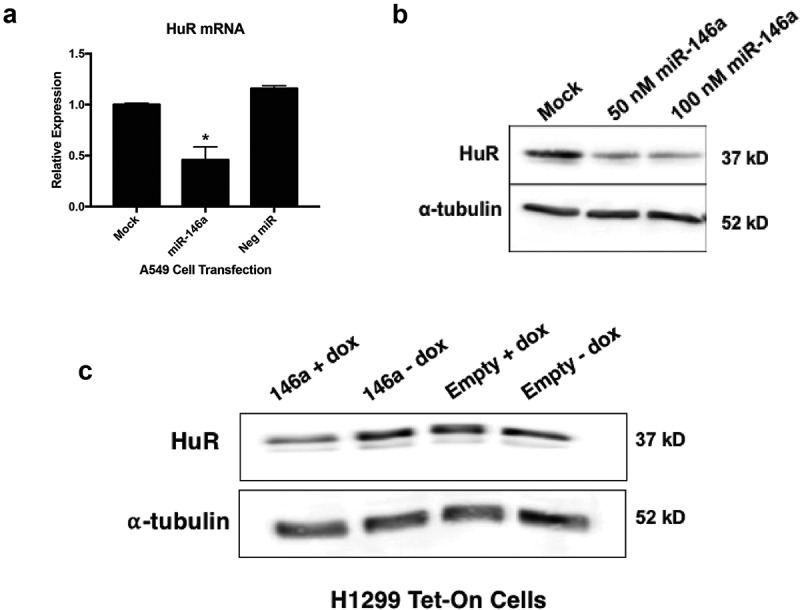
miR-146a negatively regulates HuR expression in lung cells. (a) A549 cells were transiently transfected with miRNA mimics at a 50 nM concentration. Cells were lysed and RNA was isolated 48 hours post-transfection. ΔΔCT qRT-PCR analysis indicated decreased HuR mRNA expression in A549 cells transfected with 50 nM of synthetic miR-146a. HuR expression was normalized to GAPDH mRNA. HuR mRNA levels were significantly different in cells transfected with synthetic miR-146a from levels in mock-treated cells and cells transfected with 50 nM of a non-targeting miRNA. (*) p < 0.01, n = 3. (b) A549 cells were transiently transfected with synthetic miR-146a at 50 and 100 nM concentrations. Cells were lysed and protein was isolated 48 hours post-transfection. Western blot analysis of cell lysates indicated decreased HuR protein expression in A549 cells transfected with 50 nM of synthetic miR-146a and 100 nM of synthetic miR-146a compared to mock-treated A549 cells. (c) Western blot analysis of cell lysates indicated decreased HuR protein expression only in H1299 Tet/TRE-miR-146a cells cultured in 1 μg/mL doxycycline.
HuR target genes are affected by miR-146a
As alluded to previously, if miR-146a downregulates HuR in lung cells, then we would expect the abundance of HuR target mRNAs to also decrease following miRNA transfection. This is in fact the case for many of these mRNAs, as suggested by the RNA-Seq data and displayed in Table 2. Some of these targets were validated using qRT-PCR. Cyclins A2, B1, and E1 were all repressed in response to miR-146a transfection (Figure 6a). This corroborates and builds upon results from Li and colleagues showing that miR-146a inhibits cell proliferation in NSCLC, which the authors attributed to direct targeting of cyclins D1 and D2 [12]. We could not confidently verify a significant effect of miR-146a on Bcl-2 or VEGFA mRNAs (Figure 6a). However, significant repression was seen for both HIF-1α and TGF-β when treated with synthetic miR-146a (Figure 6a). To determine if miR-146a-mediated regulation of HuR contributes to downregulation of these genes, we performed a rescue experiment where the miRNA mimics were co-transfected with a HuR expression vector (pcDNA3.1(+)-HuR-FLAG). HuR overexpression was able to significantly increase cyclin E1, TGF-β, and HIF-1α mRNA levels, even in the presence of miR-146a (Figure 6b). Overall, our data imply that negative regulation of HuR expression by miR-146a in lung cells affects mRNA levels of several of this RNA-binding protein’s cancer-promoting target genes.
Table 2.
RNA-Seq data of HuR target genes. A549 cells were transiently transfected with 50 nM of either synthetic miR-146a or a non-targeting miRNA. Fold changes relative to the control were determined by calculating the average of the biological replicates for each gene. The role that each HuR target gene plays in cancer is also displayed.
| HuR Target mRNA | Relative Fold Change | Cancer Traits |
|---|---|---|
| CCL2 | −4.365 | Inflammation, angiogenesis |
| COX-2 | −1.798 | Inflammation, angiogenesis |
| Cyclin E1 | −1.474 | Proliferation |
| Cyclin A2 | −1.204 | Proliferation |
| Cyclin B1 | −1.469 | Proliferation |
| eIF4E | −1.144 | Proliferation, survival |
| BCL-2 | −1.791 | Survival |
| Mdm-2 | −1.448 | Survival |
| HIF-1⍺ | −1.377 | Angiogenesis, survival |
| VEGF | −1.145 | Angiogenesis, proliferation |
Figure 6.
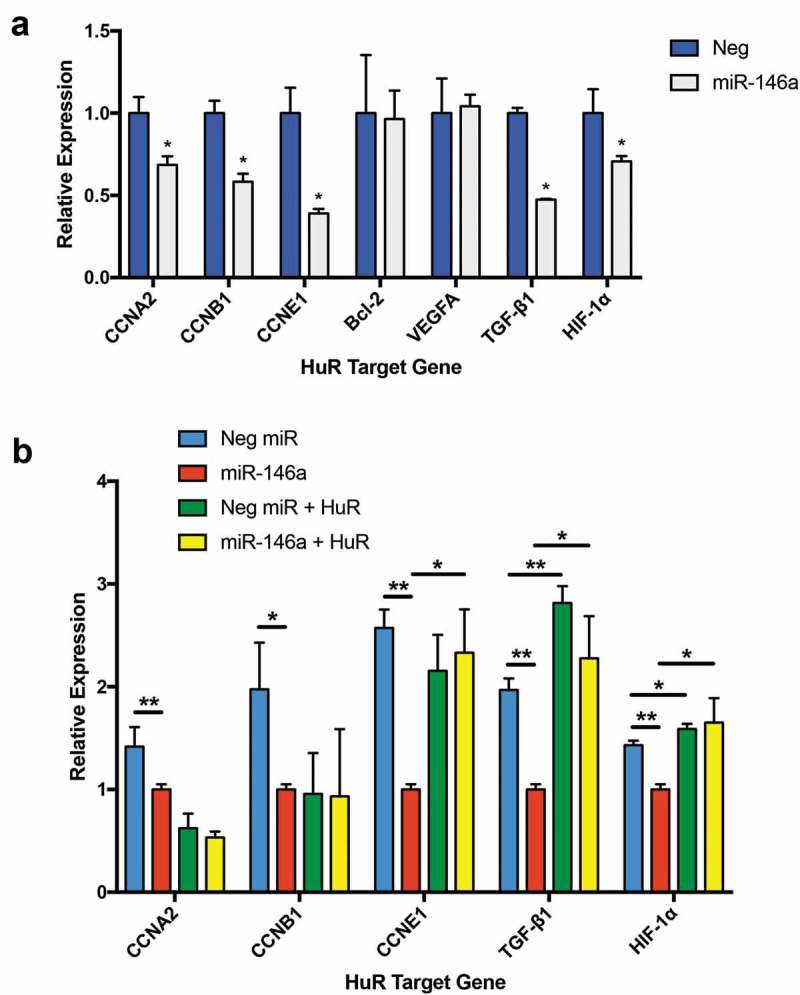
Multiple HuR target genes are downregulated in miR-146a-transfected A549 cells. (a) ΔΔCT qRT-PCR analysis indicated decreased mRNA levels of CCNA2, CCNB1, CCNE1, TGFB1, and HIF1A in A549 cells transfected with 50 nM of synthetic miR-146a compared to levels in cells transfected with 50 nM of non-targeting miRNA. RNA was isolated 48 hours after transfection. Gene expression was normalized to GAPDH mRNA. (*) p< 0.05, n= 3. (b) A549 cells were transfected with 50 nM of synthetic miRNAs, as in (a), with or without co-transfection of a HuR expression vector, pcDNA3.1(+)-HuR-FLAG. RNA was isolated 48 hours after transfection. ΔΔCT qRT-PCR analysis indicated significantly increased levels of CCNE1, TGFB1, and HIF1A in A549 cells where HuR was overexpressed, even in the presence of miR-146a. Gene expression was normalized to GAPDH mRNA. (*) p< 0.05, n= 3; (**) p< 0.01, n= 3.
CCL2 production is negatively regulated by miR-146a
Next, we chose to examine another HuR target gene in more detail: CCL2. Also known as monocyte chemoattractant protein-1 (MCP-1), CCL2 is a chemokine highly expressed by tumor and stromal cells [35,36]. It fosters a tumor-supportive microenvironment by activating endothelial cells and promoting their migration [37], and also by recruiting monocytes to the tumor site and promoting their polarization to the M2 (pro-tumor) macrophage phenotype [36,38]. CCL2 stood out because it was the HuR target with the highest rate of decrease (−4.365-fold) according to our RNA-Seq data (Table 2).
As we did with HuR, we conducted NSCLC Kaplan-Meier Plotter online tool analysis for CCL2. No effect of CCL2 mRNA expression on overall survival in lung squamous cell carcinoma was observed in 524 patient samples (p = 0.12, HR = 0.83) (Figure 7a), whereas a highly significant association (p = 2.3 x 10⁻⁶, HR = 1.77) was seen in the 720 lung adenocarcinoma patients (Figure 7a). Interestingly, we also noted this subtype specific difference with HuR (Figure 4a), as well as with FLAP in a previous study [10].
Figure 7.
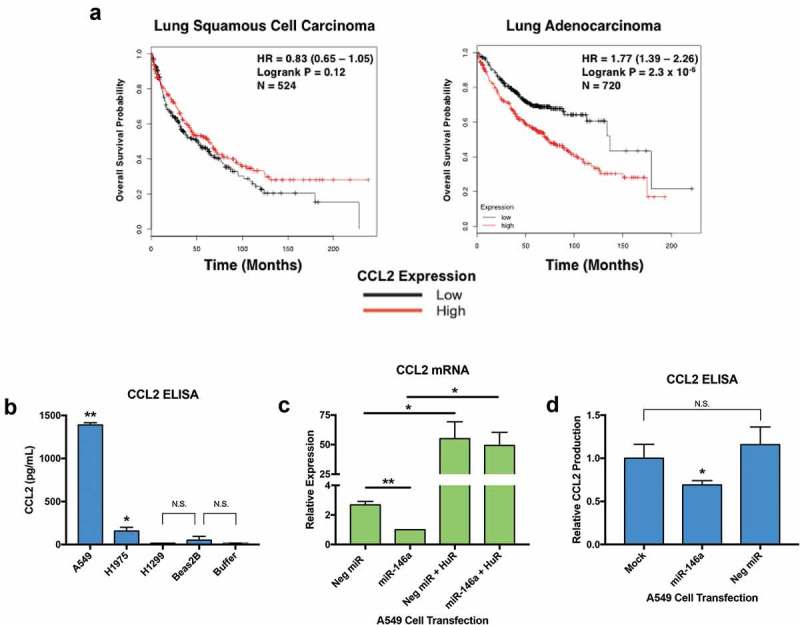
Restoration of miR-146a expression in A549 cells results in decreased production and release of CCL2. (a) The NSCLC KM Plotter Tool (www.kmplot.com) was used to generate survival curves based on a patient’s overall survival in months and their CCL2 expression level (low or high) relative to the median value. No significant correlation between CCL2 expression and overall survival in 524 lung squamous cell carcinoma patients was observed (p = 0.12), but there was a highly significant correlation between high CCL2 expression and overall survival in 720 lung adenocarcinoma patients (p = 2.3 x 10⁻⁴). (b) A549, H1975, H1299, and Beas2B cells were allowed to grow undisturbed for 48 hours. Cell-free, serum-free supernatants were collected, then an enzyme-linked immunosorbent assay (ELISA) was used to measure baseline CCL2 concentrations. A549 cells produced much higher amounts of CCL2 compared to H1975, H1299, and Beas2B cells. H1975 cells produced less CCL2 than A549 cells, but still significantly more than H1299 and Beas2B cells. Assay Buffer A was used as a negative control. (*) p < 0.015, n= 4; (**) p < 0.0001, n= 4. (c) A549 cells were transiently transfected with miRNA mimics at a 50 nM concentration. Cells were lysed and RNA was isolated 48 hours post-transfection. CCL2 expression was normalized to GAPDH mRNA. CCL2 mRNA levels were significantly different in cells transfected with miR-146a from levels in cells transfected with 50 nM of non-targeting miRNA. Co-transfection of the miRNA mimics with a HuR expression vector, pcDNA3.1(+)-HuR-FLAG, could rescue CCL2 mRNA levels, even in the presence of miR-146a. (*) p < 0.05, n = 3; (**) p < 0.01, n = 3. (d) Cell-free, serum-free supernatants were collected 48 hours post-transfection. ELISA analysis indicated that A549 cells transfected with synthetic miR-146a produced significantly less CCL2 compared to mock-treated cells and cells transfected with a non-targeting miRNA. Each sample’s CCL2 concentration was normalized to its total protein concentration. (*) p < 0.025, n= 3.
Western blots were performed with a CCL2 polyclonal antibody to determine baseline protein expression levels of CCL2 in lung cell lines, but no CCL2 protein could be detected in cell lysates (data not shown). ELISAs were performed to examine concentrations of CCL2 secreted by lung cell lines. As seen in Figure 7b, A549 cells secrete abundant amounts of CCL2. H1975 cells produce significantly higher levels of CCL2 compared to H1299 and Beas2B cells, but still much less than A549 cells. Detected amounts of CCL2 in the media collected from H1299 and Beas2B cells were not significantly higher than the negative control, Assay Buffer A.
qRT-PCR analysis confirmed a significant reduction in CCL2 mRNA in response to synthetic miR-146a transfection in A549 cells (Figure 7c). Like some of the HuR targets in Figure 6B, overexpression of HuR was able to rescue CCL2 mRNA levels in the presence of miR-146a (Figure 7c). Another CCL2 ELISA was performed on A549 cells transiently transfected with miRNA mimics. The data suggest that miR-146a can repress A549 cell production of CCL2, while treatment with the negative control miRNA had no effect (Figure 7d).
As was described earlier with 5-LO, the CCL2 mRNA 3ʹ UTR does not have a binding site for miR-146a, but is nonetheless downregulated in response to miR-146a transfection. To further examine a mechanism for miR-146a-mediated regulation of this gene, we utilized a CCL2 3ʹ UTR luciferase construct (pLightSwitch_CCL2 3ʹ UTR). Co-transfection of luciferase constructs and synthetic miRNAs in A549 cells indicated a significant decrease in CCL2 3ʹ UTR luciferase activity only in the presence of miR-146a (Figure 8a), suggesting the 3ʹ UTR plays a role even without a miR-146a binding site. Because the CCL2 3ʹ UTR contains AREs and is stabilized by HuR in lung cell lines [39], we hypothesized that miR-146a-mediated downregulation of HuR may be the explanation for this miRNA’s effect on CCL2 3ʹ UTR luciferase activity. To assess this, we repeated the experiment with or without co-transfection of the HuR expression vector (pcDNA3.1(+)-HuR-FLAG) and saw that HuR overexpression could rescue CCL2 3ʹ UTR luciferase activity (Figure 8b). These data imply that miR-146a can negatively regulate CCL2 expression indirectly through control of HuR expression.
Figure 8.
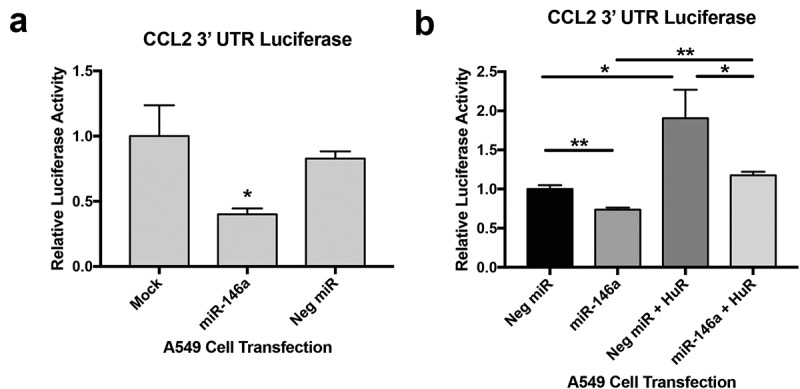
miR-146a indirectly regulates CCL2 expression. (a) Renilla luciferase activity was measured in A549 cells transfected with synthetic miRNAs and the pLightSwitch_CCL2 3ʹ UTR construct. CCL2 3ʹ UTR luciferase activity was normalized to activity from the pLightSwitch_GAPDH 3ʹ UTR construct in A549 cells exposed to the same miRNA condition. Luciferase activity was further normalized to total protein concentrations of each sample. Luciferase activity was significantly reduced in cells transfected with synthetic miR-146a. (*) p < 0.02, n = 4. (b) The CCL2 3ʹ UTR luciferase assay was repeated as in (a), but additional samples were generated with the synthetic miRNAs and pLightSwitch_CCL2 3ʹ UTR construct co-transfected with a HuR expression vector, pcDNA3.1(+)-HuR-FLAG. Overexpressing HuR could rescue the luciferase activity that was inhibited by synthetic miR-146a, but levels were not as high as luciferase activity in cells transfected with both pcDNA3.1(+)-HuR-FLAG and the negative control miRNA. (*) p < 0.05, n = 3; (**) p < 0.03, n = 3.
Discussion
The data presented in this article focus on analysis of RNA-Seq data obtained from A549 cells transfected with synthetic miR-146a or a negative control miRNA. Gene ontology analysis of the results (Table 1), TCGA data mining (Figure 1), and qRT-PCR validation of several positive control miR-146a target genes (Figure 2), indicated that our results are in line with the published literature on miR-146a in NSCLC, yet revealed significant new insights. Downregulation of eicosanoid-related synthases and receptors suggested that this miRNA can affect AA metabolism outside of the rate-limiting steps (Figure 3). The RNA-binding protein HuR is also downregulated by miR-146a (Figures 4 and 5), which consequently affected its target mRNA levels (Table 2 and Figure 6), including CCL2. miR-146a transfection reduced A549 cell release of CCL2 (Figure 7). Luciferase assays indicated this effect is mediated through the CCL2 3ʹ UTR (Figure 8). In sum, these data strongly suggest miR-146a has widespread effects on gene expression in NSCLC cells.
In recent years, much enthusiasm has surrounded the idea of using miRNAs as a novel therapy to treat cancer [40–42]. Because miR-146a is highly downregulated in NSCLC, restoration of its expression may be a useful gene therapy method for fighting this disease. miR-146a has been established in the literature as a negative regulator of inflammation and a mediator of the innate immune response [7,43]. However, only several genes and pathways have been shown to be regulated by miR-146a in NSCLC. If this miRNA is to be considered as a therapeutic candidate, it would be important to have a more comprehensive understanding of its effects on gene expression. The transcriptomic studies presented in this article could be the basis for identifying new miR-146a targets in NSCLC cells, and also provide more insight into the effects of miR-146a expression on pathways outside of inflammation.
Our work suggests that miR-146a can negatively regulate multiple pro-cancer signaling pathways in NSCLC, including EGFR, TGF-β, HIF-1α, NF-κB, and eicosanoid signaling. These findings provide further evidence for its role as a tumor suppressor in NSCLC. These results could explain the robust phenotypic effects on NSCLC cells observed by other groups following miR-146a restoration [11,12]. In terms of in vivo studies, one group showed that injecting NSCLC cells overexpressing miR-146a into nude mice formed smaller tumors than control cells [12], but no work has been done on mice that spontaneously form lung tumors.
Because our lab has focused on miR-146a regulation of arachidonic acid metabolism [9,10,24], it was quite intriguing that this miRNA can affect expression of components of this pathway outside of the rate-limiting steps, including downstream synthases and receptors. Most notable was PTGER4 (Figure 3c), the gene coding for the EP4 receptor, which is one of the four identified receptors for PGE2. EP4 was characterized as the receptor responsible for mediating PGE2 induced migration in A549 cells [44]. EP4 is post-transcriptionally regulated by miR-101 in colon cancer [45], which is the only study to date demonstrating miRNA-mediated control of this receptor. Overall, the PTGER4 data are intriguing because they suggest that miR-146a can control the transmission of eicosanoid signals through regulation of receptor expression levels.
Finally, this study also identifies the RNA-binding protein HuR as a miR-146a target in NSCLC cells. Our work is the first to examine this in a cancer context, as well as to assess the downstream effects of this regulation. Increased expression and cytoplasmic localization of HuR is often observed in NSCLC [46,47]. Our work suggests that numerous HuR target mRNAs decrease in abundance following miR-146a transfection, including cyclin A2, cyclin B1, cyclin E1, HIF-1α, TGF-β, and CCL2 (Figures 6 and 7). These indirect effects reiterate why miRNA dysregulation can have such profound consequences in the cell. An additional HuR-regulated mRNA is COX-2, which we established as a direct target of miR-146a in NSCLC cells [9]. Interestingly, miR-146a has an impact on COX-2 expression in several simultaneous ways: decreased transcriptional activation via downregulation of both EGFR and NF-κB signaling, direct targeting of the COX-2 3ʹ UTR, and reduced mRNA stability following HuR downregulation. These mechanisms allow miR-146a to negatively control inflammation at multiple levels, and loss of this regulation contributes to the development and progression of NSCLC. A model for these newly uncovered mechanisms of miR-146a-mediated gene expression regulation in NSCLC is displayed in Figure 9.
Figure 9.
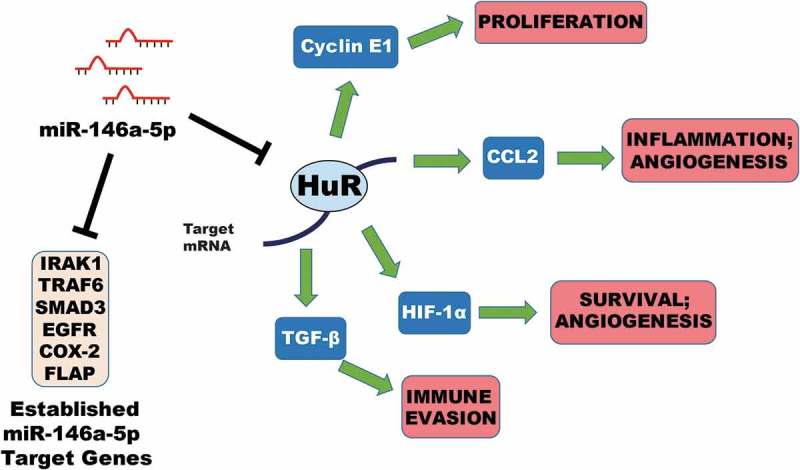
Model for regulation of gene expression by miR-146a in NSCLC. Data from our lab and others have demonstrated the ability of miR-146a to regulate expression of its target genes IRAK1, TRAF6, SMAD3, EGFR, COX-2 (PTGS2), and FLAP (ALOX5AP) in NSCLC cells. This work has suggested that miR-146a can directly mediate downregulation of the RNA-binding protein HuR in NSCLC. HuR can stabilize certain mRNAs by binding to AU-rich elements (AREs) that are typically found in the 3ʹ UTR. miR-146a can indirectly repress expression of CCNE1 (Cyclin E1), CCL2 (MCP-1), HIF-1A (HIF-1α), and TGFB1 (TGF-β) through targeting of HuR. Downregulation of these genes and others can affect numerous hallmarks of cancer simultaneously, including cell proliferation, inflammation, angiogenesis, cell survival, and immune evasion. Our work provides further evidence supporting a tumor suppressive role for miR-146a in NSCLC.
Materials and methods
Mammalian cell culture
A549 and Beas2B cells (ATCC) were grown in Dulbeccoʼs Modified Eagleʼs Medium (DMEM, Sigma-Aldrich), and H1975 and H1299 cells (ATCC) were grown in Roswell Park Memorial Institute-1640 Medium (RPMI, Sigma-Aldrich). All media were supplemented with 10% FBS, 4 mM L-glutamine, and 1% Penicillin/Streptomycin, and cells were incubated at 37°C in a 5% CO2 incubator.
MicroRNA transfection
Synthetic versions of miR-146a-5p and non-targeting miRNAs were purchased from Dharmacon. Hsa-miR-146a-5p mature microRNA sequence: 5ʼ-UGAGAACUGAAUUCCAUGGGUU-3ʼ. Dharmaconʼs miRIDIAN microRNA Mimic Negative Control #1 (sequence is not provided) was used as a non-targeting miRNA. A549 cells were transiently transfected with synthetic miRNAs at the indicated concentrations using INTERFERin transfection reagent (Polyplus) according to the manufacturer’s protocol. Cells were incubated for 48 hours prior to RNA and protein isolation.
RNA isolation
Total RNA was isolated from cells using TRIzol (Invitrogen) following the manufacturer’s protocol. Samples were further purified with the RNeasy Mini Kit (Qiagen) following the RNA Cleanup protocol.
RNA-sequencing (RNA-Seq) and data analysis
Next Generation RNA-Sequencing (RNA-Seq) was performed on RNA isolated from A549 cells transiently transfected with miRNA mimics using an Illumina Genome Analyser IIX instrument by the Rutgers Molecular Resource Facility staff. Samples were selected for poly(A)+ RNA prior to sequencing. Post-sequencing, data were imported to CLC Genomics Workbench (Qiagen). Each sample was quality trimmed to remove reads less than Q30. Reads were mapped to the HG19 genome annotation and gene expression in RPKM was calculated using the CLC RNA-Seq Analysis tool. Data were analysed using Ingenuity Pathway Analysis (IPA) software (Qiagen), which allows the user to see relative gene expression changes in their samples in the context of molecular pathways. Several IPA-generated pathway images are included as supplemental figures.
Gene ontology (GO) enrichment analysis
For gene ontology profiling, several filters were applied to the RNA-Seq data. The mean of the biological replicates was taken for each transcript. Any gene with a RPKM of 0 in either the miR-146a or negative control sample was excluded from further analysis. Any transcript without at least a 2-fold increase/decrease in expression between the samples was filtered out. The remaining set of genes was then subjected to g:Profiler analysis (https://biit.cs.ut.ee/gprofiler/) [14]. The following conditions were selected: Organism (Homo Sapiens), Query (filtered gene set), Options (Significant only, Hierarchical sorting – Show all terms, Output type – Graphical [PNG]), Gene Ontology (Biological process, Cellular component, Molecular Function).
Quantitative real-time RT-PCR (qRT-PCR)
Complementary DNA (cDNA) was synthesized by reverse transcription of RNA using M-MLV Reverse Transcriptase according to the manufacturer’s protocol (Invitrogen). qRT-PCR was performed using a Bio-Rad CFX96 Real-Time C1000 Touch Thermal Cycler and the following cycling conditions: (1) 94°C for 1 min, (2) 40 cycles of 94°C for 15 sec, 52–55°C for 30 sec, 68°C for 30 sec (collection step). Please see Supplemental Table 1 for relevant information regarding primers. Amplification was performed using a SYBR Green master mix containing Hot Start Taq DNA Polymerase (New England Biolabs). No template and no Reverse Transcriptase (–RT) controls were implemented to ensure samples were not contaminated. Melt curve analysis and electrophoresis of amplified products were performed as well. Quantitative Comparative CT (ΔΔCT) analysis was used to analyse gene expression changes relative to GAPDH. qRT-PCR data represent the average of at least three independent experiments. Each sample was measured with n≥ 2 technical replicates per target gene per independent experiment.
Kaplan-Meier survival analysis
The Kaplan-Meier Plotter online tool specific for NSCLC (www.kmplot.com) was used to analyse any potential correlation between overall survival and specific gene expression. This tool was generated using compiled data from multiple cancer patient transcriptomic studies and R statistical software [34]. Gene expression was designated to be low or high in patients based on their relation to the median value. The KM Plotter tool then generated survival curves, and logrank P values and hazard ratios (HR) with 95% confidence intervals were calculated and plotted in R.
Survival rates and expression data for miR-146a-5p were obtained from The Cancer Genome Atlas (TCGA) and analysed using R programming language and the TCGA-Assembler 2 package [48]. Raw miR-Seq datasets (mir_GA.hg19.mirbase20, mir_HiSeq.hg19.mirbase20) were selected for NSCLC. The miR-Seq datasets were combined and miR-146a expression was extracted. Clinical data were also extracted using TCGA-Assembler 2. Clinical data were matched with miR-146a expression data and analysed using the R packages ‘survminer’ and ‘survival’. Analysed data were graphed using ‘ggplot2’. Significance and confidence intervals were determined using the ‘survminer’ interval pvalue and conf.int functions. These functions compute significance and confidence intervals using the log-rank test and 95% upper/lower bounds, respectively.
Western blot analysis
Total protein was isolated from cells by lysing them in 1X RIPA buffer for 30 minutes on ice. Western blots were carried out as described previously [10]. Proteins were detected using HyGlo Quick Spray (Denville Scientific) and a chemiluminescence detection instrument (myECL, Thermo Fisher Scientific). Mouse anti-human HuR monoclonal antibody was a gift from Dr. Jack Keene (Duke University) and was diluted 1:200. α-tubulin horseradish peroxidase (HRP)-conjugated antibody was purchased from ProteinTech and diluted 1:2000. Goat anti-mouse HRP-conjugated secondary antibody was purchased from Thermo Fisher Scientific and diluted 1:2000. All antibodies were diluted in 5% non-fat milk + PBSt. All western blots were performed at least three times.
Doxycycline-induced miR-146a expression
Clones of H1299 cells inducibly expressing miR-146a in the presence of doxycycline were generated using the Retro-X Tet-On 3G inducible expression system (Clontech), as described previously [10]. H1299 Tet/TRE-empty and H1299 Tet/TRE-miR-146a cells were cultured, where indicated, in 1 μg/mL doxycycline. All cells were cultured in RPMI supplemented with 10% Tet System Approved FBS (Clontech) and 4 mM L-glutamine.
Enzyme-linked immunosorbent assay (ELISA)
A549, H1975, H1299, and Beas2B cells were seeded in 12-well plates at a density of 1 × 10⁵ cells/well and allowed to grow undisturbed for 48 hours. Supernatants were removed from the cells and centrifuged at 2,000 x g, 10 min, 4°C. These cell-free supernatants were then analysed using the LEGEND MAX™ Human MCP-1/CCL2 ELISA Kit (BioLegend) according to the manufacturer’s provided protocol. A similar assay was carried out on A549 cells transiently transfected with 50 nM miRNA mimics. All samples were diluted 1:5 with Assay Buffer A prior to analysis. A standard curve was generated to determine CCL2 concentration in pg/mL. The final concentration of each sample was determined by multiplying the calculated concentration by 5. When displayed as relative values, the final CCL2 concentration for each sample was normalized to its respective protein concentration. The data represent the average of at least three independent experiments. Each sample was measured with n≥ 2 technical replicates.
Plasmids
The pLightSwitch_3UTR Renilla luciferase reporter vector and a clone containing the full human GAPDH 3ʹ UTR were purchased from SwitchGear Genomics. The full human CCL2 3ʼ UTR was cloned into the multiple cloning site downstream of RenSP, the optimized Renilla luciferase open reading frame under the control of the RPL10 constitutively active promoter. pcDNA3.1(+)-HuR-FLAG, an expression vector for HuR, was a gift from Dr. Dan Dixon (University of Kansas). Please see Supplemental Table 2 for relevant primer sequences and other cloning information.
MicroRNA/DNA co-transfection
For rescue experiments, A549 cells were co-transfected with 50 nM synthetic miRNA mimics and pcDNA3.1(+)-HuR-FLAG using TransIT-X2® transfection reagent (Mirus) according to the manufacturer’s suggested protocol. Cells were incubated for 48 hours prior to RNA isolation.
Luciferase assays
A549 cells were seeded in a 24-well plate format at a density of 0.5 × 10⁵ cells/well. Twenty-four hours after seeding, cells were co-transfected with 500 ng/well luciferase construct and 50 nM synthetic miRNA (miR-146a or non-targeting miRNA) using TransIT-X2® transfection reagent. In indicated cases, pcDNA3.1(+)-HuR-FLAG was also co-transfected. Forty hours post-transfection, cells were washed with cold 1X PBS and lysed with 250 μL 1X Passive Lysis Buffer (Promega). Luciferase activity (luminescence) was measured using the Renilla-Glo luciferase assay system (Promega). Briefly, 50 μL of each lysate was added to a well of a 96-well black-bottom plate and incubated with 50 μL of 1X Renilla-Glo Luciferase Assay Reagent (Promega) for 10 min at room temperature in the dark. Luminescence was then read using a plate reader. Renilla luciferase activity from pLightSwitch_CCL2 3ʼ UTR was normalized to activity obtained from samples transfected with pLightSwitch_GAPDH 3ʼ UTR under the same miRNA condition. All samples were further normalized to the protein concentration of each lysate as determined by a Bradford assay. All assays were conducted in independent triplicates or quadruplicates.
Data analysis
Data are expressed as mean ± 1SD. Significance was determined using a two-tailed independent sample Studentʼs t-test. p-values < 0.05 were considered significant.
Funding Statement
This work was supported by the New Jersey Commission on Cancer Research with Pre-Doctoral Fellowships to JRI and ALC and a Bridge Grant to CSL, and by the American Heart Association with Grant-in-aid 15GRNT23240019 to CSL. Research reported in this publication was supported by the National Institute Of Arthritis And Musculoskeletal And Skin Diseases of the National Institutes of Health under Award Number R01AR069044. The content is solely the responsibility of the authors and does not necessarily represent the official views of the National Institutes of Health.
Acknowledgments
We are very grateful for the assistance from Dr. Bob Donnelly and the Rutgers Molecular Resource Facility with our RNA-Seq data analysis. We also thank Dr. Utz Herbig (Rutgers – New Jersey Medical School) and Dr. David Lukac (Rutgers – New Jersey Medical School) for valuable plasmids. Dr. Jack Keene (Duke University) and Dr. Dan Dixon (University of Kansas) both provided us with helpful advice and reagents pertaining to the HuR experiments. The SYBR Green was generously gifted to us by Dr. LaTasha Fraser (Rutgers – Public Health Research Institute) and Dr. Salvatore Marras (Rutgers – Public Health Research Institute), which made our extensive qRT-PCR studies possible.
Disclosure statement
No potential conflict of interest was reported by the authors.
Supplementary material:
Supplemental data for this article can be accessed here.
References
- [1].Bartel DP. MicroRNAs: target recognition and regulatory functions. Cell. 2009. January 23;136(2):215–233. [DOI] [PMC free article] [PubMed] [Google Scholar]
- [2].Ha TY. MicroRNAs in human diseases: from cancer to cardiovascular disease. Immune Netw. 2011. June;11(3):135–154. [DOI] [PMC free article] [PubMed] [Google Scholar]
- [3].Adams BD, Kasinski AL, Slack FJ. Aberrant regulation and function of microRNAs in cancer. Curr Biol. 2014. August 18;24(16):R762–76. [DOI] [PMC free article] [PubMed] [Google Scholar]
- [4].Esquela-Kerscher A, Slack FJ. Oncomirs - microRNAs with a role in cancer. Nat Rev Cancer. 2006. April;6(4):259–269. [DOI] [PubMed] [Google Scholar]
- [5].Chan E, Prado DE, Weidhaas JB. Cancer microRNAs: from subtype profiling to predictors of response to therapy. Trends Mol Med. 2011. May;17(5):235–243. [DOI] [PMC free article] [PubMed] [Google Scholar]
- [6].Kawai T, Akira S. Signaling to NF-kappaB by Toll-like receptors. Trends Mol Med. 2007. November;13(11):460–469. [DOI] [PubMed] [Google Scholar]
- [7].Labbaye C, Testa U. The emerging role of MIR-146A in the control of hematopoiesis, immune function and cancer. J Hematol Oncol. 2012;5:13. [DOI] [PMC free article] [PubMed] [Google Scholar]
- [8].Iacona JR, Lutz CS. miR-146a-5p: Expression, regulation, and functions in cancer. Wiley Interdiscip Rev: RNA 2019. July;10(4):e1533. [DOI] [PubMed] [Google Scholar]
- [9].Cornett AL, Lutz CS. Regulation of COX-2 expression by miR-146a in lung cancer cells. RNA. 2014. September;20(9):1419–1430. [DOI] [PMC free article] [PubMed] [Google Scholar]
- [10].Iacona JR, Monteleone NJ, Lutz CS. miR-146a suppresses 5-lipoxygenase activating protein (FLAP) expression and Leukotriene B4 production in lung cancer cells. Oncotarget. 2018. June 1;9(42):26751–26769. [DOI] [PMC free article] [PubMed] [Google Scholar]
- [11].Chen G, Umelo IA, Lv S, et al. miR-146a inhibits cell growth, cell migration and induces apoptosis in non-small cell lung cancer cells. PloS One. 2013;8(3):e60317. [DOI] [PMC free article] [PubMed] [Google Scholar]
- [12].Li YL, Wang J, Zhang CY, et al. MiR-146a-5p inhibits cell proliferation and cell cycle progression in NSCLC cell lines by targeting CCND1 and CCND2. Oncotarget. 2016. Sep 13;7(37):59287–59298. [DOI] [PMC free article] [PubMed] [Google Scholar]
- [13].Martinez NJ, Walhout AJ. The interplay between transcription factors and microRNAs in genome-scale regulatory networks. Bioessays. 2009. April;31(4):435–445. [DOI] [PMC free article] [PubMed] [Google Scholar]
- [14].Reimand J, Arak T, Adler P, et al. g:Profiler-a web server for functional interpretation of gene lists (2016 update). Nucleic Acids Res. 2016. July 8;44(W1):W83–9. [DOI] [PMC free article] [PubMed] [Google Scholar]
- [15].Behrens C, Feng L, Kadara H, et al. Expression of interleukin-1 receptor-associated kinase-1 in non-small cell lung carcinoma and preneoplastic lesions. Clin Cancer Res off J Am Assoc Cancer Res. 2010. January 1;16(1):34–44. [DOI] [PMC free article] [PubMed] [Google Scholar]
- [16].Starczynowski DT, Lockwood WW, Delehouzee S, et al. TRAF6 is an amplified oncogene bridging the RAS and NF-kappaB pathways in human lung cancer. J Clin Invest. 2011. October;121(10):4095–4105. [DOI] [PMC free article] [PubMed] [Google Scholar]
- [17].Yang H, Wang L, Zhao J, et al. TGF-beta-activated SMAD3/4 complex transcriptionally upregulates N-cadherin expression in non-small cell lung cancer. Lung Cancer. 2015. March;87(3):249–257. [DOI] [PubMed] [Google Scholar]
- [18].Cheung KS, Sposito N, Stumpf PS, et al. MicroRNA-146a regulates human foetal femur derived skeletal stem cell differentiation by down-regulating SMAD2 and SMAD3. PloS One. 2014;9(6):e98063. [DOI] [PMC free article] [PubMed] [Google Scholar]
- [19].Sun Y, Li Y, Wang H, et al. miR-146a-5p acts as a negative regulator of TGF-beta signaling in skeletal muscle after acute contusion. Acta Biochim Biophys Sin (Shanghai). 2017. July 1;49(7):628–634. [DOI] [PubMed] [Google Scholar]
- [20].Karthikeyan A, Gupta N, Tang C, et al. Microglial SMAD4 regulated by microRNA-146a promotes migration of microglia which support tumor progression in a glioma environment. Oncotarget. 2018. May 18;9(38):24950–24969. [DOI] [PMC free article] [PubMed] [Google Scholar]
- [21].Pu W, Shang Y, Shao Q, et al. miR-146a promotes cell migration and invasion in melanoma by directly targeting SMAD4. Oncol Lett. 2018. May;15(5):7111–7117. [DOI] [PMC free article] [PubMed] [Google Scholar]
- [22].Kim DH, Chang MS, Yoon CJ, et al. Epstein-Barr virus BARF1-induced NFkappaB/miR-146a/SMAD4 alterations in stomach cancer cells. Oncotarget. 2016. December 13;7(50):82213–82227. [DOI] [PMC free article] [PubMed] [Google Scholar]
- [23].Xiao B, Zhu ED, Li N, et al. Increased miR-146a in gastric cancer directly targets SMAD4 and is involved in modulating cell proliferation and apoptosis. Oncol Rep. 2012. February;27(2):559–566. [DOI] [PubMed] [Google Scholar]
- [24].Lutz CS, Cornett AL. Regulation of genes in the arachidonic acid metabolic pathway by RNA processing and RNA-mediated mechanisms. Wiley Interdiscip Rev: RNA 2013. Sep-Oct;4(5):593–605. [DOI] [PubMed] [Google Scholar]
- [25].Sampey AV, Monrad S, Crofford LJ. Microsomal prostaglandin E synthase-1: the inducible synthase for prostaglandin E2. Arthritis Res Ther. 2005;7(3):114–117. [DOI] [PMC free article] [PubMed] [Google Scholar]
- [26].Zhou YX, Zhao W, Mao LW, et al. Long non-coding RNA NIFK-AS1 inhibits M2 polarization of macrophages in endometrial cancer through targeting miR-146a. Int J Biochem Cell Biol. 2018;104:25–33. [DOI] [PubMed] [Google Scholar]
- [27].Wang C, Zhang W, Zhang L, et al. miR-146a-5p mediates epithelial-mesenchymal transition of oesophageal squamous cell carcinoma via targeting Notch2. Br J Cancer. 2016. December 6;115(12):1548–1554. [DOI] [PMC free article] [PubMed] [Google Scholar]
- [28].Mei J, Bachoo R, Zhang CL. MicroRNA-146a inhibits glioma development by targeting Notch1. Mol Cell Biol. 2011. September;31(17):3584–3592. [DOI] [PMC free article] [PubMed] [Google Scholar]
- [29].Comer BS, Camoretti-Mercado B, Kogut PC, et al. MicroRNA-146a and microRNA-146b expression and anti-inflammatory function in human airway smooth muscle. Am J Physiol Lung Cell Mol Physiol. 2014. November 1;307(9):L727–34. [DOI] [PMC free article] [PubMed] [Google Scholar]
- [30].Nguyen MA, Karunakaran D, Geoffrion M, et al. Extracellular vesicles secreted by atherogenic macrophages transfer microRNA to inhibit cell migration. Arterioscler Thromb Vasc Biol. 2018. January;38(1):49–63. [DOI] [PMC free article] [PubMed] [Google Scholar]
- [31].Cheng HS, Sivachandran N, Lau A, et al. MicroRNA-146 represses endothelial activation by inhibiting pro-inflammatory pathways. EMBO Mol Med. 2013. July;5(7):949–966. [DOI] [PMC free article] [PubMed] [Google Scholar]
- [32].Abdelmohsen K, Gorospe M. Posttranscriptional regulation of cancer traits by HuR. Wiley Interdiscip Rev: RNA 2010. Sep-Oct;1(2):214–229. [DOI] [PMC free article] [PubMed] [Google Scholar]
- [33].Srikantan S, Gorospe M. HuR function in disease. Front Biosci. 2012;17:189–205. [DOI] [PMC free article] [PubMed] [Google Scholar]
- [34].Gyorffy B, Surowiak P, Budczies J, et al. Online survival analysis software to assess the prognostic value of biomarkers using transcriptomic data in non-small-cell lung cancer. PloS One. 2013;8(12):e82241. [DOI] [PMC free article] [PubMed] [Google Scholar]
- [35].Kudo-Saito C, Shirako H, Ohike M, et al. CCL2 is critical for immunosuppression to promote cancer metastasis. Clin Exp Metastasis. 2013. April;30(4):393–405. [DOI] [PubMed] [Google Scholar]
- [36].Arenberg DA, Keane MP, DiGiovine B, et al. Macrophage infiltration in human non-small-cell lung cancer: the role of CC chemokines. Cancer Immunol Immunother. 2000. May;49(2):63–70. [DOI] [PMC free article] [PubMed] [Google Scholar]
- [37].Salcedo R, Ponce ML, Young HA, et al. Human endothelial cells express CCR2 and respond to MCP-1: direct role of MCP-1 in angiogenesis and tumor progression. Blood. 2000. July 1;96(1):34–40. [PubMed] [Google Scholar]
- [38].Li X, Tai HH. Activation of thromboxane A2 receptor (TP) increases the expression of monocyte chemoattractant protein −1 (MCP-1)/chemokine (C-C motif) ligand 2 (CCL2) and recruits macrophages to promote invasion of lung cancer cells. PloS One. 2013;8(1):e54073. [DOI] [PMC free article] [PubMed] [Google Scholar]
- [39].Fan J, Ishmael FT, Fang X, et al. Chemokine transcripts as targets of the RNA-binding protein HuR in human airway epithelium. J Iimmunol. 2011. February 15;186(4):2482–2494. [DOI] [PMC free article] [PubMed] [Google Scholar]
- [40].Broderick JA, Zamore PD. MicroRNA therapeutics. Gene Ther. 2011. December;18(12):1104–1110. [DOI] [PMC free article] [PubMed] [Google Scholar]
- [41].Chakraborty C, Sharma AR, Sharma G, et al. Therapeutic miRNA and siRNA: moving from bench to clinic as next generation medicine. Mol Ther Nucleic Acids. 2017. September;15(8):132–143. [DOI] [PMC free article] [PubMed] [Google Scholar]
- [42].Christopher AF, Kaur RP, Kaur G, et al. MicroRNA therapeutics: Discovering novel targets and developing specific therapy. Perspect Clin Res. 2016. Apr-Jun;7(2):68–74. [DOI] [PMC free article] [PubMed] [Google Scholar]
- [43].Rusca N, Monticelli S. MiR-146a in Immunity and Disease. Mol Biol Int. 2011;2011:437301. [DOI] [PMC free article] [PubMed] [Google Scholar]
- [44].Kim JI, Lakshmikanthan V, Frilot N, et al. Prostaglandin E2 promotes lung cancer cell migration via EP4-betaArrestin1-c-Src signalsome. Mol Cancer Res. 2010. April;8(4):569–577. [DOI] [PMC free article] [PubMed] [Google Scholar]
- [45].Chandramouli A, Onyeagucha BC, Mercado-Pimentel ME, et al. MicroRNA-101 (miR-101) post-transcriptionally regulates the expression of EP4 receptor in colon cancers. Cancer Biol Ther. 2012. February 1;13(3):175–183. [DOI] [PMC free article] [PubMed] [Google Scholar]
- [46].Wang J, Wang B, Bi J, et al. Cytoplasmic HuR expression correlates with angiogenesis, lymphangiogenesis, and poor outcome in lung cancer. Med Oncol. 2011. December;28;(Suppl 1):S577–85. [DOI] [PubMed] [Google Scholar]
- [47].Wang J, Zhao W, Guo Y, et al. The expression of RNA-binding protein HuR in non-small cell lung cancer correlates with vascular endothelial growth factor-C expression and lymph node metastasis. Oncology. 2009;76(6):420–429. [DOI] [PubMed] [Google Scholar]
- [48].Wei L, Jin Z, Yang S, et al. TCGA-assembler 2: software pipeline for retrieval and processing of TCGA/CPTAC data. Bioinformatics. 2018. May 1;34(9):1615–1617. [DOI] [PMC free article] [PubMed] [Google Scholar]
Associated Data
This section collects any data citations, data availability statements, or supplementary materials included in this article.


