Abstract
Data independent acquisition mass spectrometry (DIA-MS) strategies and applications provides unique advantages for qualitative and quantitative proteome probing of a biological sample allowing constant sensitivity and reproducibility across large sample sets. These advantages in LC-MS/MS are being realized in fundamental research laboratories and are quickly transitioning into clinical research applications. However, the ability to translate raw LC-MS/MS proteomics data (high-throughput) into biological knowledge is a complex and difficult task requiring the use of many algorithms and tools for which there is no widely accepted standard or recognized best practice available. In fact many of the tools used for the biological interpretations of proteomic data were developed for use with RNA and genomic analyzes. Use of these tools inherently fail to capture the full interpretation that proteomics uniquely supplies including the dynamics of quickly reversible chemically modified states of proteins, irreversible amino acid modifications, signaling truncation events and finally, the determining the presence of protein from allele specific transcripts. This Chapter highlights key steps and publicly available algorithms required to translate DIA-MS data into knowledge.
1. Introduction
The combination of liquid chromatography (LC) and tandem mass spectrometry (MS/MS) is a technology frequently applied to high-throughput peptide and protein identification, and quantification. The most common strategy for peptide identification utilizes a data-dependent acquisition (DDA) approach (review see Bantscheff et al. 2012) [2] [3]. In this approach the instrument sequentially surveys “all” the peptide ions that elute from the LC column at a particular time (MS1 scans), followed by consecutive individual ion isolation and fragmentation events that ultimately assay only a subset of peptides based on their signal intensity and limited by time to generate their MS/MS (MS2) fragmentation spectra. The acquired mass spectra, both the parent ion mass and the corresponding fragmentation spectra, are matched against theoretical spectra (generated from a sequence database) by a search engine, which then assigns peptide sequences and infers the corresponding proteins (review see Nesvizhskii 2007) [4].
DDA allows the identification of an extensive number of proteins and has been a breakthrough for high-throughput proteomics. However, DDA performance declines as sample complexity increases because of inconsistent sampling of all the same ions across a sample set due to the semi-stochastic selection of precursor ions and time dependent selected of co-eluting precursor ions. Therefore, DDA discovery proteomics experiments tend to have low reproducibility [5], particularly for the lower abundant ions. Some improvement in the coverage of the ions selected for MS/MS is observed by conducting multiple technical replicates.
An alternative to DDA-MS workflow is data-independent acquisition (DIA) (Figure 1). In DIA, MS/MS scans are collected systematically and independent of precursor information. The DIA strategies are based on acquiring fragment ion information for “all” precursor ions by repeatedly cycling through predefined sequential m/z windows (DIA MS/MS spectra) over the whole chromatographic elution range generating multiplexed fragment ion spectrum of all analytes that exist in the m/z range covered (see Note 1). We will concentrate on Sequential Window Acquisition of all Theoretical Mass Spectra (SWATH), which is a two-step process that combines DIA with a preselected peptide library that is used for quantification [6, 7]. This DIA-MS approach is an extension to other MS approaches such as 1) the collection of fragmentation data without precursor ion selection [8], 2) the use of ion mobility spectrometry-CID-time of flight mass spectrometry [9], 3) the use of wide isolation windows [10], and 4) the use of narrow isolation windows combined with many injections [11].
Figure 1. Data Dependent Acquisition Mass Spectrometry vs. Data Independent Acquisition Mass Spectrometry.
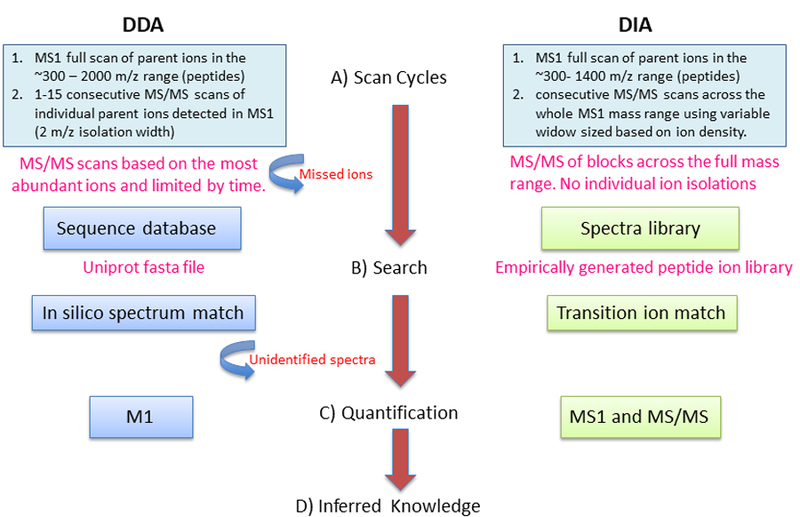
(A) Scan Cycles: DDA, only fragment ion (MS/MS) spectra for selected precursor ions detectable in a survey (MS1) scan are generated. DIA, fragment ion spectra (MS/MS) for all the analytes detectable within the m/z precursor range are recorded.
(B) Search: DDA, fragment ion spectra are assigned to their corresponding peptide sequences by seqeunce database seraching. DIA analysis are based on targeted data extraction, in which peptide ions from a spectral library are queried against experimental data to find the best matching fragment ion masses and respective intesnities.
(C) Quantification: DDA, peptides (and then proteins) are quantified using MS1 signal or spectral counts. DIA computes protein abundance based on selection of transition ion from MS/MS spectra.
(D)Translation of large scale peptide/proteins quantified into knowledge.
The key advantage of DIA is the ability to reproducibly measure large numbers of proteins across multiple samples. By design, a DIA experiment ensures selection of “all” ions present for MS/MS analysis and thereby ensures coverage of proteotypic peptides, i.e. the peptides experimentally proven to be the most consistently detected and quantifiably for a given protein. The characteristics of these selected peptides must match those used for high quality targeted MS-based approaches like those of multiple reaction monitoring (MRM) assays [12]. Having these preselected proteotypic peptides to represent the proteins within the library will be the corner stone for not only accurate protein quantification but for the ability to select a lower limit of detection and quantification. Furthermore, because SWATH provides fragmentation information for all ions within the selected mass range, the analysis will include peptides containing PTM amino acid residue(s), specific splice variants, as well as any peptides carrying a non-synonymous single nucleotide polymorphism (SNPs).
The majority of DIA techniques, such as SWATH, focus on quantifying a large number of proteins within a biological sample, and do not include the analysis of site-specific PTMs. However, PTMS are routinely tracked as disease markers while many others are used as molecular targets for developing target-specific therapies. Their importance to biological interpretation is irrefutable and a large scale in-depth understanding of protein PTMs is important for gaining a perception of a wide array of cellular functions. The computational analysis of modified peptides was pioneered 20 years ago by Yates et al [13] and Mann and Wilm [14] and is still an active area of research. Currently, MS methods can detect >300 types of PTMs, and many more have yet to be discovered [15] and [16]. PTM-search algorithms can be categorized into three large groups: targeted, untargeted and de novo PTM-search methods [17].
DIA-MS techniques overcome the scalability that limits targeted MRM assays to a short list of preselected peptides. DIA experiments are capable of producing quantitative data on 1000(s) of proteins with less effort, and shorter time frame than traditional DDA shot-gun experiments, which rely on multidimensional fractionation and multiple MS runs to obtain the same depth [6, 7]. The most popular DIA MS platforms currently are Q Exactive Orbitrap mass spectrometer from Thermo Scientific (Orbitrap), the SCIEX SWATH 2.0, together with their recent triple TOF system (TripleTOF 6600™), followed by high-definition MSE (HDMSE) and ultra-definition MSE (UDMSE) by Waters.
One advantage of DIA-MS for PTM analysis is lower limit of detection and quantitation. PTMs are often sub-stoichiometric and therefore the less abundant species of molecules within any proteome sample. Albeit, the gain in sensitivity comes at the expense of the wider isolation windows that may interfere with the ability to accurately confirm PTM localization. This is not a problem if there are not multpiple residues within the peptide that could possess the PTM or if the exact residue is not of interest. Otherwise, a secondary experiment for proper confirmation maybe required. Additionally, DIA experiments provide an alternative approach to novel PTM identification that depends upon established peptide transition ions from a pre-generated ion library rather than matching an in silico digest of specified PTMs. All modified versions of a given peptide with share transition ions of the unmodified fragment ions allowing one to identify novel PTMs of a given peptide based on parent ion mass shifts and changes in retention time, if expected. This opens completely novel opportunities to discover (and quantify) unanticipated modified peptide species from DIA data sets by a strategy that does not suffer from the combinatorial explosion of the search space usually experienced with traditional PTM database search approaches [18].
PTM analysis by DIA-MS has proven to be extremely useful in the analysis and quantitation of citrullinated proteins. Citrullination is an irreversible deimidation of arginine residues within a protein carried out by enzymatic reaction. This modification leads to the loss of a positive charge and reduction in hydrogen-bonding ability [18]. This modification plays a role in several physiological and pathological processes such as epigenetics, apoptosis and cancer. However, it is rarely studied because a citrullinated protein or peptide is difficult to discern from its native non-citrullinated form and because the PTM is low abundant, necessitating highly specific and sensitive detection techniques. A recent publication by Fert-Bober showed how building tissue specific PTM library increased the accurate detection and quantification of low abundant citrullinated peptides that would have not been possible otherwise [19].
DIA-MS techniques overcome the scalability that limits targeted MRM assays to a short list of preselected peptides. In practice, all peptides within the defined mass-to-charge (m/z) window are fragmented collectively in m/z blocks across the full m/z range being covered in DIA [7]. DIA experiments are capable of producing quantitative data on 1000(s) of proteins with less effort, and shorter time frame than traditional DDA shot-gun experiments, which rely on multidimensional fractionation and multiple MS runs to obtain the same depth [6, 7]. The most popular DIA MS platforms currently are Q Exactive Orbitrap mass spectrometer from Thermo Scientific (Orbitrap), the SCIEX SWATH 2.0, together with their recent triple TOF system (TripleTOF 6600™), followed by high-definition MSE (HDMSE) and ultra-definition MSE (UDMSE) by Waters.
There are a number of features that MS data search algorithms share with respect to preprocessing and post-processing MS data, although the method, format, and information provided can vary significantly. Common features include the handling of protein and peptide sequences, the parsing of results from various proteomics search engines output files, the visualization of MS-related information, and the inference of biological interpretation. Robust tools for data analysis are required to analyze the MS/MS spectra, and to translate these large-scale proteome data into biological knowledge. In the area of DIA informatics, there are several computational software / algorithms available for analyzing DIA data (Table 1) that perform the extraction of peptide identifications and quantitation from the raw spectral data files using an empirically generated spectra library, which can be derived from DDA [20] or DIA data.
Table 1.
Common Software Applications for the Analysis of DIA-MS Spectra Data.
| Software | Input spectra format | Type of quantitation | Reference | Website |
|---|---|---|---|---|
| Skyline | mzML, mzXML, mz5, other vendor specific formats | MS2 | MacLean et al. 2010 | https://brendanx-uwl.gs.washington.edu/labkey/project/home/software/Skyline/begin.view |
| Open Swath | msML, mzXML | MS2 | Röst et al. 2014 | http://www.openswath.org |
| Spectronaut (Biognosys) | HTRMS, WIFF, RAW | MS1. MS2 | Reiter et al. 2011 | https://shop.biognosys.ch/spectronaut |
| PeakView | WIFF | MS2 | Sciex | http://sciex.com/products/software/peakview.-software |
| SWATHProphet | mzML, mzXML | MS2 | Keller et al. 2016 | http://tools.proteomecenter.org/wiki/index.php?title=Software:SWATHProphet |
| DIA-Umpire | mzXML | MS2 | Tsou et al. 2015 | http://diaumpire.sourceforge.net/ |
| Pinnacle | RAW | M52 | http://www.optystech.com/home | http://www.optystech.com/ |
This Chapter provides an overview of commercially available bioinformatics tools, with the primary focus on the open source algorithms that researchers can employ when converting DIA-MS data into knowledge with step by step workflow to guide
2. Materials
Access to the internet.
Processed list of proteins and PTMs identified / quantitated in a DIA-MS experiment, see Table 1 for a list of commonly used DIA-MS algorithms.
Walkthrough examples include an example output from open source software Cytoscape: http://www.cytoscape.org/ and App Store: http://apps.cytoscape.org/
3. Methods
1. Library Considerations:
Each LC-MS run generates data consisting of peak intensities for 1000s of peptides each with specific retention time (RT) and mass-to-charge ratio (m/z) values. These aspects have been recently reviewed in the following and are common to both DIA and DDA [21]. However there are several issues such as build of MS peptide libraries and LC alignment (e.g. use of exogenous and endogenous retention time standards) that are unique to DIA. Although new methods are being developed that do not need external retention time calibration peptides (e.g. DIA-Umpire [22]) as they rely on the retention times of known commonly identified landmark peptides to perform retention time alignment across all the runs.
There are publicly available libraries (e.g. pan-human library) [23], which can be used when appropriate. But, at the same time, premade libraries may not contain cell, organ, or disease specific proteins or modified forms that are present in the sample(s) being analyzed. For example, the pan-human library will miss specific stem cell or cardiac proteins that are expressed in specific tissues or cells. To date, in our experience the best approach will be to create libraries of carefully selected peptides and transitions, that perform in DIA with tight percent coefficient of variance in a manner similar to the development of MRM or SRM targeted protein assays (see Note 2).
PeakView (http://sciex.com/products/software/peakview-software) and OpenSWATH [7] (http://www.openswath.org/ ), two commonly used algorithms for DIA-MS analysis, both rely on RT alignment of specified ions or a set of standard ions across the elution profile from any DIA run to the peptide library used to make proper peptide identifications. Peptide assignments are initially based on their parent mass, retention time (RT), a set of their fragment ions and the ratios of fragment ion relative abundances. Once peptide identification has been performed, quantitation is determined using a set of peptide fragment ions.
PeakView is available through SCIEX (http://sciex.com/products/software/peakview-software) and is a standalone software application that is compatible with all SCIEX mass spectrometer systems for the quantitative review of LC/MS and MS/MS data. For detailed methods from our group see Methods for SWATH: Data Independent Acquistion on TripleTOF Mass Spectrometers [24]. OpenSWATH [7] is available for download by the ETH Zurich group, http://www.openswath.org/openswath_instructions.html, and they provide a well documented tutorial for executing these processes. Both algorithms, PeakView and OpenSWATH, depend on a library for the DIA analysis.
2. Protein Quantification:
In order to compare protein quantification between samples (technical or biological), LC-MS runs are analyzed simultaneously. This is a challenging task as: 1) variation in exogenous supplied (iRT) [25] or endogenous (cIRT) [26] RT standards can exist across multiple runs due to the LC instrument conditions, 2) variability in sample load and the complexity of peptide mixtures, 3) variation in m/z values due to occasional drift in the calibration of the mass spectrometry instrument, and 4) variation in peak intensities due to spray conditions (in most cases this is proportional to concentration of peptides in the sample). Thus, alignment with respect to m/z and RT is necessary for quantitative comparison of proteins/peptides (see Note 3).
There are several methods for quantifying protein concentrations from DIA-MS data, including MSstats and OpenSWATH and have been recently reviewed [20]. MSstats (https://www.bioconductor.org/packages/release/bioc/html/MSstats.html): an R package for statistical analysis of quantitative mass spectrometry-based proteomic experiments [27] is an R Bioconductor package. It provides protein abundance using linear mixed model and group comparisons. Differential analysis can be helpful when comparing a disease / perturbation to a control / background.
3. Overlay on interactome:
Large-scale proteomic data ultimately shifts the burden to the downstream analysis, which requires an extensive systems biology approach for data interpretation. A researcher is actually dealing with the quantifiable proteome, or interactome depending on the experiment and questions being assessed. This is the part of the DIA pipeline where we will concentrate the remaining part of this chapter.
A major advantage to using UniProt SwissPro KB Accessions (and sequences) for protein identification is the ability to link protein-centric functional annotations to the proteins identified within the original library. There are several mapping tools available to convert between various database identifiers, for example the UniProt mapping tool (http://www.uniprot.org/uploadlists/) can map UniProt Accession numbers to other database identifiers such as RefSeq. These mapping steps are often required for downstream analysis and ultimately allow the connection of many underlying functional databases.
STRING (http://string-db.org/) is a database of known and predicted protein interactions, which include direct and indirect associations that are derived from four sources: genomic context, high-throughput experiments, co-expression, and previous knowledge (PubMed mips) [28]. It has a user-friendly interface and provides flexibility for setting various parameters like confidence. The output from STRING can also be saved in a text file format compatible with cytoscape, and therefore allows further customization for visualizing the results.
Network Analyst (http://www.networkanalyst.ca/) is another open source tool available for analyzing a list of proteins using protein-protein interaction networks [29, 30]. It has an easy to use graphical interface and proteins of interest are mapped to manually curated protein-protein interaction database to construct relevant networks. The tool provides a system for functional enrichment analysis and the results, including the network map, can be easily exported.
Cytoscape, an open-source bioinformatics software for visualizing molecular interaction networks, can be freely downloaded from http://www.cytoscape.org (Figure 2). Furthermore, cytoscape has several plugins (applications) (http://apps.cytoscape.org/apps/all) available for creating an interactome from a user input (i.e. lists of proteins). The apps can easily be installed by using the Application Manager within cytoscape (Figure 2). Reactome FI, which was originally developed for microarray data, allows a research to upload a list of genes of interest, and the algorithm will display the interactome for those candidates. There are many type of analysis that reactomeFI can execute, and the user can easily select the appropriate module (Figure 3).
Figure 2: Dowload Cytoscape and Install Plugins.
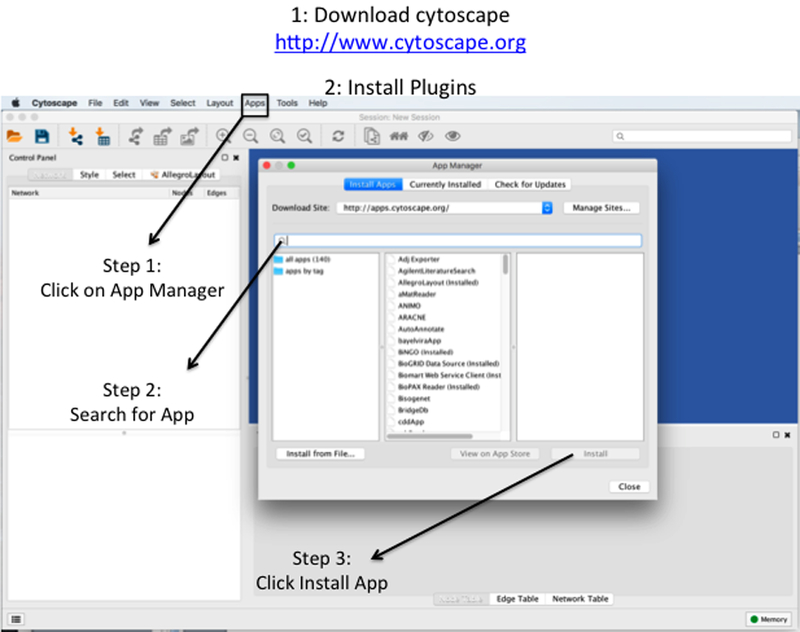
(1) Cytoscape is open-source application that can be downloaded from http://www.cytoscape.org. The application is free and avialable for Mac or Windows. The application requires Java, which is also freely avialable: http://www.oracle.com/technetwork/java/javase/downloads/jre8-downloads-2133155.html
(2) Install Plugins. Step 1: Open cytoscape and click on the Apps tab. This will cause the App Manager to appear. Step 2: Type in the search bar the name of the application of interest. Step 3: select the application of interest and click on install.
Figure 3: Overview of ReactomeFI Plugin.
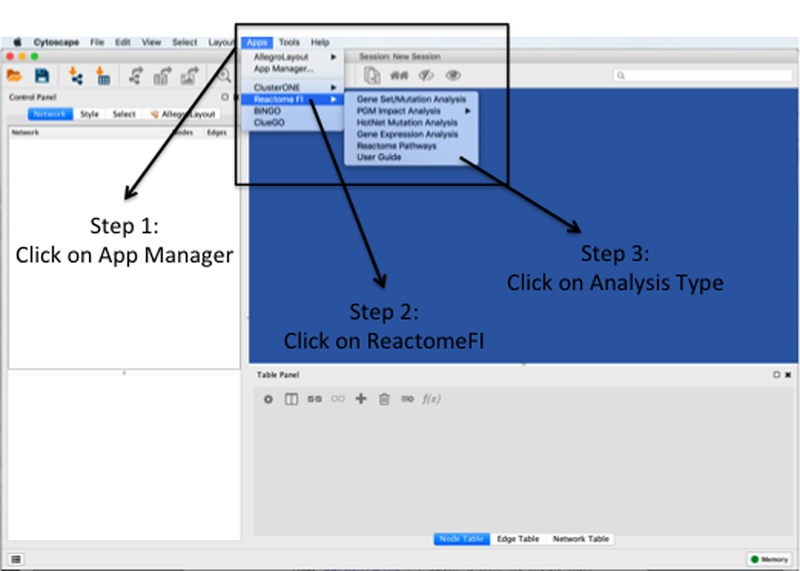
Step 1: Click on the apps tab and application installed (following Figure 2) will appear. Step 2: Select the application of intersted (i.e. reactomeFI). Step 3: Select the type of analysis to execute.
ReactomeFI enables functional enrichment analysis and easily customizable network output maps. Using the DIA-MS (SWATH) data released in [19], an interactome was generated for citrullinated proteins that were differentially regulated in cardiocytes [19] (Figure 4). The results from reactomeFI can also be analyzed via other cytoscape plug-ins, including ClusterONE [31] (Figure 5).
Figure 4: ReactomeFI Analysis of the Top Citrullinated Proteins in Heart Diseases.
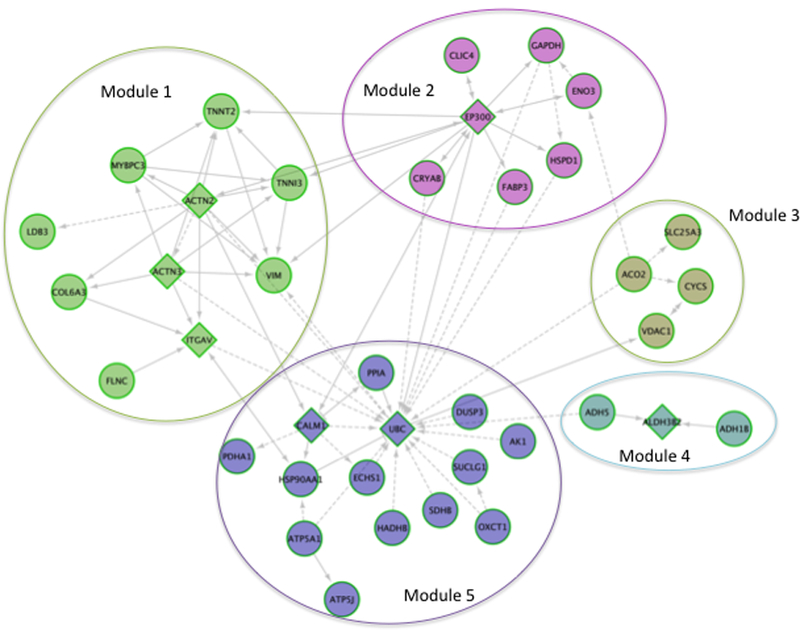
The top citrullinated proteins for [ref] were up-loaded and analyzed in cytoscape via reactomeFI. Circles nodes represent proteins that were differentially citrullinated, whereas triangle nodes represent proteins that were not reported as having differenitally citrullinated residues, but are linked to proteins, through protein-protein interactions (grey lines) that do have differentially regulated citrullinated residues. The top 3 pathways enriched per module were extracted. Module 1: Striated muscle contraction, hypertrophic cardiomyopathy, and dilated cardiomyopathy. Module 2: glycolysis/gluconeogenesis. Biosynthesis of amino acids, and validated targets of c-myc transcriptional activation. Module 3: Parkinson’s disease, The citric acid cycle and respiratory electron transport, and Huntington disease. Module 4: Tyrosine metabolism, Fatty acid degradation, and retinol metabolism. Module 5: The citric acid (TCA) cycle and respiratory electron transport, carbon metabolism, and metabolic pathway.
Figure 5: ClusterONE Analysis of an Interacome.
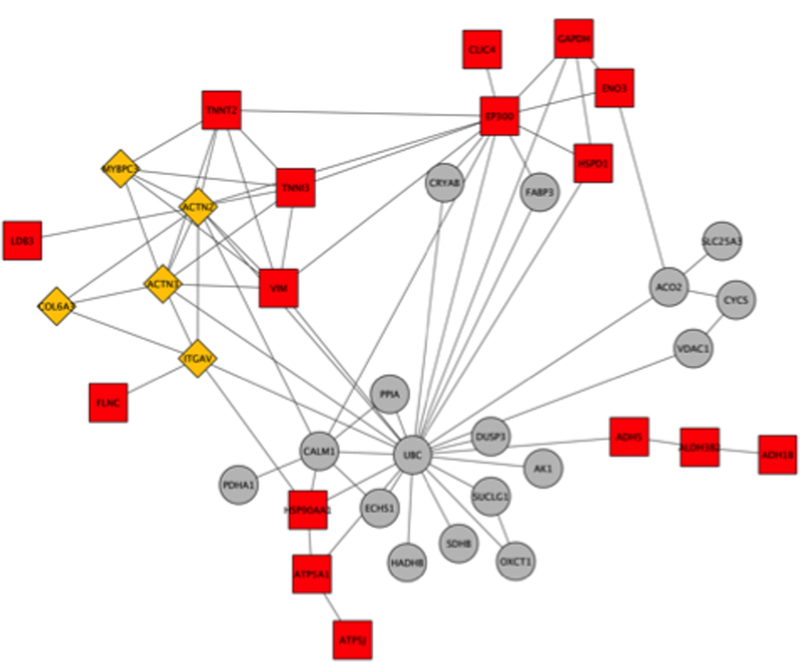
The network in Figure 2 was further analyzed in cytoscape using ClusterONE. Orange triangles are nodes that represent proteins that are highly connected within and across modules. Red squares are nodes that were clustered, whereas grey circles are outliers. The top cluster consisted of 8 proteins: COL6A3, ACTN2, ACTN3, ITGAV, VIM, TNNT2, MYBPC3, and TNNI3 (p-value 0.001, density 0.714, quality 0.625).
4. Functional enrichment analysis:
Enrichment analyses are typically performed utilizing gene ontology (GO) annotations, which are Cellular Compartment, Molecular Function, and Biological Process, and/or pathway annotations like KEGG and Reactome. Common statistical tests include Fisher Exact, or a p-value probability or chance of seeing at least x number of genes out of the total n genes in the list annotated to a particular GO. The goal is to differentiate enrichment above random background. These types of analysis can help generate new hypothesis about protein dynamics under a given biological system or enhance our current understanding of biological processes associated with a given condition.
There are several publicly available tools for gene ontology enrichment analysis, including iProXpress (http://pir.georgetown.edu/iproxpress2/), BiNGO [32], and Panther (http://geneontology.org/). BiNGO [32] is a cytoscape plugin (see Figure 2 for overview on downloading plugins) that enables functional enrichment analysis and visualization. Data can be uploaded directly from the user or from a network, and the user has the option to select various parameters and statistical tests for analyzing the data (Figure 6). Using the DIA-MS (SWATH) data released in a recent publication, an example of a functional enrichment output from BiNGO [32] was generated for citrullinated proteins that were differentially regulated in cardiocytes [19] (Figure 7).
Figure 6: Overview for Executing a BiNGO Analysis.
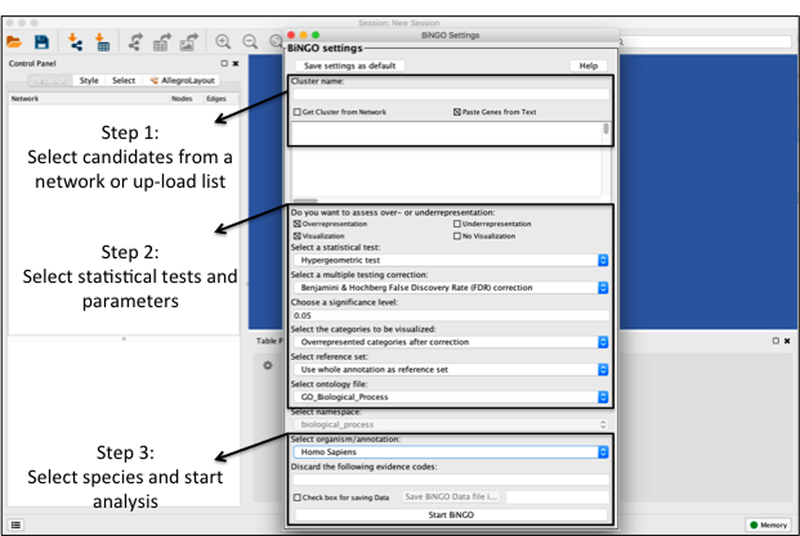
Step 1: Enter the name of the analysis and select either ‘Get Cluster from Network’ or ‘Paste Genes from Text’. Step 2: Select over or under-representation, select a staitsitcal test (i.e. hypergeometric), slect a multiple testing correction (i.e. Benjamini & Hochberg False Discovery Rate (FDR) correction, a signficance level, the categories to be visualized, reference set, and ontology type (Biological Process, Molecular Function, or Cellular Compartment). Step 3: Select the appropriate species and Start BiNGO analysis.
Figure 7: Gene Ontology (Molecular Function) Enrichment Analysis Using Bingo.
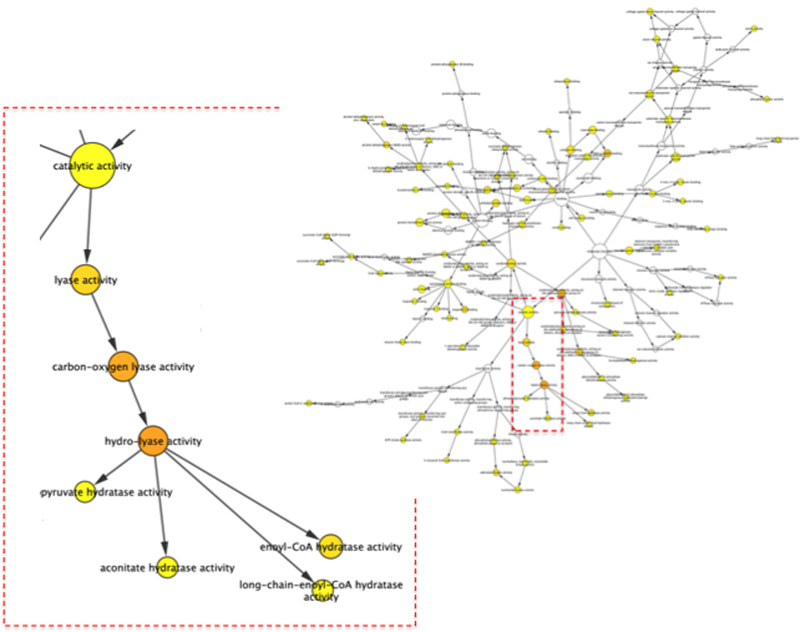
The top citrullination proteins from [36] were up-loaded into Bingo and analyzed for enriched molecular function ontologies. Orange nodes represent the most significantly enriched gene ontology terms, whereas white and yellow represent the least significantly enriched gene ontology terms. The Bingo analysis highlights the hierarchic of the ontologies. For this dataset the most enriched Molecular Function terms were: hydro-lyase activity, carbon-oxygen lyase activity, oxidoreductase activity, NAD or NADH binding, lyase activity, troponin C binding, and enoyl-CoA hydratase activity.
5. Considerations for PTM analysis:
Diversity at the protein level comes from 1) mRNA splice variants and internal start sites, 2) variants affecting the primary sequence of amino acids (e.g. SNPs), and 3) different PTMs. The large-scale study of variance due to genomic alterations typically requires next-generation sequencing techniques for DNA/RNA molecules, as a priori knowledge is not required. Proteomics data is further complicated as different forms of PTMs may occur in tandem, greatly increasing the complexity of the proteome. PTMs broadly contribute to the recent explosion of proteomic data as they possess a significant aspect to protein function.
In PTM analysis, each peptide representing a modification site of interest needs to stand alone, this is in contrast to proteome analysis were several peptides are usually taken into consideration to reveal characteristics of a single protein. Global PTM analysis remains a major challenge in the field, and is very resource demanding. MS-based proteomics provides tens of thousands of sites, raising the question of their biological relevance. Researchers are faced with the challenge of how to select a very small number of sites from large-scale data and how to perform functional follow-up on these candidates (see Note 4).
Often times it can be challenging to determine the exact location of a PTM, such as phosphorylation, and as such there are several publicly available algorithms that can applied to further assess PTM data generated MS/MS data. For example, Ascore is an algorithm that measures the probability of a correct phosphorylation site localization based on the presence and intensity of site-determining ions in MS/MS spectra [33]. Recently PTMProphet was added to the SWATHProphet software and serves as a tool to identify/annotate modifications in peptide sequences by identifying precursor ions consistent with a modification, along with the mass and localization of the modification in the peptide sequence [34]. Another algorithm for scoring/annotating PTM localization, called LuciPHOr, uses a modified target-decoy-based approach that uses mass accuracy and peak intensities for site localization scoring and false localization rate (FLR) [35].
Citrullination is another important PTM and recent advancements have enabled DIA-MS detection and bioinformatics methods have enabled the analysis for this biologically-relevant irreversible PTM, including algorithms for scoring the location of this PTM within a peptide sequence [19]. Interestingly, it has been supported that citrullination of sarcomere proteins causes a decrease in Ca(+2) sensitivity in skinned cardiomyocytes, indicating an important structural and functional alteration associated with this PTM [36].
6. Considerations for translating large proteome datasets into biological knowledge leveraging PTM data:
For DIA-MS data it is important at both the peptide level and protein level to translate the data into an integrated knowledge base. Translating large data into knowledge is a difficult task and there is no gold standard or process available. At the foundation, a system capable of linking many functional annotations together is essential. Without this type of connectivity functional enrichment analysis such as GO and pathway would be not be possible. Linking to disease databases like the Online Mendelian Inheritance in Man (OMIM), a catalog of human Mendelian disorders, which contains 20,267 entries describing 13,606 genes from ~7,000 disorders [37] helps to provide a resource for annotating clinically relevant gene / protein candidates.
Text and data mining also become invaluable resources when analyzing large datasets as it is impossible to manually research all quantified proteins in their various states across many experiments. Data mining involves integration of many biological datasets and annotations, and when utilized effectively can produce more holistic insights [38]. See review [38] for a comparison of different methods for data integration and their advantages and disadvantages. Furthermore, there are other tools for data integration and text mining, including RapidMiner, KNIME, and R Statistics, that can be customized for the end-users goals.
Often times a researcher may need to leverage ortholog mapping across species to reveal significant findings. We propose that this under-utilized aspect holds considerable value and can infer importance of a modifiable amino acid residue. This is particularly important because functionally important modification sites are more likely to be evolutionarily conserved; yet cross-species comparison of PTMs is difficult since they often lie in structurally disordered protein domains. Current tools that address this are PhosphoAitePlus [39], Phospho.ELM [40], Phosphorylation Site Database [41], PHOSIDA [42], PhosPhAt [43], PhosphOrtholog [44], NetworKIN [45], and RegPhos [46].
O-GLYCBASE [47] and dbOGAP [48] are databases for glycoproteins, most of which include experimentally verified O-linked glycosylation sites. UbiProt [49] stores experimental ubiquitylated proteins and ubiquitylation sites, which are implicated in protein degradation through an intracellular ATP-dependent proteolytic system. Furthermore, PTMScout (http://ptmscout.mit.edu.) is another web resource, that is constructed around a custom database of PTM experiments and contains information from external protein and post-translational resources, including gene ontology annotations, Pfam domains, and Scansite predictions of kinase and phosphopeptide binding domain interactions [50].
Motif analysis strategies and domain–domain interactions related to PTMs are also important aspects in translating data. Proteins having related functions may not show overall high sequence similarity, yet they may contain sequences of amino acid residues that are highly conserved within the tertiary structure of the protein. Currently, the largest collection of sequence motifs in the world is PROSITE [51] and meta site such as MOTIF [52]. PROSITE can be accessed via ExPASy (http://www.expasy.org). A free software package named MacPattern [53] is available for searching PROSITE motifs. Other, useful resources for searching protein motifs are BLOCKS [54], MOTIF Search (http://www.genome.jp/tools/motif/), MoST [55].
SysPTM [56] has designed a systematic platform for multi-type PTM research and data mining. Additionally, Human Protein Reference Database (HPRD) [57] contains a wealth of information relevant to the function of human proteins in health and disease, as well as the annotation of PTMs.
The rate of discovery for PTMs is gaining momentum and is significantly outpacing our biological understanding of the function and regulation of these modifications, and data mining techniques can enable the discovery of previously unknown patterns and relationships hidden in large datasets.
Footnotes
Notes:
DIA methods have advantages and disadvantages related to the instrument and the composition and complexity of the biological sample. Similar to DDA experiments, the instrument method of DIA experiments entails trade-offs across mass resolution and mass accuracy, scanning rates and the number of data points taken across a peak, number and width of isolation windows, and cycle times. Ultimately, DIA encompasses the strengths of both DDA and MRM approaches [6], combining shot-gun (DDA) discovery proteomics with the quantitative capabilities and high-throughput nature of targeted approaches [7].
A spectral library of identified peptides can be manually programmed, downloaded (if available) or generated by previous DDA experiments. The effectiveness of sequence searching approach depends on (1) high-quality reference spectra, with good signal-to-noise ratios and devoid of impurities, and (2) effective matching algorithms with the robustness and flexibility to accommodate imperfect matches while minimizing false matches.
It is our experience that the larger the number of samples being compared, complexity of data analysis increases due to limited scalability of current methods. It is also our experience that only selected peptides and transitions with coefficient of variances of under 20% in the DDA runs is necessary to ensure accurate quantification. This is the level of reproducibility and precision required in clinical chemistry hospital assays.
The interpretation of proteome data obtained from high-throughput methods cannot be appropriately deciphered without a priori knowledge which may come by biochemical or physiological data where specific PTM data from in vitro or in vivo is available. For example, cardiac troponin (cTnl) plays a key role in the regulation of contraction and relaxation of heart muscle. There are numerous phosphorylation sites on cTnl with and without in vitro or in vivo PKA phosphorylation [58]. Mutational data supports that residues that have been substituted as a pseudo mimetic, such as the phosphorylation of sites 22 and 23 in cTnI being replaced with Asp to mimic the negative charge, have a profound effect on the function of cTnl [59].
Contributor Information
Erin L. Crowgey, Nemours Alfred I. DuPont Hospital for Children, 1701 Rockland Road, P.O. Box 269, Wilmington, DE 19803
Andrea Matlock, Advanced Clinical BioSystems Research Institute, Cedars Sinai Medical Center, Heart Institute, 127 S. San Vicente Blvd, Los Angeles, CA 90048
Justyna Fort-Bober, Advanced Clinical BioSystems Research Institute, Cedars Sinai Medical Center, Heart Institute, 127 S. San Vicente Blvd, Los Angeles, CA 90048
Jennifer E Van Eky, Cedar Sinai, Advanced Clinical BioSystems Research Institute, Cedars Sinai Medical Center, Heart Institute, 127 S. San Vicente Blvd, Los Angeles, CA 90048.
References:
- 1.Bantscheff M, Lemeer S, Savitski MM, Kuster B (2012) Quantitative mass spectrometry in proteomics: critical review update from 2007 to the present. Anal Bioanal Chem 404:939–965. 10.1007/s00216-012-6203-4 [DOI] [PubMed] [Google Scholar]
- 2.Aebersold R, Mann M (2003) Mass spectrometry-based proteomics. Nature 422:198–207. 10.1038/nature01511 [DOI] [PubMed] [Google Scholar]
- 3.Zhang Y, Fonslow BR, Shan B, et al. (2013) Protein Analysis by Shotgun/Bottom-up Proteomics. Chem Rev 113:2343–2394. 10.1021/cr3003533 [DOI] [PMC free article] [PubMed] [Google Scholar]
- 4.Nesvizhskii AI (2007) Protein identification by tandem mass spectrometry and sequence database searching. Methods Mol Biol 367:87–119. 10.1385/1-59745-275-0:87 [DOI] [PubMed] [Google Scholar]
- 5.Bateman NW, Goulding SP, Shulman NJ, et al. (2014) Maximizing Peptide Identification Events in Proteomic Workflows Using Data-Dependent Acquisition (DDA). Mol {&} Cell Proteomics 13:329–338. 10.1074/mcp.M112.026500 [DOI] [PMC free article] [PubMed] [Google Scholar]
- 6.Gillet LC, Navarro P, Tate S, et al. (2012) Targeted data extraction of the MS/MS spectra generated by data-independent acquisition: a new concept for consistent and accurate proteome analysis. Mol {&} Cell proteomics MCP 11: 10.1074/mcp.O111.016717 [DOI] [PMC free article] [PubMed] [Google Scholar]
- 7.Röst HL, Rosenberger G, Navarro P, et al. (2014) OpenSWATH enables automated, targeted analysis of data-independent acquisition MS data. Nat Biotechnol 32:219–223. 10.1038/nbt.2841 [DOI] [PubMed] [Google Scholar]
- 8.Purvine S, Eppel J-T, Yi EC, Goodlett DR (2003) Shotgun collision-induced dissociation of peptides using a time of flight mass analyzer. Proteomics 3:847–850. 10.1002/pmic.200300362 [DOI] [PubMed] [Google Scholar]
- 9.Myung S, Lee YJ, Moon MH, et al. (2003) Development of High-Sensitivity Ion Trap Ion Mobility Spectrometry Time-of-Flight Techniques: A High-Throughput Nano-LC-IMS-TOF Separation of Peptides Arising from a Drosophila Protein Extract. Anal Chem 75:5137–5145. 10.1021/ac030107f [DOI] [PubMed] [Google Scholar]
- 10.Venable JD, Dong M-Q, Wohlschlegel J, et al. (2004) Automated approach for quantitative analysis of complex peptide mixtures from tandem mass spectra. Nat Methods 1:39–45. 10.1038/nmeth705 [DOI] [PubMed] [Google Scholar]
- 11.Panchaud A, Jung S, Shaffer SA, et al. (2011) Faster, Quantitative, and Accurate Precursor Acquisition Independent From Ion Count. Anal Chem 83:2250–2257. 10.1021/ac103079q [DOI] [PMC free article] [PubMed] [Google Scholar]
- 12.Carr SA, Abbatiello SE, Ackermann BL, et al. (2014) Targeted Peptide Measurements in Biology and Medicine: Best Practices for Mass Spectrometry-based Assay Development Using a Fit-for-Purpose Approach. Mol Cell Proteomics 13:907–917. 10.1074/mcp.M113.036095 [DOI] [PMC free article] [PubMed] [Google Scholar]
- 13.Yates JR, Eng JK, McCormack AL, Schieltz D (1995) Method to correlate tandem mass spectra of modified peptides to amino acid sequences in the protein database. Anal Chem 67:1426–1436. [DOI] [PubMed] [Google Scholar]
- 14.Mann M, Wilm M (1995) Electrospray mass spectrometry for protein characterization. Trends Biochem Sci 20:219–224. [DOI] [PubMed] [Google Scholar]
- 15.Witze ES, Old WM, Resing KA, Ahn NG (2007) Mapping protein post-translational modifications with mass spectrometry. Nat Methods 4:798–806. 10.1038/nmeth1100 [DOI] [PubMed] [Google Scholar]
- 16.Jensen ON (2004) Modification-specific proteomics: characterization of post-translational modifications by mass spectrometry. Curr Opin Chem Biol 8:33–41. 10.1016/j.cbpa.2003.12.009 [DOI] [PubMed] [Google Scholar]
- 17.Tsur D, Tanner S, Zandi E, et al. (2005) Identification of post-translational modifications by blind search of mass spectra. Nat Biotechnol 23:1562–1567. 10.1038/nbt1168 [DOI] [PubMed] [Google Scholar]
- 18.György B, Tóth E, Tarcsa E, et al. (2006) Citrullination: a posttranslational modification in health and disease. Int J Biochem Cell Biol 38:1662–77. 10.1016/j.biocel.2006.03.008 [DOI] [PubMed] [Google Scholar]
- 19.Fert-Bober J, Giles JT, Holewinski RJ, et al. (2015) Citrullination of myofilament proteins in heart failure. Cardiovasc Res 108:232–242. 10.1093/cvr/cvv185 [DOI] [PMC free article] [PubMed] [Google Scholar]
- 20.Bilbao A, Varesio E, Luban J, et al. (2015) Processing strategies and software solutions for data-independent acquisition in mass spectrometry. Proteomics 15:964–980. 10.1002/pmic.201400323 [DOI] [PubMed] [Google Scholar]
- 21.Nesvizhskii AI (2010) A survey of computational methods and error rate estimation procedures for peptide and protein identification in shotgun proteomics. J Proteomics 73:2092–2123. 10.1016/j.jprot.2010.08.009 [DOI] [PMC free article] [PubMed] [Google Scholar]
- 22.Tsou C-C, Avtonomov D, Larsen B, et al. (2015) DIA-Umpire: comprehensive computational framework for data-independent acquisition proteomics. Nat Methods 12:258–264. 10.1038/nmeth.3255 [DOI] [PMC free article] [PubMed] [Google Scholar]
- 23.Rosenberger G, Koh CC, Guo T, et al. (2014) A repository of assays to quantify 10,000 human proteins by SWATH-MS. Sci Data 1:140031 10.1038/sdata.2014.31 [DOI] [PMC free article] [PubMed] [Google Scholar]
- 24.Holewinski RJ, Parker SJ, Matlock AD, et al. (2016) Methods for SWATH™: Data Independent Acquisition on TripleTOF Mass Spectrometers pp 265–279 [DOI] [PubMed]
- 25.Escher C, Reiter L, MacLean B, et al. (2012) Using iRT, a normalized retention time for more targeted measurement of peptides. Proteomics 12:1111–1121. 10.1002/pmic.201100463 [DOI] [PMC free article] [PubMed] [Google Scholar]
- 26.Parker SJ, Rost H, Rosenberger G, et al. (2015) Identification of a Set of Conserved Eukaryotic Internal Retention Time Standards for Data-independent Acquisition Mass Spectrometry. Mol {&} Cell Proteomics 14:2800–2813. 10.1074/mcp.O114.042267 [DOI] [PMC free article] [PubMed] [Google Scholar]
- 27.Choi M, Chang C-Y, Clough T, et al. (2014) MSstats: an R package for statistical analysis of quantitative mass spectrometry-based proteomic experiments. Bioinformatics 30:2524–2526. 10.1093/bioinformatics/btu305 [DOI] [PubMed] [Google Scholar]
- 28.Szklarczyk D, Franceschini A, Wyder S, et al. (2015) STRING v10: protein-protein interaction networks, integrated over the tree of life. Nucleic Acids Res 43:D447–52. 10.1093/nar/gku1003 [DOI] [PMC free article] [PubMed] [Google Scholar]
- 29.Xia J, Gill EE, Hancock REW (2015) NetworkAnalyst for statistical, visual and network-based meta-analysis of gene expression data. Nat Protoc 10:823–844. 10.1038/nprot.2015.052 [DOI] [PubMed] [Google Scholar]
- 30.Xia J, Benner MJ, Hancock REW (2014) NetworkAnalyst - integrative approaches for protein-protein interaction network analysis and visual exploration. Nucleic Acids Res 42:W167–W174. 10.1093/nar/gku443 [DOI] [PMC free article] [PubMed] [Google Scholar]
- 31.Nepusz T, Yu H, Paccanaro A (2012) Detecting overlapping protein complexes in protein-protein interaction networks. Nat Methods 9:471–472. 10.1038/nmeth.1938 [DOI] [PMC free article] [PubMed] [Google Scholar]
- 32.Maere S, Heymans K, Kuiper M (2005) BiNGO: a Cytoscape plugin to assess overrepresentation of gene ontology categories in biological networks. Bioinformatics 21:3448–9. 10.1093/bioinformatics/bti551 [DOI] [PubMed] [Google Scholar]
- 33.Beausoleil SA, Villén J, Gerber SA, et al. (2006) A probability-based approach for high-throughput protein phosphorylation analysis and site localization. Nat Biotechnol 24:1285–92. 10.1038/nbt1240 [DOI] [PubMed] [Google Scholar]
- 34.Keller A, Bader SL, Kusebauch U, et al. (2016) Opening a SWATH Window on Posttranslational Modifications: Automated Pursuit of Modified Peptides. Mol Cell Proteomics 15:1151–63. 10.1074/mcp.M115.054478 [DOI] [PMC free article] [PubMed] [Google Scholar]
- 35.Fermin D, Walmsley SJ, Gingras A-C, et al. (2013) LuciPHOr: algorithm for phosphorylation site localization with false localization rate estimation using modified target-decoy approach. Mol Cell Proteomics 12:3409–19. 10.1074/mcp.M113.028928 [DOI] [PMC free article] [PubMed] [Google Scholar]
- 36.Fert-Bober J, Giles JT, Holewinski RJ, et al. (2015) Citrullination of myofilament proteins in heart failure. Cardiovasc Res 108:232–42. 10.1093/cvr/cvv185 [DOI] [PMC free article] [PubMed] [Google Scholar]
- 37.Manwar Hussain MR, Khan A, Ali Mohamoud HS (2014) From genes to health - challenges and opportunities. Front Pediatr 2:12 10.3389/fped.2014.00012 [DOI] [PMC free article] [PubMed] [Google Scholar]
- 38.Gligorijević V, Pržulj N (2015) Methods for biological data integration: perspectives and challenges. J R Soc Interface 12:20150571 10.1098/rsif.2015.0571 [DOI] [PMC free article] [PubMed] [Google Scholar]
- 39.Hornbeck P V, Kornhauser JM, Tkachev S, et al. (2012) PhosphoSitePlus: a comprehensive resource for investigating the structure and function of experimentally determined post-translational modifications in man and mouse. Nucleic Acids Res 40:D261–70. 10.1093/nar/gkr1122 [DOI] [PMC free article] [PubMed] [Google Scholar]
- 40.Dinkel H, Chica C, Via A, et al. (2011) Phospho.ELM: a database of phosphorylation sites--update 2011. Nucleic Acids Res 39:D261–7. 10.1093/nar/gkq1104 [DOI] [PMC free article] [PubMed] [Google Scholar]
- 41.Wurgler-Murphy SM, King DM, Kennelly PJ (2004) The Phosphorylation Site Database: A guide to the serine-, threonine-, and/or tyrosine-phosphorylated proteins in prokaryotic organisms. Proteomics 4:1562–1570. 10.1002/pmic.200300711 [DOI] [PubMed] [Google Scholar]
- 42.Gnad F, Ren S, Cox J, et al. (2007) PHOSIDA (phosphorylation site database): management, structural and evolutionary investigation, and prediction of phosphosites. Genome Biol 8:R250 10.1186/gb-2007-8-11-r250 [DOI] [PMC free article] [PubMed] [Google Scholar]
- 43.Heazlewood JL, Durek P, Hummel J, et al. (2008) PhosPhAt: a database of phosphorylation sites in Arabidopsis thaliana and a plant-specific phosphorylation site predictor. Nucleic Acids Res 36:D1015–21. 10.1093/nar/gkm812 [DOI] [PMC free article] [PubMed] [Google Scholar]
- 44.Chaudhuri R, Sadrieh A, Hoffman NJ, et al. (2015) PhosphOrtholog: a web-based tool for cross-species mapping of orthologous protein post-translational modifications. BMC Genomics 16:617 10.1186/s12864-015-1820-x [DOI] [PMC free article] [PubMed] [Google Scholar]
- 45.Linding R, Jensen LJ, Pasculescu A, et al. (2008) NetworKIN: a resource for exploring cellular phosphorylation networks. Nucleic Acids Res 36:D695–9. 10.1093/nar/gkm902 [DOI] [PMC free article] [PubMed] [Google Scholar]
- 46.Lee T-Y, Bo-Kai Hsu J, Chang W-C, Huang H-D (2011) RegPhos: a system to explore the protein kinase-substrate phosphorylation network in humans. Nucleic Acids Res 39:D777–87. 10.1093/nar/gkq970 [DOI] [PMC free article] [PubMed] [Google Scholar]
- 47.Gupta R, Birch H, Rapacki K, et al. (1999) O-GLYCBASE version 4.0: a revised database of O-glycosylated proteins. Nucleic Acids Res 27:370–372. [DOI] [PMC free article] [PubMed] [Google Scholar]
- 48.Wang J, Torii M, Liu H, et al. (2011) dbOGAP - an integrated bioinformatics resource for protein O-GlcNAcylation. BMC Bioinformatics 12:91 10.1186/1471-2105-12-91 [DOI] [PMC free article] [PubMed] [Google Scholar]
- 49.Chernorudskiy AL, Garcia A, Eremin EV, et al. (2007) UbiProt: a database of ubiquitylated proteins. BMC Bioinformatics 8:126 10.1186/1471-2105-8-126 [DOI] [PMC free article] [PubMed] [Google Scholar]
- 50.Naegle KM, Gymrek M, Joughin BA, et al. (2010) PTMScout, a Web resource for analysis of high throughput post-translational proteomics studies. Mol {&} Cell proteomics MCP 9:2558–2570. 10.1074/mcp.M110.001206 [DOI] [PMC free article] [PubMed] [Google Scholar]
- 51.Falquet L, Pagni M, Bucher P, et al. (2002) The PROSITE database, its status in 2002. Nucleic Acids Res 30:235–238. [DOI] [PMC free article] [PubMed] [Google Scholar]
- 52.Kanehisa M, Goto S, Kawashima S, Nakaya A (2002) The KEGG databases at GenomeNet. Nucleic Acids Res 30:42–46. [DOI] [PMC free article] [PubMed] [Google Scholar]
- 53.Fuchs R (1991) MacPattern: protein pattern searching on the Apple Macintosh. Comput Appl Biosci 7:105–106. [DOI] [PubMed] [Google Scholar]
- 54.Henikoff S, Henikoff JG (1991) Automated assembly of protein blocks for database searching. Nucleic Acids Res 19:6565–6572. [DOI] [PMC free article] [PubMed] [Google Scholar]
- 55.Tatusov RL, Altschul SF, Koonin EV (1994) Detection of conserved segments in proteins: iterative scanning of sequence databases with alignment blocks. Proc Natl Acad Sci U S A 91:12091–12095. [DOI] [PMC free article] [PubMed] [Google Scholar]
- 56.Li H, Xing X, Ding G, et al. (2009) SysPTM: A Systematic Resource for Proteomic Research on Post-translational Modifications. Mol {&} Cell Proteomics 8:1839–1849. 10.1074/mcp.M900030-MCP200 [DOI] [PMC free article] [PubMed] [Google Scholar]
- 57.Keshava Prasad TS, Goel R, Kandasamy K, et al. (2009) Human Protein Reference Database−−2009 update. Nucleic Acids Res 37:D767–D772. 10.1093/nar/gkn892 [DOI] [PMC free article] [PubMed] [Google Scholar]
- 58.Zhang P, Kirk JA, Ji W, et al. (2012) Multiple Reaction Monitoring to Identify Site-Specific Troponin I Phosphorylated Residues in the Failing Human Heart. Circulation 126:1828–1837. 10.1161/CIRCULATIONAHA.112.096388 [DOI] [PMC free article] [PubMed] [Google Scholar]
- 59.Kooij V, Zhang P, Piersma SR, et al. (2013) PKC{Î}±-Specific Phosphorylation of the Troponin Complex in Human Myocardium: A Functional and Proteomics Analysis. PLoS One 8:e74847 10.1371/journal.pone.0074847 [DOI] [PMC free article] [PubMed] [Google Scholar]


