eLife logoLink to eLife
. 2019 Oct 9;8:e47021. doi: 10.7554/eLife.47021

Modular organization of cerebellar climbing fiber inputs during goal-directed behavior

Shinichiro Tsutsumi 1,2,, Naoki Hidaka 1,2,3, Yoshikazu Isomura 2,4,5, Masanori Matsuzaki 2,6, Kenji Sakimura 7, Masanobu Kano 1,8,, Kazuo Kitamura 1,2,3,
Editors: Ronald L Calabrese9, Megan R Carey10
PMCID: PMC6844646  PMID: 31596238

Abstract

The cerebellum has a parasagittal modular architecture characterized by precisely organized climbing fiber (CF) projections that are congruent with alternating aldolase C/zebrin II expression. However, the behavioral relevance of CF inputs into individual modules remains poorly understood. Here, we used two-photon calcium imaging in the cerebellar hemisphere Crus II in mice performing an auditory go/no-go task to investigate the functional differences in CF inputs to modules. CF signals in medial modules show anticipatory decreases, early increases, secondary increases, and reward-related increases or decreases, which represent quick motor initiation, go cues, fast motor behavior, and positive reward outcomes. CF signals in lateral modules show early increases and reward-related decreases, which represent no-go and/or go cues and positive reward outcomes. The boundaries of CF functions broadly correspond to those of aldolase C patterning. These results indicate that spatially segregated CF inputs in different modules play distinct roles in the execution of goal-directed behavior.

Research organism: Mouse

Introduction

Anatomically, the cerebellum is the simplest structure in the brain, comprising a few types of neurons with similar interconnections. The inputs and outputs of the cerebellar cortex are organized into modules (Voogd and Glickstein, 1998), wherein spatially defined populations of Purkinje cells (PCs) project to a distinct subdivision of the cerebellar nucleus, which in turn projects to a subnucleus of the inferior olive that provides climbing fiber (CF) inputs to PCs. These modules are called zones or microzones (Oscarsson, 1979) and are considered as functional units in the cerebellum. On the other hand, PCs show parasagittal alternating band-like expression of various molecules, including aldolase C/zebrin II (Brochu et al., 1990). Each hemi-cerebellum can be subdivided into 14 alternating aldolase C-positive (AldC+) and aldolase C-negative (AldC−) compartments (1+ to 7+), which are largely congruent with the classical zones (Sugihara and Shinoda, 2004; Voogd and Ruigrok, 2004).

Accumulating evidence suggests functional difference between AldC+ and AldC− PCs. AldC+ PCs receive enhanced glutamate release by CFs (Paukert et al., 2010), but parallel fiber inputs that are similar to those received by AldC− PCs (Nguyen-Minh et al., 2018). AldC+ and AldC− PCs show distinct firing properties and plasticity rules (Zhou et al., 2014), and differ in interaction between simple and complex spikes (Tang et al., 2017). CF inputs to AldC+ and AldC− compartments are separately and precisely synchronized at cellular resolution (Tsutsumi et al., 2015). AldC+ and AldC− PCs respond differently to optic flow stimulation in the pigeon cerebellum (Graham and Wylie, 2012). Despite these functional implications and the rich anatomical information that is available, surprisingly little is known about the differences in CF inputs across the AldC+ and AldC− compartments and across the mediolateral axis of the cerebellar lobules during behavior.

To address this issue systematically, we expressed the genetically encoded calcium indicator GCaMP6f (Chen et al., 2013) in the cerebellar hemisphere folium Crus II of Aldoc-tdTomato mice (Tsutsumi et al., 2015), which express the red fluorescent protein tdTomato in AldC+ PCs, and conducted two-photon calcium imaging of PC dendrites of awake mice performing a lick/no-lick task. We found that the proportion of AldC+ PCs showing CF-dependent dendritic Ca2+ signals (CF signals) is scaled with licking behavior and higher than that of AldC− PCs. CF signals in the medial Crus II were prevalent during licking trials and scaled with licking behavior, whereas those in the lateral Crus II showed equal prevalence in all trial types or were pronounced after no-go cues. We found anticipatory decreases in population CF signals toward sensory cues in a medial AldC+ compartment, which were correlated with the initiation of licking, and in a lateral AldC– compartment, which were related to delay in lick initiation. Early increases of CF signals after sensory cues in the medial Crus II were correlated with the initiation of licking, quicker lick response, faster licking, and the presence of go cues, whereas those in lateral AldC– compartments were correlated with the presence of no-go cues. Subsequent increases in CF signals in the medial Crus II reflected faster licking. Later decreases in CF signals in the lateral Crus II and increases in a medial AldC– compartment after licking represented positive reward outcomes. These results suggest distinct contributions of spatially organized CF inputs to the Crus II to sensorimotor behavior.

Results

The cerebellar Crus II contributes to an auditory lick/no-lick task

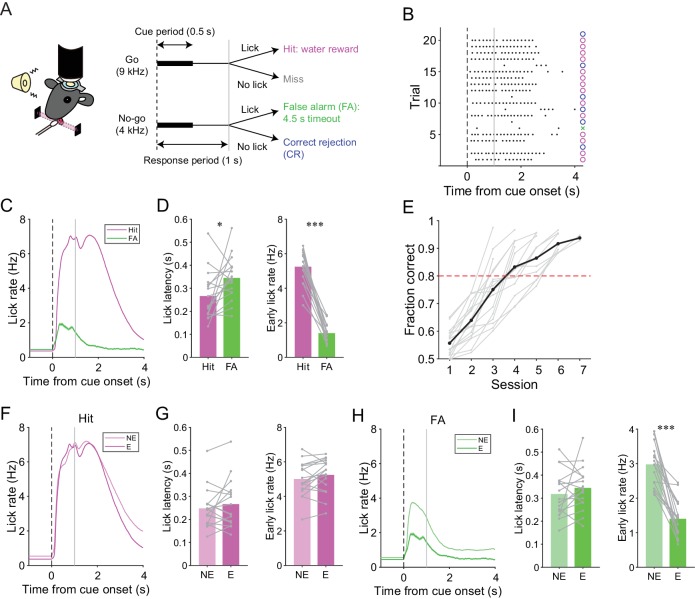
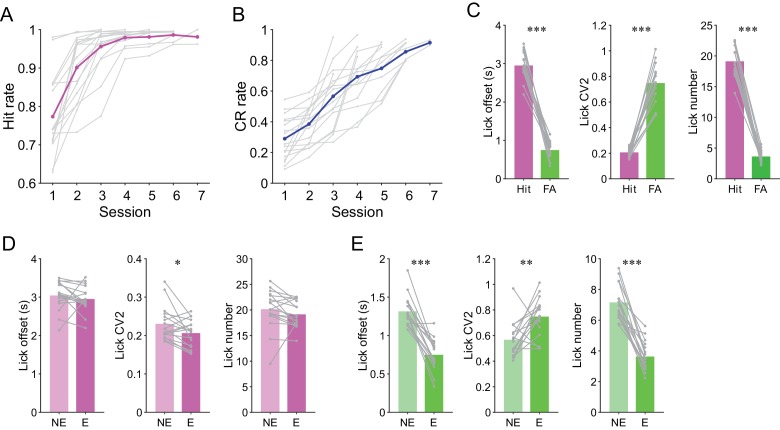
We trained mice to perform a lick/no-lick auditory discrimination task (Figure 1A), which required the initiation or suppression of licking in response to different auditory cues. We reasoned that the task requires sensorimotor functions beyond motor correction or adaptive control of reflex, and therefore efficiently reveals functional differences across AldC compartments during behavior. In this task, mice had to respond to a high-frequency tone (go cue) with a lick to receive a water reward (hit; Figure 1A). A lick after a low-frequency tone (no-go cue) was punished with a timeout (4.5 s; false alarm or FA). No licking after a go cue (miss) or a no-go cue (correct rejection or CR) was neither rewarded nor punished. The inter-trial interval was set to 6 s, but a subsequent trial was delayed for 1 s after the cessation of continued licking. Well-trained mice almost completely withheld licking after a no-go cue (Figure 1B) and cut off protracted licking, yielding a constant inter-trial interval (hit, CR, and miss trials: 6.23 ± 0.58 s; FA trials: 10.98 ± 1.65 s; mean ± s.d., n = 17 mice). Licking in hit trials was shorter in latency, higher in frequency, longer in duration, and more regular than licking in FA trials (Figure 1C and D, and Figure 1—figure supplement 1C). The performance of mice quickly improved to an expert level, defined as fraction of correct trials >80%, within 3–6 sessions (4.18 ± 0.27 sessions, mean ± s.e.m., n = 17 mice; Figure 1E) by first increasing the hit rate, and then increasing the CR rate (Figure 1—figure supplement 1A and B). Licking behavior in hit trials remained relatively unchanged (Figure 1F and G, and Figure 1—figure supplement 1D). By contrast, the frequency of FA licking robustly decreased and became irregular (Figure 1H and I, and Figure 1—figure supplement 1E). Therefore, mice learned to suppress their licking in response to a no-go cue, while preserving their licking in response to a go cue.

Figure 1. A lick/no-lick auditory discrimination task.

(A) Left, schematic diagram of a mouse performing the task under a two-photon microscope. Right, task structure. (B) Performance of an expert mouse in a representative session. Black dots represent licks. A vertical dotted line represents cue onset, and a gray line indicates the end of the response window. Circles and a cross represent correct trials and an incorrect trial, respectively. The color scheme is the same as that in panel (A). (C) Trial-averaged lick rate for hit and FA trials pooled across all trials in expert performance sessions. (D) Mouse-averaged lick latency (left) and lick rate within 1 s from cue onset (right) for hit and FA trials in expert performance sessions. Gray dots and lines represent individual mice (n = 17). (E) Learning curve for all mice (n = 17). Black dots and a line represent an average. A red dashed line represents a threshold for expert performance level (fraction correct = 0.8). (F) Trial-averaged lick rate for hit trials pooled across expert (E) and non-expert (NE) performance sessions. (G) Mouse-averaged lick latency (left) and lick rate within 1 s from cue onset (right) for hit trials in expert (E) and non-expert (NE) performance sessions. (H) Same as panel (F) but for FA trials. (I) Same as panel (G) but for FA trials. (C, F, H) Lines and shadings represent means ± s.e.m. (D, G, I) Paired t-test: *p<0.05, ***p<0.001.

Figure 1—source data 1. Datasets used to create Figure 1.
DOI: 10.7554/eLife.47021.007

Figure 1.

Figure 1—figure supplement 1. Analyses of task performance and licking behavior.

Figure 1—figure supplement 1.

(A) Learning curves for hit rate in all mice (n = 17). Gray dots and lines represent individual animals and magenta dots and line represent means. (B) Same as panel (A) but for CR rate. Gray dots and lines represent individual animals and the blue line and dots represent means. (C) Mouse-averaged lick offset, lick CV2, and lick number for hit and FA trials (n = 17 mice). (D) Mouse-averaged lick offset, lick CV2, and lick number for hit trials in non-expert (NE) and expert (E) performance sessions (n = 17 mice). (E) Same as panel (D) but for FA trials. (C, D, E) Paired t-test: *p<0.05, **p<0.01, ***p<0.001.
Figure 1—figure supplement 1—source data 1. Datasets used to create Figure 1—figure supplement 1.
DOI: 10.7554/eLife.47021.004
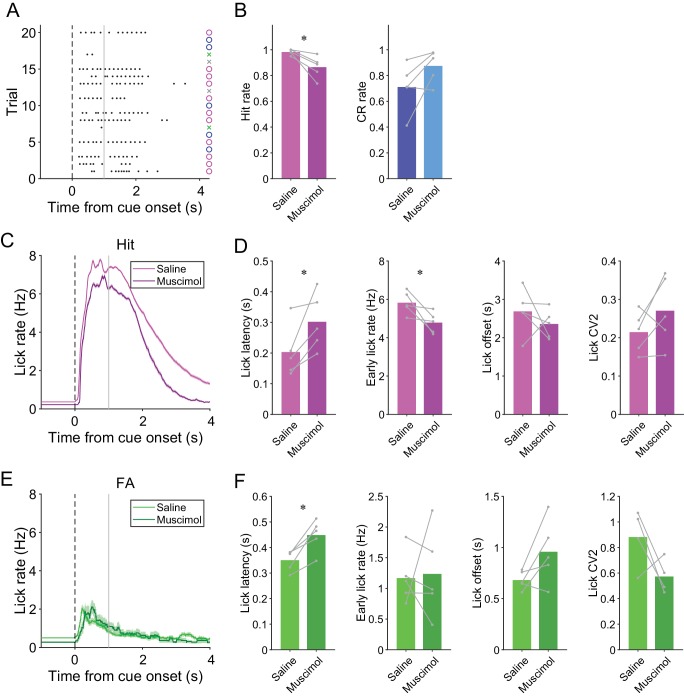
Figure 1—figure supplement 2. Effects of muscimol on mouse behavior.

Figure 1—figure supplement 2.

(A) Example behavior during a session with muscimol injection. Black dots represent licks. A vertical dashed line represents cue onset, and a gray line indicates the end of the response window. Circles and crosses represent correct and incorrect trials, respectively. The color scheme is the same as that in Figure 1A. (B) Hit and CR rate for saline injection control and muscimol injection sessions (n = 5 mice). (C) Trial-averaged lick rate for hit trials during saline injection control and muscimol injection sessions. (D) Lick latency, early lick rate within 1 s from cue onset, lick offset, and lick CV2 for hit trials during saline injection control and muscimol injection sessions (n = 5 mice). (E) Same as panel (C) but for FA trials. (F) Same as panel (D) but for FA trials. (C, E) Lines and shadings represent means ± s.e.m. (B, D, F) Gray dots and lines represent individual animals. Paired t-test: *p<0.05.
Figure 1—figure supplement 2—source data 1. Datasets used to create Figure 1—figure supplement 2.
DOI: 10.7554/eLife.47021.006

We assessed the contribution of the cerebellar folium Crus II, a region associated with licking (Bryant et al., 2010; Welsh et al., 1995), to this go/no-go behavior by injecting a GABAA receptor agonist, muscimol, at the center of the left Crus II just before the behavioral sessions in fully trained wild-type mice (n = 5; after total 6 ± 1 sessions and 1827 ± 278 trials of the lick/no-lick task; mean ± s.d.). The muscimol injection decreased the hit rate compared with the saline control (Figure 1—figure supplement 2A and B). Moreover, licking in hit trials was delayed and slower in muscimol injection sessions (Figure 1—figure supplement 2C and D), and licking in FA trials was also delayed by muscimol injection (Figure 1—figure supplement 2E and F). These results indicate that the Crus II contributes to the proper initiation and speed of conditioned licking.

Correspondence between task-related CF signals and AldC expression

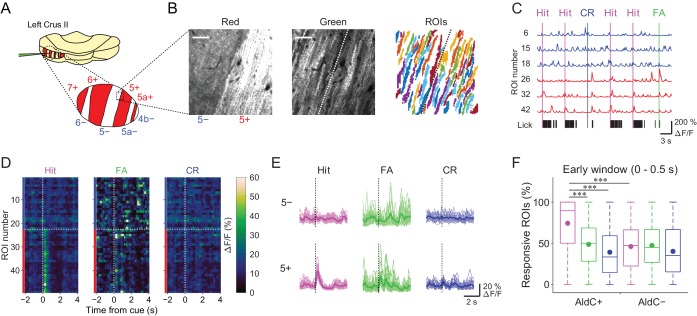
We used the Aldoc-tdTomato transgenic mouse line to explore systematically functional differences in CF inputs to AldC+ and AldC− compartments at single-cell resolution during the task. In this mouse line, AldC expression can be visualized in vivo as red tdTomato fluorescence (Figure 2A and B, left); we have previously shown by immunohistochemistry that the expression of tdTomato precisely corresponds to that of AldC (Tsutsumi et al., 2015). We virally expressed GCaMP6f in PCs of the left Crus II, and performed two-photon calcium imaging from PC dendrites at every boundary of AldC expression to simultaneously monitor CF-dependent dendritic Ca2+ signals (CF signals) in adjacent AldC+ and AldC− compartments (Figure 2B, middle), as previously described (Tsutsumi et al., 2015). We extracted 10–20 (13.7 ± 5.7; mean ± s.d.) dendritic regions of interest (ROIs) from single AldC compartments (n = 472 compartments; Figure 2B, right). We observed global calcium increases in the dendrites of each PC, which reflect complex spikes that represent responses of PCs to CF inputs (Kitamura and Häusser, 2011; Tsutsumi et al., 2015) that are triggered by auditory cues and licking (Figure 2C). CF signals were observed immediately after the cue onset and were robust during hit trials in AldC+ PCs (5+ AldC compartment; Figure 2D and E), whereas much smaller responses were observed in AldC− PCs (5− AldC compartment; Figure 2D and E). This response pattern was clearly separated at the boundary of AldC expression (Figure 2D).

Figure 2. Differences in task-related CF signals between AldC+ and AldC− compartments.

(A) Schematic diagram of virus injection into the left cerebellar folium Crus II of Aldoc-tdTomato mice. Inset, magnified view of the Crus II. Red stripes represent AldC+ compartments. (B) Left, tdTomato fluorescence image at a 5−/5+ boundary. Middle, mean image of a GCaMP6f video at the same field of view. Right, extracted ROIs representing PC dendrites that are pseudocolored, in the same field of view. Scale bars, 40 μm. (C) Representative calcium traces from dendrites in panel (B) and their corresponding lick activities (black bars). Colored vertical lines represent the onsets of sensory cues for each trial type. (D) Trial-averaged calcium traces of single ROIs from the data in panel (C). (E) Single ROI trial-averaged traces for 5− and 5+ compartments from the data in panel (C). Thick lines represent ROI-averaged traces. (F) Percentage of responsive ROIs in a compartment per session for each trial type pooled across all AldC+ or AldC− compartments (n = 17 mice, 79 imaging sessions). Colored circles represent means. Colors represent trial types (hit, magenta; FA, green; CR, blue). Two-way ANOVA on ranks with repeated measures followed by post-hoc Tukey’s test: ***p<0.001.

Figure 2—source data 1. Datasets used to create Figure 2.
DOI: 10.7554/eLife.47021.015

Figure 2.

Figure 2—figure supplement 1. Broad correspondence between functional boundaries and AldC expression boundaries at the microzone level.

Figure 2—figure supplement 1.

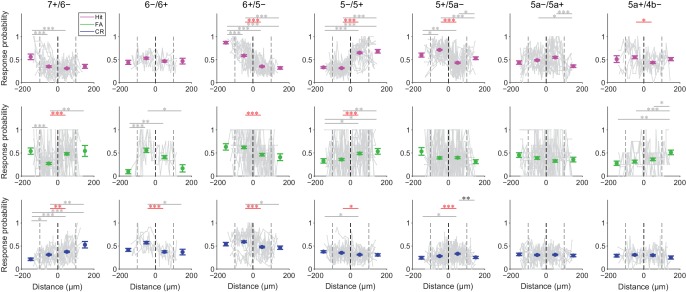
Probability of response during the early response window (0 to 0.5 s from cue onset) in single ROIs (gray dots) for each trial type (hit, magenta; FA, green; CR, blue) plotted as a function of relative distance from AldC expression boundaries (gray lines; single lines represent single imaging sessions). Colored dots and error bars represent the means and s.e.m. of single ROI response probability within 100 µm bins from AldC expression boundaries, pooled across sessions and animals (lateral 100–200 μm bin, lateral 0–100 μm bin, medial 0–100 μm bin, and medial 100–200 μm bin; 7+/6−, n = 5 mice, 12 imaging sessions, 18, 147, 147, and 11 ROIs; 6−/6+, n = 3 mice, four imaging sessions, 8, 48, 40, and 6 ROIs; 6+/5−, n = 8 mice, 13 imaging sessions, 19, 140, 143, and 23 ROIs; 5−/5+, n = 9 mice, 15 imaging sessions, 34, 199, 161, and 33 ROIs; 5+/5a−, n = 8 mice, 16 imaging sessions, 21, 168, 209, and 37 ROIs; 5a−/5a+, n = 3 mice, 13 imaging sessions, 35, 159, 159, and 26 ROIs; 5a+/4b−, n = 2 mice, six imaging sessions, 13, 69, 74, and 23 ROIs). Red horizontal lines and asterisks represent significant difference between adjacent 100 μm bins across AldC expression boundaries. Gray horizontal lines and asterisks represent significant difference between the other pairs of 100 μm bins. Black vertical dashed lines represent AldC expression boundaries. Gray vertical dashed lines represent other boundaries between 100 μm bins. One-way ANOVA on ranks with repeated measures followed by post-hoc Tukey’s test: *p<0.05, **p<0.01, ***p<0.001.
Figure 2—figure supplement 1—source data 1. Datasets used to create Figure 2—figure supplement 1.
DOI: 10.7554/eLife.47021.010
Figure 2—figure supplement 2. Broad correspondence between functional boundaries and AldC expression boundaries at cellular resolution.

Figure 2—figure supplement 2.

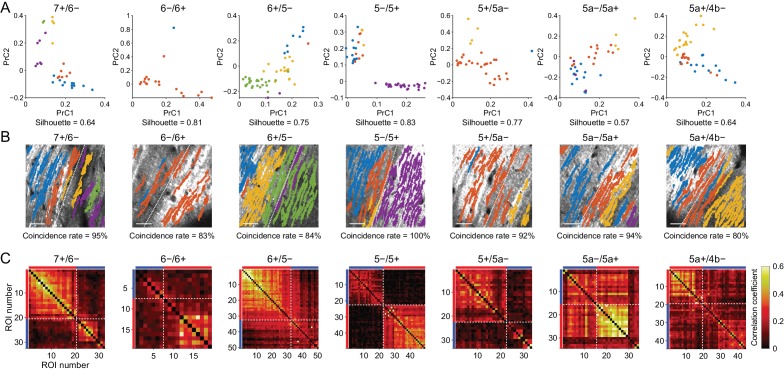
(A) Principal component analyses of whole ∆F/F traces from all ROIs in single imaging sessions at all AldC expression boundaries, irrespective of AldC expression. Colored dots correspond to results from k-means clustering on the basis of the first three principal components (PrC1, PrC2, and PrC3). The first two major principal components (PrC1 and PrC2) for individual ROIs are plotted for better visualization. The silhouette value for the optimized cluster number is indicated on the bottom. (B) Projections of each clustering result from panel (A) using the same color scheme, overlaid on the tdTomato image. Coincidence rates of clustering results and AldC expression are indicated at the bottom. Scale bars: 40 μm. (C) Correlation matrices of whole traces from all the ROIs in panel (B) aligned from lateral to medial. Red and blue bars correspond to AldC+ and AldC− PCs. Note the exact delineation of the correlation matrices at the AldC expression boundary where coincidence value is close to 100%. (B, C) White dashed lines represent boundaries of AldC expression.
Figure 2—figure supplement 3. Task-related CF signals in individual clusters.

Figure 2—figure supplement 3.

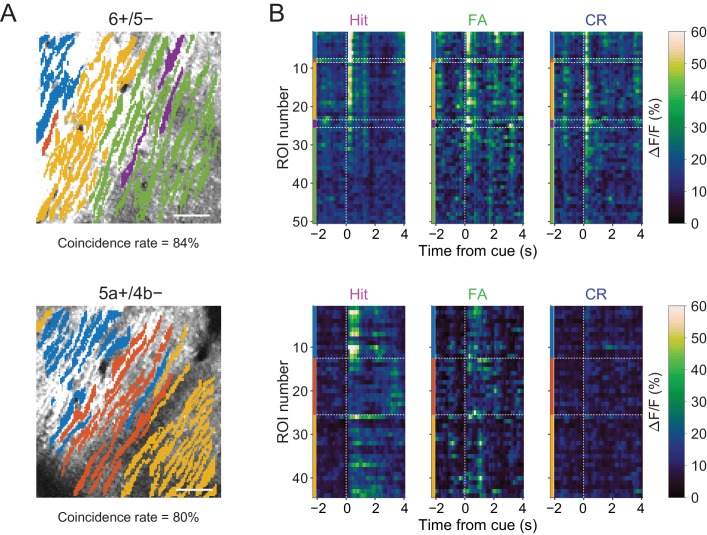
(A) Projection of clustering results of Figure 2—figure supplement 2A overlaid on tdTomato images at 6+/5− (top) and 5a+/4b− (bottom) boundaries. Coincidence rates of clustering results and AldC expression are indicated below the images. (B) Trial-averaged single ROI calcium traces separated on the basis of clustering results. Colored bars indicate ROIs from colored clusters in panel (A). Horizontal dashed lines represent the boundaries of clusters. Vertical dashed lines represent cue onsets.
Figure 2—figure supplement 4. Summary of correspondence between functional boundaries and AldC expression.

Figure 2—figure supplement 4.

(A) Number of clusters per field of view for all sessions from all mice (n = 5, 3, 8, 9, 8, 3, and two mice, 12, 4, 13, 15, 16, 13, and 6 sessions for 7+/6−, 6−/6+, 6+/5−, 5−/5+, 5+/5a−, 5a−/5a+, and 5a+/4b− boundaries, respectively). (B) Same as in panel (A), but for silhouette values for the clustering results. (C) Same as in panel (A), but for coincidence rates for the clustering results. One-way ANOVA on ranks with repeated measures followed by post-hoc Tukey’s test: *p<0.05.
Figure 2—figure supplement 4—source data 1. Datasets used to create Figure 2—figure supplement 4.
DOI: 10.7554/eLife.47021.014

To examine whether the boundaries of functional difference in CF signals correspond to those of AldC expression at microzone level, we averaged the response probabilities of individual ROIs located within 100 µm bins from the AldC boundaries. Differences in response probability were noted across the AldC boundaries for either or all of hit, FA, and CR trials (Figure 2—figure supplement 1), indicating that the AldC expression boundaries have a close (≦ 100 µm) spatial correspondence with the CF functional boundaries.

To further explore whether the boundaries of functional difference in CF signals correspond to those of AldC expression at the cellular level, we performed principal component analysis on whole traces in an imaging session from all ROIs irrespective of the AldC expression profile in each imaging field of view, and segregated these ROIs using k-means clustering performed on the basis of the first three principal components (PrC1, PrC2, and PrC3; Figure 2—figure supplement 2A). Cluster number was chosen on the basis of the largest average silhouette value (Rousseeuw, 1987), which represents how well each cluster is separated from the others. Cluster number in single field of view was between 2 and 5, and it was higher at a medial AldC boundary than at a lateral boundary (7+/6− vs. 5+/5a−; Figure 2—figure supplement 4A). Silhouette values ranged from 0.7 to 0.9, indicating good separation of clusters for some, but not all, of the boundaries (Figure 2—figure supplement 4B). Indeed, each cluster showed distinct task-related CF signals (Figure 2—figure supplement 3), supporting their functional separation. Then we projected the clustering results to the tdTomato reference images and calculated average coincidence rate representing the percentage of ROIs showing the same AldC expression profile within each cluster (Figure 2—figure supplement 2B). High coincidence value roughly corresponded to good separation of correlation matrices across ROIs in individual imaging sessions (Figure 2—figure supplement 2C). Mean coincidence rates across animals were as high as 90% in 7+/6−, 5−/5+, and 5+/5a− boundaries (Figure 2—figure supplement 4C), indicating that unbiased clustering of ROIs on the basis of their responses corresponds to separation using AldC expression at cellular resolution at these boundaries, but more broadly tuned in the other boundaries.

On average, the percentage of ROIs that respond during the early time window (0–0.5 s from cue onset) in AldC+ compartments was higher for licking trials (hit and FA) than for non-licking trials (CR), and scaled with lick rate (hit > FA; Figure 2F). The percentage of responsive ROIs in AldC+ compartments during hit trials was significantly higher than that in AldC− compartments (Figure 2F), suggesting that CF inputs to AldC+ compartments are more relevant to motor behavior than those to AldC– compartments.

Mediolateral distinction in sensory and motor-related CF signals

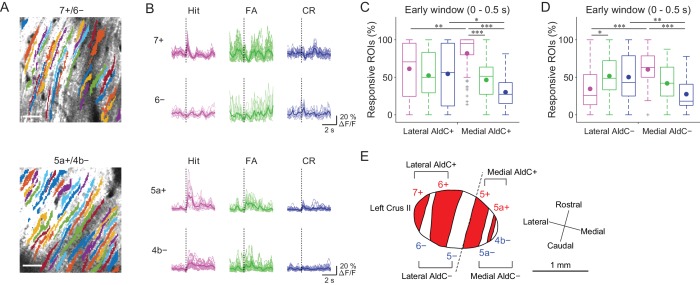
Previous reports on anatomical CF projections in rodents (Sugihara and Shinoda, 2004; Sugihara and Quy, 2007) suggested functional differences across the mediolateral axis in the cerebellar hemisphere. We took advantage of our mouse line to precisely locate the individual AldC+ and AldC− compartments on the basis of their characteristic widths and relative locations (see 'Materials and methods') (Tsutsumi et al., 2015), which enabled us to explore the differences in functional CF inputs along the mediolateral axis. We found differences in task-related CF signals in laterally and medially located AldC+ compartments (Figure 3A and B). First, CF signals in a lateral AldC+ compartment (7+) during hit trials were precisely time-locked to sensory cues followed by suppression (Figure 3B, top), whereas those in a medial AldC+ compartment (5a+) persisted long after the cues (Figure 3B, bottom). Second, task-related CF signals were distinct across AldC expression boundaries at lateral AldC compartments (7+/6−), whereas there was less difference across medial AldC compartments (5a+/4b−; Figure 3B). Finally, task-related CF signals were graded in extent depending on lick rate (hit > FA) in the medial AldC compartments (5a+ and 4b−), whereas there was a distinct difference between responses to go and no-go cues in the lateral AldC compartment (7+; Figure 3B).

Figure 3. Difference in CF signals between the lateral and medial Crus II.

(A) Extracted ROIs representing PC dendrites that are pseudocolored overlaid on the tdTomato image around a 7+/6− (top) and a 5a+/4b− (bottom) boundary. Scale bars, 40 μm. (B) Single ROI trial-averaged traces for 7+ and 6− (top) and 5a+ and 4b− (bottom) compartments from the data in panel (A). Thick lines represent ROI-averaged traces. (C) Percentage of responsive ROIs during the early response window (0 to 0.5 s from cue onset) in an AldC compartment per session for each trial type pooled across all the lateral AldC+ or medial AldC+ compartments (n = 12 and 13 mice, 29 and 50 imaging sessions, respectively). Colored dots represent means. Colors represent trial types (hit, magenta; FA, green; CR, blue). (D) Same as panel (C) but for all the lateral AldC− or medial AldC− compartments (n = 15 and 9 mice, 44 and 35 imaging sessions, respectively). (E) Schematic diagram of the left Crus II showing a functional grouping of AldC compartments. The dashed line represents a boundary between the lateral and medial Crus II. (C, D) Two-way ANOVA on ranks with repeated measures followed by post-hoc Tukey’s test: *p<0.05, **p<0.01, ***p<0.001.

Figure 3—source data 1. Datasets used to create Figure 3.
DOI: 10.7554/eLife.47021.020

Figure 3.

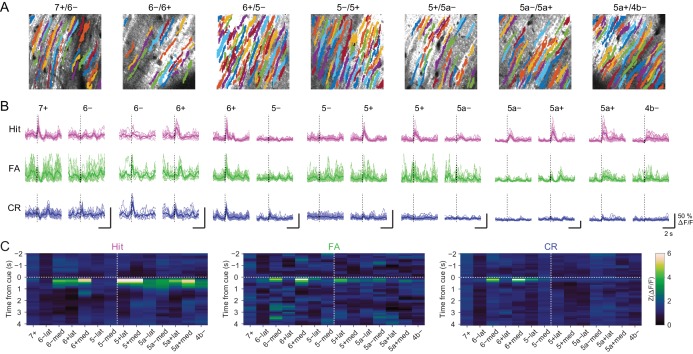
Figure 3—figure supplement 1. Mediolateral separation of task-related CF signals in the Crus II.

Figure 3—figure supplement 1.

(A) Extracted ROIs representing PC dendrites around the example 7+/6−, 6−/6+, 6+/5−, 5−/5+, 5+/5a−, 5a−/5a+, and 5a+/4b− boundaries that are pseudocolored and overlaid on the tdTomato image. Scale bars, 40 μm. (B) Single ROI trial-averaged traces for all the AldC compartments from the data in panel (A). Thick lines represent ROI-averaged traces. (C) Z-scored trial-averaged ΔF/F for each compartment averaged across sessions and mice, aligned from lateral to medial separately for AldC+ and AldC− compartments (n = 5, 3, 8, 9, 8, 3, and two mice, and 12, 4, 13, 15, 16, 13 and 6 sessions for 7+/6−, 6−/6+, 6+/5−, 5−/5+, 5+/5a−, 5a−/5a+ and 5a+/4b− boundaries, respectively). Vertical dashed lines delineate the lateral and medial Crus II. Horizontal dashed lines represent cue onset.
Figure 3—figure supplement 1—source data 1. Datasets used to create Figure 3—figure supplement 1.
DOI: 10.7554/eLife.47021.018
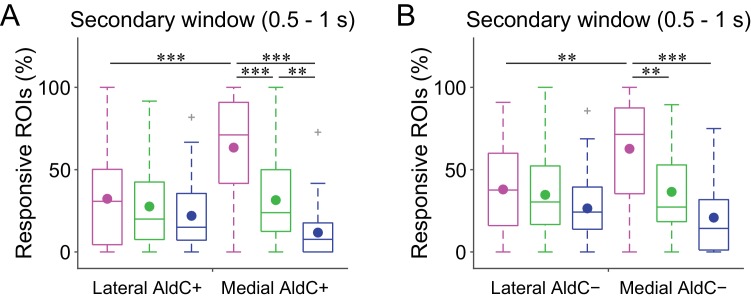
Figure 3—figure supplement 2. Difference in secondary CF signals between the lateral and medial Crus II.

Figure 3—figure supplement 2.

(A) Percentage of responsive ROIs during the secondary response window (0.5 to 1 s from cue onset) in a compartment per session for each trial type pooled across all the lateral AldC+ or medial AldC+ compartments (n = 12 and 13 mice, 29 and 50 imaging sessions, respectively). Colored dots represent means. Colors represent trial types (hit, magenta; FA, green; CR, blue). (B) Same as panel (A) but for all the lateral AldC− or medial AldC− compartments (n = 15 and 9 mice, 44 and 35 imaging sessions, respectively). (A, B) Two-way ANOVA on ranks with repeated measures followed by post-hoc Tukey’s test: **p<0.01, ***p<0.001.

To investigate whether there is a systematic functional difference along the medio-lateral axis in the Crus II, we characterized CF signals across all boundaries (Figure 3—figure supplement 1A and B), aligned task-related CF signals in individual compartments and sorted them from lateral to medial (Figure 3—figure supplement 1C). On the basis of these task-related CF signals in individual compartments, the lateral and medial Crus II were separable at the boundary of 5−/5+ (Figure 3—figure supplement 1C), where complete separation of the functional clusters and the correlation matrix was observed (Figure 2—figure supplement 2C). Therefore, we grouped 7+ and 6+ as lateral AldC+, 6− and 5− as lateral AldC−, 5+ and 5a+ as medial AldC+, and 5a− and 4b− as medial AldC− compartments (Figure 3E).

To show the mediolateral difference in task-related CF signals quantitatively, we compared percentages of ROIs that responded during the early time window (0 to 0.5 s from cue onset) in the lateral AldC+ versus medial AldC+ compartments, and in the lateral AldC− versus medial AldC− compartments, given the functional difference across the AldC+ and AldC− compartments (Figure 2). We found that the percentage of ROIs responding during hit trials was higher for the medial AldC compartments than for the lateral AldC compartments, irrespective of AldC expression profile (Figure 3C and D). The percentage was graded depending on the lick rate in the medial AldC compartments (hit > FA; Figure 3C and D), whereas that in the lateral AldC compartments was equal for all trial types (Figure 3C) or pronounced in FA trials (Figure 3D). The percentage of responding ROIs for CR trials was higher for the lateral than for the medial AldC compartments, again irrespective of AldC expression (Figure 3C and D). In addition, given the observed difference in the temporal structure of CF signals across the lateral and medial AldC compartments (7+, hit vs. 5a+, hit; Figure 3B), we extended the same analysis to secondary increases in CF signals (secondary time window; 0.5 to 1 s from cue onset; Figure 3—figure supplement 2). Differences in CF signals similar to those observed in early time window were observed across the lateral and medial AldC compartments: there was a higher percentage of hit-responsive ROIs, which were scaled with licking activity, in the medial AldC compartments (Figure 3—figure supplement 2). These results suggest that CF inputs to the lateral AldC compartments report task onsets regardless of motor behavior, whereas those to the medial AldC compartments reflect motor behavior.

Temporal organization of CF signals during a go/no-go task

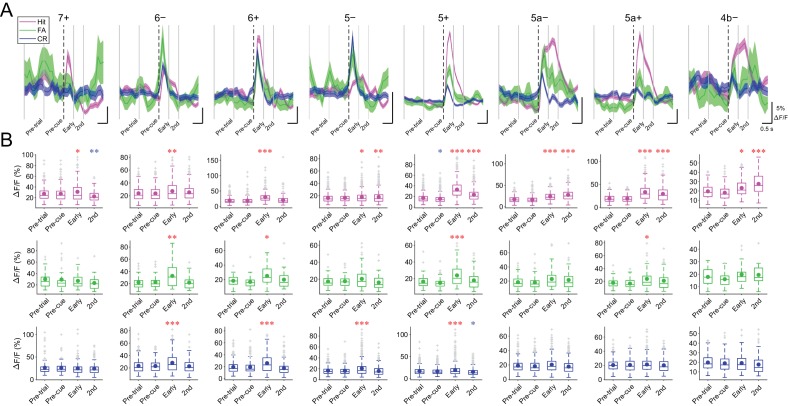
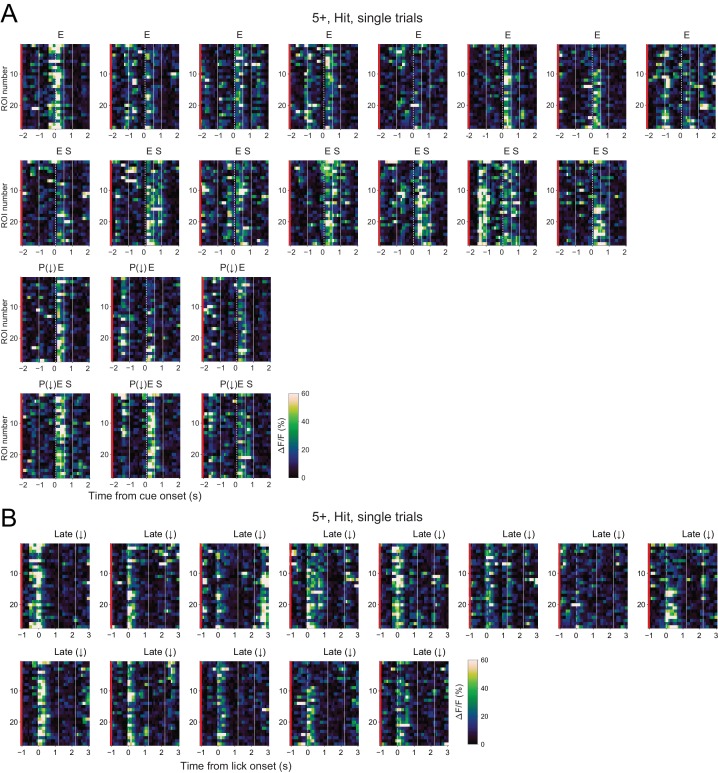
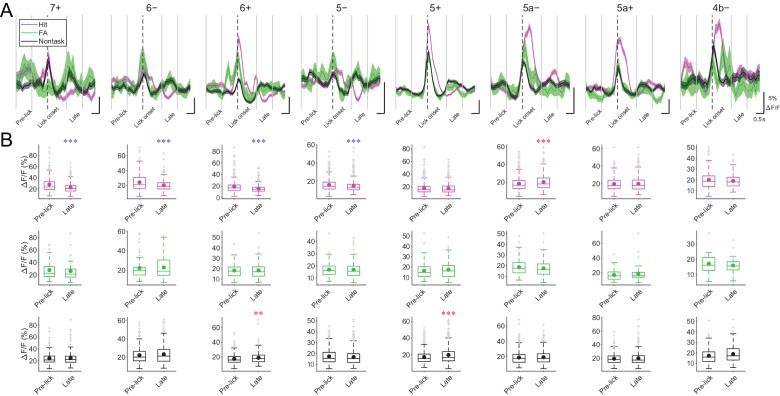
As noted above, close inspection of task-related CF signals in individual AldC compartments revealed several temporal components. We found slight decreases in CF signals during the pre-cue (−1 to 0 s from cue) period in the 5+ compartment (effect size = 0.18; Supplementary file 1), early increase (0 to 0.5 s from cue) in CF signals in all the AldC compartments, and secondary increase (2nd; 0.5 to 1 s from cue) in all the medial AldC compartments (Figure 4—figure supplement 1). These pre-cue decreases and early and secondary increases in CF signals can co-exist, even in single dendrites at single trials (Figure 4—figure supplement 2A and B). Alignment of CF signals at lick onset in task-related and non-task-related lick bouts revealed a decrease in CF signals in the lateral AldC compartments and an increase in the 5a− compartment at late timing (1.2 to 2.2 s from lick onset) during hit trials (Figure 4—figure supplement 3). Therefore, we separately analyzed CF signals within these time windows to investigate their behavioral relevance.

Anticipatory decreases in CF signals are correlated with motor initiation

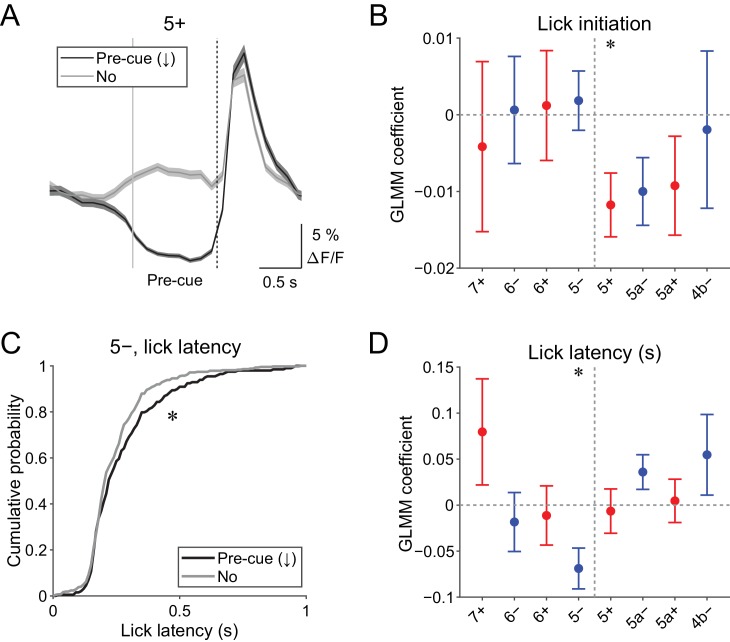
Pre-cue (−1 to 0 s from cue onset) decreases in CF signals were detected when the single-trial-population-averaged Ca2+ trace within an AldC compartment is below mean − 0.5 s.d. of the baseline (see 'Materials and methods'), representing a relative reduction of CF inputs. Pre-cue decreases in population CF signals in the 5+ compartment in single trials were reliably captured by this method (pre-cue (↓); Figure 4A).

Figure 4. Behavioral relevance of pre-cue decrease in CF signals.

(A) Single trial calcium traces in a 5+ compartment with (pre-cue (↓); black) or without (no; gray) decreases in CF signals, showing difference in the pre-cue response window (–1 to 0 s from the cue onset; indicated by gray and dashed vertical lines). A dashed vertical line represents the cue onset. Thick lines and shadings represent mean ± s.e.m.. (B), Coefficients of GLMM fit for single trial pre-cue ΔF/F in each AldC compartment by the presence (1) or absence (0) of lick initiation in the following trial (n = 5, 6, 10, 12, 12, 10, 3, and two mice; 393, 605, 649, 1078, 1281, 1051, 664, and 253 trials for 7+, 6−, 6+, 5−, 5+, 5a−, 5a+, and 4b− compartments, respectively). (C), Cumulative distribution of lick latency from cue onsets during licking trials (hit and FA) with (pre-cue (↓); black) or without (no; gray) pre-cuedecreases in CF signals in a 5− compartment. (D) Coefficients of GLMM fit for single trial pre-cue ΔF/F in each AldC compartment before licking trials by latency of lick initiation in the trial (n = 5, 6, 10, 12, 12, 10, 3, and two mice; 225, 346, 384, 621, 722, 586, 353, and 131 trials for 7+, 6−, 6+, 5−, 5+, 5a−, 5a+, and 4b− compartments, respectively). (B, D), Colored dots and error bars represent mean ± s.e.m. Red and blue colors correspond to AldC+ and AldC− compartments, respectively. ANOVA on GLMM fit: *p<0.05. (C) KS test: *p<0.05.

Figure 4—source data 1. Datasets used to create Figure 4.
DOI: 10.7554/eLife.47021.026

Figure 4.

Figure 4—figure supplement 1. Task-related CF signals in all the compartments.

Figure 4—figure supplement 1.

(A) ROI-averaged ΔF/F traces from single compartments in single trials were classified by trial types and averaged across sessions and animals. Thick colored lines represent mean and the shadings represent s.e.m. Vertical dashed lines represent cue onset, and gray solid lines represent the edges of response windows. (B) Averaged ΔF/F value within each response window per trial for each trial type pooled across sessions and animals ( 7+, n = 5 mice, 195, 30, and 155 trials for hit, FA, and CR trials; 6−, n = 6 mice, 305, 41, and 245 trials; 6+, n = 10 mice, 345, 39, and 261 trials; 5−, n = 12 mice, 555, 66, and 452 trials; 5+, n = 12 mice, 644, 78, and 553 trials; 5a−, n = 10 mice, 516, 70, and 454 trials; 5a+, n = 3 mice, 304, 49, and 302 trials; 4b−, n = 2 mice, 112, 19, and 120 trials). Colored dots represent means and gray crosses represent outliers. Asterisks represent significantly positive (red) or negative (blue) differences compared with pre-trial ΔF/F. One-way ANOVA with repeated measures followed by post-hoc Tukey’s test: *p<0.05, **p<0.01, ***p<0.001. (A,B) Only trials without appreciable licking (lick rate <1 Hz) during pre-trial period are included in the analyses.
Figure 4—figure supplement 1—source data 1. Datasets used to create Figure 4—figure supplements 1 and 3.
DOI: 10.7554/eLife.47021.023
Figure 4—figure supplement 2. Single ROI single trial CF signals.

Figure 4—figure supplement 2.

(A) Single trial calcium traces for single ROI in an example imaging session from a 5+ compartment. Trials detected as pre-cue decreases (P(↓)), early increases (E), and secondary increases (S) in CF signals in the 5+ compartment are indicated on the top. Note the coexistence of these responses in single trials and single ROIs. (B) Same as panels (A) but for late decreases (Late(↓)) in lick aligned traces. Vertical dashed lines represent cue onset, and solid lines represent the edges of response windows. Red bars represent their AldC+ identity.
Figure 4—figure supplement 3. CF signals at late timing during licking trials and nontask licking epochs.

Figure 4—figure supplement 3.

(A) ROI-averaged ΔF/F traces from single compartments in single licking trials (hit and FA) and nontask licking epochs were classified by trial types and averaged across sessions and animals. Thick colored lines represent means and the shadings represent s.e.m. Vertical dashed lines represent lick onset, and gray solid lines represent the edges of response windows. (B) Averaged ΔF/F value within each response window per trial for each trial type and epoch pooled across sessions and animals (hit, FA trials and non-task licking epochs; 7+, n = 5 mice, 240, 45, and 202 trials and epochs; 6−, n = 6 mice, 360, 59, and 281 trials and epochs; 6+, n = 10 mice, 435, 58, and 352 trials and epochs; 5−, n = 12 mice, 667, 94, and 460 trials and epochs; 5+, n = 12 mice, 761, 108, and 548 trials and epochs; 5a−, n = 10 mice, 631, 101, and 551 trials and epochs; 5a+, n = 3 mice, 365, 66, and 322 trials and epochs; 4b−, n = 2 mice, 143, 23, and 132 trials and epochs). Colored dots represent means and gray crosses represent outliers. Asterisks represent significantly positive (red) or negative (blue) differences compared with pre-trial ΔF/F. One-way ANOVA with repeated measures followed by post-hoc Tukey’s test: **p<0.01, ***p<0.001.

Given the involvement of cerebellar activity in motor preparation (Chabrol et al., 2019; Gao et al., 2018), we reasoned that these decreases in CF signals just before the presentation of a cue could be related to the preparation and/or initiation of licking. To test this possibility, we built a generalized linear model with mixed effects (GLMM) to fit single trial population averaged ΔF/F in single AldC compartments during the pre-cue time window, using the presence (1) or absence (0) of licking in the trial (see Materials and methods). We found that the pre-cue decreases in CF signals in the 5+ compartment (medial AldC+) were significantly correlated with the initiation of licking in the trial (p=0.04; Figure 4B), indicating their role in motor preparation.

The other possibility is that anticipatory decreases in CF signals represent a decrease in animal’s engagement in the task. To address this, we compared the latency of first lick during licking trials (hit and FA) with or without pre-cue decrease in CF signals in an AldC compartment (Figure 4C). We found that lick initiation was significantly delayed when there were pre-cue decreases in CF signals in the 5− compartment in the trial (p=0.03; Figure 4C). We also built a separate GLMM to fit single trial population averaged ΔF/F in single AldC compartments during the pre-cue time window using lick latency in the trial, and found that pre-cue decreases in CF signals in the 5− compartment were significantly correlated with longer lick latency (p=0.02; Figure 4D), indicating the role of CF inputs to this compartment in an animal’s attention to the task.

Early increases in CF signals are correlated with licking behavior and context discrimination

Early (0 to 0.5 s from cue) increases in CF signals were the most prominent feature in all of the AldC compartments that we observed (Figure 4—figure supplement 1), which was reliably captured on a single trial basis (Figure 5A and Figure 4—figure supplement 2). We assessed the behavioral relevance of these signals by examining the following three points.

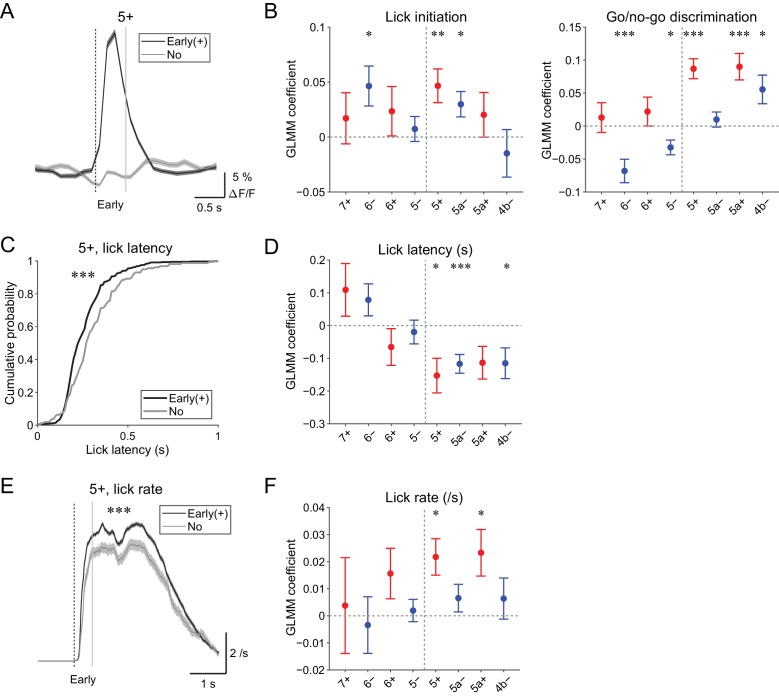
Figure 5. Behavioral relevance of early increase in CF signals.

Figure 5.

(A) Single trial calcium traces in a 5+ compartment with (early (+); black) or without (no; gray) increases in CF signals showing a difference in the early response window (0 to 0.5 s from cue onset). (B) Left, coefficients for lick initiation from GLMM fit for single trial ΔF/F during the early response window in each AldC compartment during all trials by the presence (1) or absence (0) of lick initiation in the trial and go (1) or no-go (0) cue in the trial (n = 5, 6, 10, 12, 12, 10, 3, and two mice; 393, 605, 649, 1,078, 1,281, 1,051, 664, and 253 trials for 7+, 6−, 6+, 5−, 5+, 5a−, 5a+, and 4b− compartments, respectively). Right, same as left, but coefficients for go/no-go cue. (C) Cumulative distributions of lick latency from cue onset during licking trials (hit and FA) with (early (+); black) or without (no; gray) early increases in CF signals in a 5+ compartment. (D) Coefficients for latency of lick initiation from GLMM fit for trial-by-trial ΔF/F during the early response window in each compartment during licking trials in the trial by the lick latency (n = 5, 6, 10, 12, 12, 10, 3, and two mice; 225, 346, 384, 621, 722, 586, 353, and 131 trials for 7+, 6−, 6+, 5−, 5+, 5a−, 5a+, and 4b− compartments, respectively). (E), Instantaneous lick rate during licking trials (hit and FA) with (early (+); black) or without (no; gray) early increases in CF signals in a 5+ compartment (n = 12 mice, 565 and 157 trials, respectively). (F) Same as panel (D), but coefficients are for the lick rate of the first lick bout in the trial. (A, E) Early response window is indicated by a dashed vertical line representing the cue onset and a gray vertical line. Thick lines and shadings represent mean ± s.e.m. (B, D, F) Colored dots and error bars represent mean ± s.e.m. Red and blue colors correspond to the AldC+ and AldC− compartments, respectively. ANOVA on GLMM fit: *p<0.05, **p<0.01, ***p<0.001. (C) KS test: ***p<0.001. (E) One-way ANOVA with repeated measures: ***p<0.001.

Figure 5—source data 1. Datasets used to create Figure 5.
DOI: 10.7554/eLife.47021.028

First, to differentiate sensory and motor components in the early CF signals, we used GLMM to fit single trial population averaged ΔF/F in single AldC compartments during the early response window using the presence (1) or absence (0) of lick in the trial and go (1) or no-go cue (0) in the trial. We found that early increases in CF signals in the 6−, 5+, and 5a− compartments were significantly correlated with lick initiation (p=0.03, 0.01, and 0.02; Figure 5B, left). Go and no-go cues were oppositely represented in the lateral and medial AldC compartments: early increases in CF signals in the 6− and 5− compartments (lateral AldC−) were significantly correlated with no-go cues (p=0.0008 and 0.01), whereas those in the 5+, 5a+, and 4b− compartments (medial AldC) were significantly correlated with go cues (p=2 × 10−7, 7 × 10−5, and 0.02; Figure 5B, right).

Second, we examined the role of CFs in motor timing (Llinás, 2011; Welsh et al., 1995; Welsh, 2002) in our task. We extracted licking trials (hit and FA) with or without early CF signals in an AldC compartment and compared the distribution of lick latency to the cue onset (Figure 5C). We found that the presence of early CF signals in the 5+ compartment was significantly correlated with shorter lick latency (p=3 × 10−5; Figure 5C). Indeed, GLMM fitting of single trial population averaged ΔF/F in single AldC compartments during licking trials using lick latency revealed significantly negative correlation in the 5+, 5a−, and 4b− compartments (medial AldC); lick latency was shorter with more CF signals in these AldC compartments (p=0.02, 0.0008, and 0.05; Figure 5D).

Last, we addressed whether the early CF signals are correlated with licking frequency (Bryant et al., 2010). We compared instantaneous lick rate in the licking trials with or without early CF signals in an AldC compartment, and found that the presence of early CF signals in the 5+ compartment was significantly correlated with faster lick rate (p=4 × 10−6; Figure 5E). GLMM fitting of single trial population averaged ΔF/F in single AldC compartments during licking trials (as in Figure 5D) revealed a significant positive correlation in the 5+ and 5a+ compartments (medial AldC+): lick rate was faster with more CF signals in these compartments (p=0.01 and 0.02; Figure 5F).

In summary, early increases in CF signals reflect lick initiation and context discrimination, and licking is shorter in latency and faster when CF signals show early increases in the medial AldC compartments.

Secondary increases in CF signals reflect speed of licking

Secondary increases in CF signals (0.5 to 1 s from the cue) were noted during hit trials in all the medial compartments (Figure 4—figure supplement 1), and these signals were reliably captured on a single trial basis (Figure 6A and Figure 4—figure supplement 2). Since these signals were observed after lick initiation, we reasoned that they could reflect parameters of already initiated licking such as lick rate. Therefore, we compared instantaneous lick rate in the licking trials with or without secondary increases in CF signals in an AldC compartment (Figure 6B). We found that the presence of secondary increases in CF signals in the 5a− compartment was significantly correlated with faster licking (p=0.02; Figure 6B). GLMM fitting of single trial population averaged ΔF/F in single AldC compartments using the lick rate of the first lick bout in the single licking trial revealed significantly positive correlation in the 5+, 5a−, and 4b− compartments (medial AldC); lick rate was faster with more CF signals in these AldC compartments (p=0.04, 0.04, and 0.008; Figure 6C), indicating the importance of the medial Crus II for speed of licking.

Figure 6. | Behavioral relevance of secondary increase in CF signals.

Figure 6.

(A) Single trial calcium traces in a 5a− compartment with (2nd (+); black) or without (no; gray) increases in CF signals showing difference during the secondary response window (0.5 to 1 s from cue onset). (B) Instantaneous lick rate during licking trials (hit and FA) with (2nd (+); black) or without (no; gray) increases in CF signals during the secondary response window in a 5a− compartment (n = 10 mice, 349 and 237 trials, respectively). (C) Coefficients of GLMM fit for single trial ΔF/F during the secondary response window in each AldC compartment during licking trials by lick rate of the first lick bout in the trial (n = 5, 6, 10, 12, 12, 10, 3, and two mice; 225, 346, 384, 621, 722, 586, 353, and 131 trials for 7+, 6−, 6+, 5−, 5+, 5a−, 5a+, and 4b− compartments, respectively). Colored dots and error bars represent mean ± s.e.m. Red and blue colors correspond to AldC+ and AldC− compartments, respectively. (A, B) The secondary response window is indicated by gray vertical lines. A dashed vertical line represents the cue onset. Thick lines and shadings represent means ± s.e.m. (B) One-way ANOVA with repeated measures: *p<0.05. (C) ANOVA on GLMM fit: *p<0.05, **p<0.01.

Figure 6—source data 1. Datasets used to create Figure 6.
DOI: 10.7554/eLife.47021.030

Late changes in CF signals represent positive reward outcomes

We discovered decreases in CF signals at late timing after lick initiation (1.2 to 2.2 s from lick onset) during hit trials in lateral AldC compartments (Figure 4—figure supplement 3), which were reliably captured on a single trial basis (Figure 7A). On the contrary, increases in CF signals during this time period were observed in the 5a− compartment (Figure 7B and Figure 4—figure supplement 3). Because this late timing corresponds to the offset of reward delivery, we reasoned that these signals could represent trial outcomes. Therefore, we fitted single trial population averaged ΔF/F in single AldC compartments during this late window by the presence (1) and absence (0) of reward in the trial using GLMM. We found that decreases in CF signals in all the lateral AldC compartments and in the 5+ compartment, as well as increases in the 5a− compartment, were significantly correlated with the presence of reward (7+, p=0.0002; 6−, p=3 × 10−12; 6+, p=1 × 10−12; 5−, p=2 × 10−7; 5+, p=0.0008; 5a−, p=3 × 10−5; Figure 7C), indicating that these signals reflect positive reward outcomes.

Figure 7. Late changes in CF signals represent positive reward outcomes.

Figure 7.

(A) Single trial calcium traces in a 6− compartment with (late (↓); black) or without (no; gray) decreases in CF signals during the late response window aligned to lick onset during licking trials (hit and FA) and non-task licking epochs (1.2 to 2.2 s from lick onset). (B) Same as panel (A) but for increases (late (+)) in a 5a− compartment. (C) Coefficients of GLMM fit for single trial ΔF/F during the late response window in each AldC compartment during licking trials (hit and FA) and non-task licking epochs by the presence (1) or absence (0) of reward in the trial (n = 5, 6, 10, 12, 12, 10, 3, and two mice; 427, 627, 736, 1081, 1270, 1137, 675, and 263 trials and epochs for 7+, 6−, 6+, 5−, 5+, 5a−, 5a+ and 4b− compartments, respectively). Colored dots and error bars represent means ± s.e.m. Red and blue colors correspond to AldC+ and AldC− compartments, respectively. ANOVA on GLMM fit: ***p<0.001. (A, B) The late response window is indicated by gray vertical lines. A dashed vertical line represents the lick onset. Light blue shadings represent the window for reward delivery. Thick lines and shadings represent means ± s.e.m.

Figure 7—source data 1. Datasets used to create Figure 7.
DOI: 10.7554/eLife.47021.032

Discussion

By combining a transgenic mouse line that allowed visualization of cerebellar modules, two-photon calcium imaging of population CF signals, and an auditory go/no-go task, we identified the spatial organization of CF signals across modules in the Crus II, which broadly corresponds to the expression of aldolase C/zebrin II and their mediolateral locations (Figure 8). CF signals in the AldC+ compartments show graded activity after sensory cues, reflecting the speed and duration of motor behavior, whereas those in the AldC− compartments show similar activity in response to sensory cues regardless of the presence and absence of motor behavior, and therefore represent a sensory response. CF signals in the lateral AldC compartments represent a sensory response, whereas those in the medial AldC compartments represent motor behavior. These spatially segregated CF signals represent the behavior of mice in a temporally organized manner: pre-cue decreases represent motor preparation; early increases represent motor initiation, timing, and speed, and go/no-go discrimination; secondary increases represent motor speed; and late decreases represent positive reward outcomes. These results constitute a comprehensive functional map of CF inputs to the Crus II (Figure 8) and provide insights into the region-specific contributions of the cerebellum to sensorimotor behavior.

Figure 8. Diversity of CF signals across the entire Crus II and their functional implications.
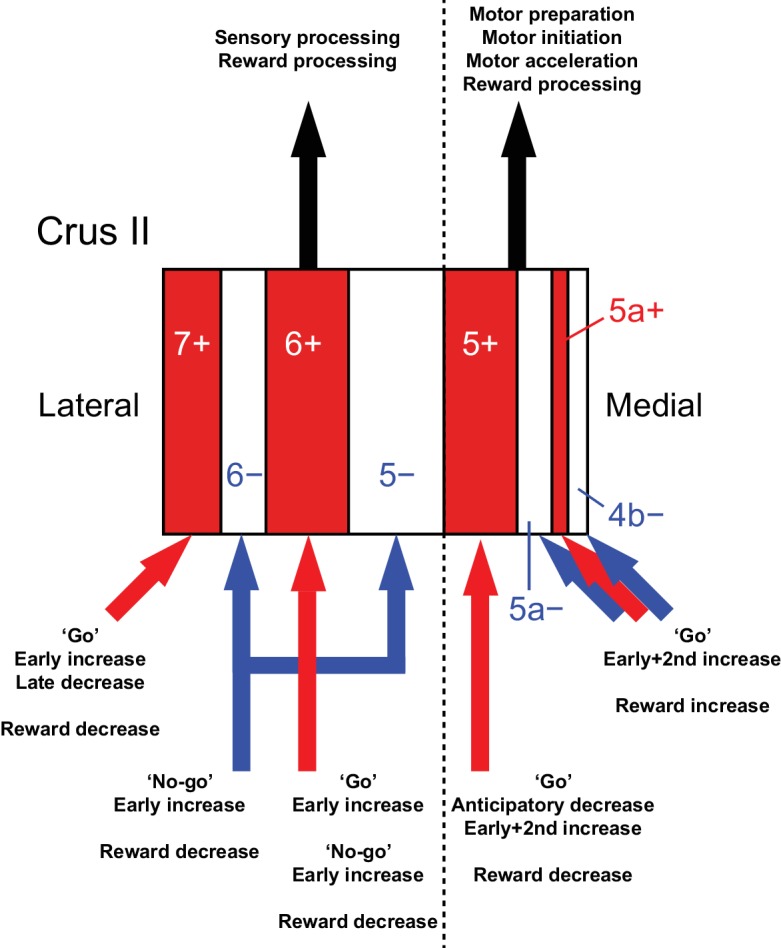
Figure 8.

A schematic of our main findings. Red and white stripes represent AldC+ and AldC− compartments, respectively. A dashed line represents the functional boundary of lateral and medial Crus II. Red and blue arrows represent CF inputs to each compartment. Black arrows represent outputs from lateral and medial Crus II.

Anatomical correlates of functional differences in CF inputs

In the present work, we have shown that CF signals in anatomically defined modules are broadly tuned to distinct functions, and have emphasized the importance of anatomical connectivity in determining behavioral function. In accordance with our observation of diverse task-related CF signals across AldC compartments (Figure 8), lesions of inferior olivary subnuclei have been reported to cause specific behavioral deficits in cats (Horn et al., 2010). According to a grouping of cerebellar modules on the basis of a detailed tracing study (Sugihara and Shinoda, 2004), group I compartments (7+, 6+, and 5+) are innervated by CFs originating from the principal olive and neighboring areas. These compartments receive inputs from the cerebral cortex via the nuclei in the mesodiencephalic junction, including the red nucleus, area parafascicularis prerubralis, and nucleus of Darkschewitsch (Stuesse and Newman, 1990; Swenson and Castro, 1983; Veazey and Severin, 1982). Furthermore, a recent study showed that perioral tactile information is directly conveyed by a pathway from the periphery to the Crus II via the mesodiencephalic junction and inferior olive (Kubo et al., 2018). Group IV compartments (6− and 5−) receive CF inputs from the dorsomedial group of the principal olive and the medial part of the dorsal accessory olive, which receive somatosensory inputs from the spinal cord, dorsal column nuclei, and trigeminal nucleus (Molinari et al., 1996; Swenson and Castro, 1983). Group II (5a+, 4b+, and 4+) and III compartments (5a− and 4b−) are innervated by CFs from the medial subnuclei and medial accessory olive, which receive somatosensory inputs from the spinal cord as well as vestibular and collicular inputs (Akaike, 1992; Boesten and Voogd, 1975; Brown et al., 1977; Swenson and Castro, 1983). Therefore, the CF inputs to group I (7+, 6+, and 5+) compartments mainly convey information from the cerebral cortex, while the majority of CF inputs to group IV and II/III compartments (6−, 5−, 5a−, 5a+, 4b−, 4b+, and 4+) send sensory information from the periphery. In terms of outputs, only PCs in the lateral part of group I and IV compartments (7+, 6−, and 6+) project to the dentate nucleus (Sugihara, 2011), which in turn projects back to a wide range of brain regions, including the motor and association cortices (Dum and Strick, 2003). PCs located in the medial part of group I and IV compartments (5− and 5+) and those in group II/III compartments (5a−, 5a+, 4b−, 4b+, and 4+) project to the sensorimotor cortex via interpositus and fastigial nuclei, respectively (Sugihara, 2011). These differences in anatomical projections could account for the functional differences that we observed in CF inputs across AldC compartments.

AldC modules provide a functional reference for CF inputs

Our analyses on the functional clustering of CF signals revealed broad congruence between the boundaries of the functional clusters and those of AldC expression (Figure 2D and Figure 2—figure supplement 1–4), indicating that the AldC profile can be used as an approximate for cerebellar functional modules at both cellular and microzonal resolutions. Previous studies have suggested several functional differences between AldC+ and AldC− PCs: (i) AldC+ PCs have a lower simple spike rate and a higher complex spike rate than AldC− PCs, which are dependent on co-expressing TRPC3 subtypes (Zhou et al., 2014); (ii) coupling between simple spikes and complex spikes is enhanced in AldC+ PCs (Tang et al., 2017); (iii) AldC+ PCs receive enhanced glutamate release by CF inputs when compared with AldC− PCs (Paukert et al., 2010), but show no difference in parallel fiber-PC synapses (Nguyen-Minh et al., 2018); (iv) at the population level, CF inputs to AldC+ and AldC− compartments are separately and precisely synchronized at the cellular resolution (Tsutsumi et al., 2015); and (v) AldC+ and AldC− PCs have been shown to respond differently to optic flow stimulation in the pigeon cerebellum (Graham and Wylie, 2012). In the present study, we found that more AldC+ PCs than AldC− PCs receive motor-related CF inputs (Figure 2F). Furthermore, the spatial organization of CF signals broadly corresponded to the AldC expression boundaries at both the microzone level (Figure 2—figure supplement 1) and the single cell level (Figure 2—figure supplement 2–4). This spatial clustering of similarly behaviorally relevant CF inputs benefits in terms of outputs because of an expected convergence of these densely clustered PCs on downstream neurons in the cerebellar nuclei, which exclusively read out synchronous inputs from these PCs (Bengtsson et al., 2011; Person and Raman, 2012; Tang et al., 2019). In addition to the CF system, future work on the differences in behaviorally relevant simple spike outputs from AldC+ and AldC− PCs will give us a comprehensive understanding of their complementary role in behavioral control.

Mediolateral functional differences in CF inputs to the Crus II

Mediolateral difference in cerebellar function remains poorly characterized, although clear differences in anatomical projections (Apps and Hawkes, 2009; Sugihara and Shinoda, 2004; Sugihara, 2011) and functional couplings between the other brain areas (Marek et al., 2018) have been shown. In relation to AldC compartments, complex spike firing has been shown to be synchronized exclusively within AldC compartments in the lateral Crus II, whereas it can be synchronized across AldC compartments in the medial Crus II (Sugihara et al., 2007). These findings are further supported by our previous (Tsutsumi et al., 2015) and present findings (Figure 2—figure supplement 2C). However, behaviorally relevant CF signals across the entire mediolateral axis of a cerebellar lobule have never been investigated.

We found that CF signals in the medial Crus II were more representative of motor behavior, in that during hit trials, more CFs respond in the medial Crus II than in the lateral Crus II, and the responses are graded on the basis of lick rate (Figure 3C and D). Anticipatory decreases in CF signals in the medial Crus II were correlated with subsequent initiation of licking (Figure 4B), and early increases in these signals were correlated with lick initiation, presence of go cues, shorter lick latency, and faster licking (Figure 5B,D and F), suggesting their involvement in motor execution. Sharp peaks in CF signals in the medial Crus II at the onset of spontaneous licking (black lines in Figure 4—figure supplement 3) further support this notion. Moreover, secondary increases in CF inputs were observed almost exclusively in the medial Crus II (Figure 4—figure supplement 1) and they reflected faster licking during licking trials (Figure 6C), indicating their role in online control of licking.

By contrast, CF signals in the lateral Crus II were more representative of sensory responses, in that during CR trials, more CF signals were observed there than in the medial Crus II, and the responses were equally observed irrespective of licking or even pronounced after no-go cues (Figure 3C and D), although movements such as jaw opening or tightening of the mouth specific to no-go cues could also contribute to these signals. Anticipatory decreases in CF signals in the lateral Crus II were correlated with delay in lick initiation (Figure 4B), which could be interpreted as a representation of lower attention to the task or as intention to delay the motor initiation (suppression of impulsive behavior). Early increases in these signals were correlated with the presence of no-go cues, but not with licking behavior (Figure 5B,D and F). Moreover, CF signals were sharply time-locked to sensory cues without a secondary rise during licking trials (Figure 4—figure supplement 1), together indicating their sensory nature.

These findings imply distinct behavioral functions of CF inputs to the lateral and medial cerebellum: CF inputs to the lateral Crus II might represent sensory saliency and/or attention signals, which could be conveyed via the dentate nucleus to be used for higher-order processing in the association cortices, whereas CF inputs to the medial Crus II could control motor behavior online (Welsh et al., 1995) by indirect projections, via the interpositus and fastigial nuclei, to either the motor cortex or brainstem motor neurons. Close monitoring of licking behavior (Gaffield and Christie, 2017) together with high temporal resolution imaging or targeted electrical recording from PCs will elucidate how the tongue trajectory is controlled by CF inputs to the medial Crus II. Sensory demanding task such as multi-sensory discrimination could further address the sensory function of CF signals in the lateral Crus II.

Mechanisms of anticipatory decreases in CF inputs to the Crus II

We discovered a decrease in population CF signals for an upcoming sensory cue during the period when the mice were not licking (–1 to 0 s from cue onset; Figure 4A and B). In our task design, expert mice could predict the timing of cue presentation because the inter-trial interval was fixed at 6 s. We found that this anticipatory decrease in CF signals was associated with the subsequent initiation of licking (5+; Figure 4B), or with delay in lick initiation (5–; Figure 4D), which could reflect motor preparation, timing prediction, or shift in attention (engagement in the task). Given the anticipatory ramping-up activity in dentate nuclear neurons in monkeys representing timing prediction (Ashmore and Sommer, 2013; Ohmae et al., 2017), as well as fastigial/dentate nuclear neurons in mice representing motor preparation (Chabrol et al., 2019; Gao et al., 2018), the anticipatory decreases in CF signals that we observed could reflect ramping-up activity in these cerebellar nuclei via nucleo-olivary inhibitory projections (Hesslow, 1986). Simultaneous recordings from pairs of PCs and cerebellar nuclear neurons using highly efficient electrodes (Jun et al., 2017) will further elucidate the mechanism for how the decrease in CF signals contributes to anticipatory and preparatory activity in the cerebellum.

Mechanisms of reward-related decreases in CF inputs to the Crus II

Positive reward outcomes were represented by decreases in CF signals at long latency (>1 s) in the lateral Crus II, and by increases in one of the medial AldC compartments (Figure 7 and Figure 4—figure supplement 3). The reward outcome-related CF signals were consistent with recent reports (Heffley et al., 2018; Heffley and Hull, 2019; Kostadinov et al., 2019). Extremely long latency (~2.2 s from lick onset) of CF signals could be explained by longer duration of our reward delivery (0.41–1.23 s from lick; Figure 7A and B; see 'Materials and methods'). The lateral Crus II is reciprocally connected with the ventral tegmental area (Ikai et al., 1992). Furthermore, dopamine D1 receptors are expressed on a subset of neurons in the dentate nucleus, which has been shown to contribute to cognitive behavior (Locke et al., 2018). Therefore, it is possible that midbrain dopamine neurons send positive reward outcome-related information to the dentate nuclei, which in turn send inhibitory projections to the inferior olive, thus causing decreases in CF inputs to the lateral Crus II. This putative pathway could contribute to reward-based reinforcement learning of goal-directed behavior.

Conclusions

Comprehensive monitoring of CF signals in the Crus II under the context of go/no-go discrimination behavior revealed the spatiotemporal organization of behaviorally relevant functions that broadly correspond to AldC expression and mediolateral locations. CF signals in AldC+ PCs represent motor behavior, whereas those in AldC– PCs represent sensory response. CF signals in the lateral Crus II represent sensory aspects of the behavior, whereas those in the medial Crus II are correlated with motor execution. Together, temporally orchestrated activation of spatially organized CF inputs in the cerebellar hemisphere could be a basis for implementing sophisticated behavior.

Materials and methods

Key resources table.

Reagent type Designation Source Identifier
Recombinant DNA reagent pENN.AAV1.CMVs.PI.Cre.rBG Addgene RRID: Addgene_105537
Recombinant DNA reagent pAAV1.CAG.Flex.GCaMP6f.WPRE.SV40 Addgene RRID: Addgene_100835
Genetic Reagent (Mus musculus) C57BL/6NCrSlc Japan SLC, Inc RRID: MGI:5295404
Genetic Reagent (Mus musculus) Aldoc-tdTomato KI,
C57BL/6N-Aldoc<tm1(tdTomato)Ksak>
RIKEN BioResource Center MGI:6324252
Software, algorithm Matlab MathWorks RRID: SCR_001622
Software, algorithm Labview National Instruments RRID: SCR_014325
Software, algorithm Suite2P GitHub https://github.com/cortex-lab/Suite2P
Software, algorithm Lick/no-lick task GitHub https://github.com/stsutsumi223/Aldoc-behavior

Animals

All experiments were approved by the Animal Experiment Committees of the University of Tokyo (#P08-015) and University of Yamanashi (#A27-1). Adult male heterozygous Aldoc-tdTomato mice (n = 17) (Tsutsumi et al., 2015) and adult male wild-type mice (Japan SLC, Inc, n = 5) at postnatal days 40–90 were used. The Aldoc-tdTomato mice did not show any noticeable behavioral phenotype. The mice were maintained on a reverse-phase 12 hr/12 hr light-dark cycle. All experiments were performed during the dark phase. Food was provided ad libitum but water intake was restricted to 1 mL/day during the task training. The Aldoc-tdTomato mouse line is available from the corresponding authors upon reasonable request, and the mice are also available at RIKEN BioResource Center (RBRC10927).

Surgery and virus injection

Mice were anesthetized with isoflurane (5% for induction; 1.5–2.5% for maintenance). A mixture of drugs comprising the anti-inflammatory drug flunixin (2.5 mg/kg) and the antibiotics sulfadiazine (24 mg/kg) and trimethoprim (4.8 mg/kg) was injected intraperitoneally just before the skin incision. The exposed skull was covered with dental adhesive resin cement (Superbond; Sun Medical). A custom-made head plate (O’Hara and Co.) was fixed to the skull using photo-coagulative resin (Panabia; Kuraray). A 2.5 mm cranial window was created over the left Crus II (4 mm lateral from midline and 2 mm caudal from lambda). A pulled glass pipette (broken and beveled to an outer diameter of 30 µm) and a 5 µL Hamilton syringe were back-filled with a fluorine-based inert liquid (Fluorinert; 3M) and front-loaded with a virus solution. A mixture of adeno-associated viruses (total: 200 nL; pAAV1.CAG.Flex.GCaMP6f.WPRE.SV40 and pENN.AAV1.CMVs.PI.Cre.rBG at 1:1; Addgene; not diluted from original stock with ≥1 × 1013 vg/mL) (Najafi et al., 2014) was injected directly into the left Crus II at a rate of 20 nL/min using a syringe pump (UMP3−1; WPI). The axis of the pipette was angled at 15° from the vertical axis and advanced by 270 µm from the pia along the axis of the pipette. After the injection, the pipette was kept in place for 5 min. The injection was performed twice at the medial and lateral parts of the Crus II. A 3 mm diameter glass coverslip (number 0 thickness; Matsunami Glass) was directly mounted over the dura, and its edge was sealed with tissue adhesive (Vetbond; 3M) and dental adhesive resin cement (ADFA; Shofu). After the surgery, mice were singly housed and allowed to recover for 8–14 days. Sulfadiazine/trimethoprim antibiotics were included in the drinking water (12 g/L) during the recovery period. Abnormal behavior was not observed after AAV injections.

Task training

For efficient training of mice to perform a lick/no-lick task under head fixation, we used a task training apparatus (O’Hara and Co.) similar to that described previously (Isomura et al., 2009). Water intake was restricted to 1 mL/day for 3 days before the onset of task training. Water was only provided from the lick port during task training. When mice failed to maintain 85% of their initial body weight after the task session, additional water (1–2 mL) was provided. Mice were trained once daily and typically underwent 3 days of pre-training sessions that consisted of two steps. First, mice were acclimated to a head-fixed configuration, and every lick on the lick port was rewarded with 2 μL of 0.1% saccharine solution (maximum: 2 μL/s) (Isomura et al., 2013). During the following 2 days, go cues (10 kHz tone) and no-go cues (4 kHz tone) were provided randomly. Only licks within 1 s after either cue were rewarded with 6 μL of saccharine solution (2 μL × 3; 0.41–1.23 s from lick onset; Figure 7A and B). The inter-trial interval was set at 6 s, but the subsequent trial was delayed by 1 s from the last lick if the mouse continued to lick. Once their success rate for the task exceeded 80%, the mice proceeded to a lick/no-lick task. In this task, licking of the port within 1 s after the go cue was rewarded with 6 μL of saccharine solution, whereas licking within 1 s after the no-go cue was punished with a time-out of 4.5 s. All tasks were controlled and recorded at 100 Hz (n = 16 mice) or 200 Hz (n = 1 mouse) by a custom-written program (Tsutsumi, 2019; copy archived at https://github.com/elifesciences-publications/Aldoc-behavior) using LabVIEW software (National Instruments). Licking behavior was monitored by the tongue crossing a line between infrared laser detectors (O’Hara and Co; Figure 1A).

Muscimol injection

The GABAA receptor agonist muscimol (40–70 nL, 10 μg/μL) was pressure-injected directly into the left Crus II at the center of the cranial window of well-trained wild-type mice (n = 5) using a glass capillary micropipette. At 30–60 min after muscimol injection, the lick/no-lick task session was started. The effect was observed throughout the session (~1 hr), but disappeared on the following day. For control experiments, mice were injected with the same amount of saline in the left Crus II on the following day, and started the task after 30–60 min.

Behavior analysis

To evaluate the performance in the go/no-go task, we calculated the fraction of correct (hit and CR) trials and defined 80% as an expert performance (Figure 1E). For hit and FA trials, licking behavior within 4 s from the cue onset was analyzed (Figure 1—figure supplements 1 and 2). A lick bout was defined as a cluster of licks wherein the inter-lick interval was less than 1 s. Lick onset and offset were defined as the onset and offset of the first lick bout in each trial, respectively. Instantaneous lick rate was calculated as the inverse of the inter-lick interval and was assigned at each time point. The coefficient of variation (CV2), which was used to assess the regularity of licks (Figure 1—figure supplements 1 and 2), was calculated as described previously (Holt et al., 1996). Non-task licking epochs (nontask; Figure 4—figure supplement 3) were determined as a lick bout isolated from cues (at least 1 s before cues), meaning that the bout could not be associated with cues (spontaneous licking without a reward).

Two-photon imaging

During the lick/no-lick task, two-photon imaging was performed using a two-photon microscope (MOM; Sutter Instruments) equipped with a 40 × objective lens (Olympus) controlled by ScanImage software (Vidrio Technologies) (Pologruto et al., 2003). Two-photon excitation was achieved with a pulsed Ti:sapphire laser (Mai Tai HP; Spectra-Physics) at a wavelength of 910 nm. The laser power was adjusted to ensure that it was below 40 mW at the sample to avoid phototoxicity. Fluorescence signals were divided into green and red channels with a dichroic mirror and emission filters (Chroma), and detected with GaAsP photomultiplier tubes (Hamamatsu Photonics). A pair of Galvano scanners was used for the first batch of mice (n = 3), and a resonant scanner was used for the remaining mice (n = 14). The imaging field was 180 × 230 μm at a depth of ~50 μm from the pia, with a resolution of 128 × 128 pixels. Two thousand frames were acquired at 7.8125 Hz (256 s) for the first batch (n = 3), and 28,910 frames were acquired at 109.86 Hz with 14 frame averaging (net: 7.8471 Hz; 263 s) for the second batch (n = 13). For a separate mouse (n = 1), 28,770 frames were acquired at 107.18 Hz (268 s) without frame averaging.

First, tdTomato fluorescence on the red channel was imaged to identify the AldC compartments in the whole Crus II using the relative locations and widths of the compartments (Sugihara and Quy, 2007; Tsutsumi et al., 2015). Diagrams in Figures 2A and 3E were created by manually tracing the boundary of tdTomato expression in a single animal. Typically, the 6+/5− boundary was at the center of the cranial window (4 mm lateral from midline and 2 mm caudal from lambda), and the relative locations of the 7+/6−, 6−/6+, 5−/5+, 5+/5a−, 5a−/5a+, and 5a+/4b− boundaries were 0.59 ± 0.05, 0.41 ± 0.04, –0.28 ± 0.05, –0.56 ± 0.05, –0.71 ± 0.09, and −0.80 ± 0.08 mm from the center of the window (n = total 10 mice; mean ± s.d.); corresponding to 4.59, 4.41, 3.72, 3.44, 3.29, and 3.20 mm lateral from midline, respectively.

Next, GCaMP6f calcium imaging was performed on the green channel at the boundaries of aldolase C expression. Before starting each imaging session, a tdTomato image on the red channel was obtained for reference (Figures 2B and 3A, Figure 2—figure supplements 2B and 3A, and Figure 3—figure supplement 2A). According to our functional separation of the Crus II, the 5−/5+ boundary (3.72 mm lateral and 2 mm caudal from lambda) delineates the lateral and medial Crus II (Figure 3E and Figure 3—figure supplement 2C).

Imaging analysis

Imaging data was analyzed using MATLAB software (R2018a; MathWorks). To correct motion artifacts in the x-y plane and to extract regions of interest (ROIs) corresponding to PC dendrites, the Suite2P algorithm (Pachitariu et al., 2017) was used. Typical parameters were used for ROI extraction: Nk0 = 120 (number of clusters to start with), Nk = 60 (number of clusters to end with), sig = 0.5 (spatial smoothing length in pixels), and diameter = 2 (expected diameter of dendrites). After image registration and automatic ROI extraction, ROIs corresponding to PC dendrites were manually selected and non-PC-like ROIs were curated on the basis of the following criteria: (1) the shape of the ROI did not resemble that of a PC dendrite, being round or vessel-shaped for example; (2) a calcium trace generated by the mean pixel fluorescence in the ROI did not show a characteristic calcium increase caused by CF inputs (fast rise and slow decay); (3) calcium signals were saturated, such that an increase in fluorescence was sustained over a period in the order of seconds; and (4) the signal-to-noise ratio was too low (the lowest signal-to-noise ratio in our dataset was 5.68).

To reduce multiple counting of single PC dendrites as a result of oversegmentation, ROIs were merged if they satisfied the following criteria: (1) ROIs were adjacent or separated by two dendrites mediolaterally; and (2) the correlation coefficient between calcium traces from the ROIs was greater than 0.75. This process was iterated until no ROI pairs satisfied the criteria. After completion of these processing steps, imaging data that included at least five PCs on both sides of an AldC expression boundary obtained during an expert behavioral performance (fraction correct: >80%) were used for further analyses (total: 94 imaging sessions). The number of cells expressing GCaMP6f was counted on the basis of z-stacks obtained by two-photon imaging. We found that 53% of PCs (n = 5 stacks; 9.40 ± 0.51 cells/104 μm2) and 6% of molecular layer interneurons (n = 5 stacks; 5.37 ± 3.44 cells/106 μm3) expressed GCaMP6f, showing that molecular layer interneurons contributed only 5% of the total fluorescence signals at most.

Event detection

ΔF/F was calculated from the raw fluorescence traces using the following equation: (F – F0) / (F0 – Fb), where F is the raw fluorescence value, F0 is the 8th percentile of the fluorescence values of the surrounding 12 imaging frames (−6 frame to +6 frame; total: 13 frames), and Fb is the minimum fluorescence value of the mean image (Ozden et al., 2012). Response to the task was determined by an averaged ΔF/F trace for a given response window: pre-trial, −2 to −1 s from cue onset; pre-cue, −1 to 0 s from cue onset; early, 0 to 0.5 s from cue onset; and secondary, 0.5 to 1 s from cue onset (Figure 4—figure supplement 1). An additional response window was defined for lick bout onset-aligned traces: pre-lick, −2 to −1 s from lick onset; late, 1.2 to 2.2 s from lick onset (Figure 4—figure supplement 3). Responsive ROIs for each trial type for each response window (Figures 2F and 3C and D, Figure 3—figure supplement 1) were determined on the basis of trial-averaged ΔF/F within a response window exceeding mean + 2 s.d. of the baseline, which was defined as a ΔF/F trace that was less than the absolute Z-score of 1 calculated from the whole ΔF/F trace in an imaging session. For the calculation of response probability of single ROIs (Figure 2—figure supplement 1), a significantly positive response was determined on the basis that the single trial ΔF/F trace averaged within the early response window exceeded the mean + 2 s.d. of the baseline. Then the response probability was defined as the number of trials with the significantly positive response divided by the total number of trials for each trial type. Response of an AldC compartment was determined by using the same method, where a single trial population averaged ΔF/F trace was used instead of a single ROI ΔF/F trace. Mean + 2 s.d. and mean –0.5 s.d. values of the baseline ΔF/F trace of the AldC compartment were determined as thresholds to detect significantly positive and negative responses in each trial for each response window (Figures 47 and Figure 4—figure supplement 2). For analyses of the pre-cue period, only trials without any appreciable licking (<1 Hz) during the pre-trial period were taken into account (Figure 4 and Figure 4—figure supplement 2) in order to remove false positives resulting from differences in licking activities between these periods.

GCaMP6f-dependent Ca2+ increases in PC dendrites evoked by CF inputs are shown to have ~33 ms in rise and ~100 ms in decay (Gaffield et al., 2016), which is fast enough to detect individual CF inputs (~1/ s). To ensure that the Ca2+ signals that we observed correspond to complex spike firing in PCs, we detected Ca2+ events during baseline (pre-trial period; −2 to −1 s from cue onset) by using local peak exceeding mean + 2 s.d. of whole trace (Mukamel et al., 2009). Baseline event rates were higher for AldC+ PCs than for AldC– PCs (n = 1295 and 1219 ROIs; 0.46 ± 0.02 and 0.43 ± 0.02 events/s; p=0.0012; paired t test), which was opposite to the data described in a previous report (Zhou et al., 2014). Absolute event rates were much lower than the reported values in awake mice (Zhou et al., 2014), which might be because of the poor temporal resolution of our imaging (7.8 frames/s): more than one complex spike could be included in the single detected event. Even if this is not the case, our result could be consistent with a homeostatic modulation of complex spike firing rate (Ju et al., 2019): frequent sensory stimulation causes a decrease in baseline complex spike firing rate.

Generalized linear model with mixed effects (GLMM)

For the GLMM analyses in Figures 47, we fit a single trial population average ΔF/F in single AldC compartments for each response window by using one or two predictor variables as fixed effects and a mouse label as a random effect, as in the following equation:

ΔF/F=β0+β1×fixedeffect1+(β2×fixedeffect1)+b

where β is coefficient of the fit (minimizing the difference between the model and the actual data), and b is a random effect (considering across mice variance). We used the MATLAB function fitglme to perform this calculation. We assumed normal distribution for the ΔF/F. Significance of coefficient for each fixed effect was determined by comparing model fit by removing that variable from the model.

Statistics

All statistical analyses were performed using MATLAB software. All tests were two-tailed and significance was assigned to p=0.05. Data are represented as mean ± s.e.m. unless otherwise stated. Neither randomization nor blinding was performed in this study. Statistical significances and effect sizes for all the analyses are provided as Supplementary file 1.

Acknowledgements

We thank Dr Mayumi Tada for her participation in the preliminary experiments, Dr Manabu Abe for the accession of the Aldoc-tdTomato mouse, and Drs Mitsuo Kawato and Keisuke Toyama, as well as members of the Kitamura and Kano laboratories, for helpful discussions. We also thank Alison Sherwin, PhD, from Edanz Group (www.edanzediting.com/ac) for editing a draft of this manuscript. This work was supported by JSPS KAKENHI (23115504, 25560432, 25113705, 25115705, 25290003, 15H01426, 17H03543, and 17H06313 to KK; 21220006, 25000015 and 18H04012 to MK); by Grants-in-Aid for Scientific Research on Innovative Areas (Comprehensive Brain Science Network and Brain Information Dynamics) from MEXT, Japan; by the Strategic Research Programme for Brain Sciences (Development of Biomarker Candidates for Social Behaviour) from MEXT, Japan (to MK); by Brain Mapping by Integrated Neurotechnologies for Disease Studies (Brain/MINDS) from AMED, Japan (to KK and MK); by the Takeda Science Foundation (to KK); and by the Uehara Memorial Foundation (to KK).

Funding Statement

The funders had no role in study design, data collection and interpretation, or the decision to submit the work for publication.

Contributor Information

Shinichiro Tsutsumi, Email: stsutsumi@m.u-tokyo.ac.jp.

Masanobu Kano, Email: mkano-tky@m.u-tokyo.ac.jp.

Kazuo Kitamura, Email: kitamurak@yamanashi.ac.jp.

Ronald L Calabrese, Emory University, United States.

Megan R Carey, Champalimaud Foundation, Portugal.

Funding Information

This paper was supported by the following grants:

  • Japan Society for the Promotion of Science 23115504 to Kazuo Kitamura.

  • Ministry of Education, Culture, Sports, Science, and Technology Comprehensive Brain Science Network to Kenji Sakimura, Masanobu Kano, Kazuo Kitamura.

  • Ministry of Education, Culture, Sports, Science, and Technology Brain Information Dynamics to Kazuo Kitamura.

  • Ministry of Education, Culture, Sports, Science, and Technology The Strategic Research Programme for Brain Sciences to Masanobu Kano.

  • Japan Agency for Medical Research and Development Brain/MINDS to Masanobu Kano, Kazuo Kitamura.

  • Takeda Science Foundation to Kazuo Kitamura.

  • Uehara Memorial Foundation to Kazuo Kitamura.

  • Japan Society for the Promotion of Science 25560432 to Kazuo Kitamura.

  • Japan Society for the Promotion of Science 25113705 to Kazuo Kitamura.

  • Japan Society for the Promotion of Science 25115705 to Kazuo Kitamura.

  • Japan Society for the Promotion of Science 25290003 to Kazuo Kitamura.

  • Japan Society for the Promotion of Science 15H01426 to Kazuo Kitamura.

  • Japan Society for the Promotion of Science 17H03543 to Kazuo Kitamura.

  • Japan Society for the Promotion of Science 17H06313 to Kazuo Kitamura.

  • Japan Society for the Promotion of Science 21220006 to Masanobu Kano.

  • Japan Society for the Promotion of Science 25000015 to Masanobu Kano.

  • Japan Society for the Promotion of Science 18H04012 to Masanobu Kano.

Additional information

Competing interests

No competing interests declared.

Author contributions

Conceptualization, Data curation, Software, Formal analysis, Validation, Investigation, Visualization, Methodology, Writing—original draft, Project administration, Writing—review and editing.

Investigation, Methodology, Writing—review and editing.

Investigation, Methodology, Writing—review and editing.

Investigation, Methodology, Writing—review and editing.

Resources, Methodology, Writing—review and editing.

Conceptualization, Supervision, Funding acquisition, Methodology, Writing—review and editing.

Conceptualization, Supervision, Funding acquisition, Validation, Investigation, Methodology, Writing—original draft, Project administration, Writing—review and editing.

Ethics

Animal experimentation: All experiments were approved by the Animal Experiment Committees of the University of Tokyo (#P08-015) and University of Yamanashi (#A27-1).

Additional files

Supplementary file 1. Statistics results.

Complete statistics results for all the figures.

elife-47021-supp1.xls (115.5KB, xls)
DOI: 10.7554/eLife.47021.034
Transparent reporting form
DOI: 10.7554/eLife.47021.035

Data availability

Data analysed for all the figures are included in the manuscript and source data files. The Aldoc-tdTomato mouse line is available at RIKEN Bio Resource Center (RBRC10927).

References

  1. Akaike T. The tectorecipient zone in the inferior olivary nucleus in the rat. The Journal of Comparative Neurology. 1992;320:398–414. doi: 10.1002/cne.903200311. [DOI] [PubMed] [Google Scholar]
  2. Apps R, Hawkes R. Cerebellar cortical organization: a one-map hypothesis. Nature Reviews Neuroscience. 2009;10:670–681. doi: 10.1038/nrn2698. [DOI] [PubMed] [Google Scholar]
  3. Ashmore RC, Sommer MA. Delay activity of saccade-related neurons in the caudal dentate nucleus of the macaque cerebellum. Journal of Neurophysiology. 2013;109:2129–2144. doi: 10.1152/jn.00906.2011. [DOI] [PMC free article] [PubMed] [Google Scholar]
  4. Bengtsson F, Ekerot CF, Jörntell H. In vivo analysis of inhibitory synaptic inputs and rebounds in deep cerebellar nuclear neurons. PLOS ONE. 2011;6:e18822. doi: 10.1371/journal.pone.0018822. [DOI] [PMC free article] [PubMed] [Google Scholar]
  5. Boesten AJ, Voogd J. Projections of the dorsal column nuclei and the spinal cord on the inferior olive in the cat. The Journal of Comparative Neurology. 1975;161:215–237. doi: 10.1002/cne.901610206. [DOI] [PubMed] [Google Scholar]
  6. Brochu G, Maler L, Hawkes R. Zebrin II: a polypeptide antigen expressed selectively by purkinje cells reveals compartments in rat and fish cerebellum. The Journal of Comparative Neurology. 1990;291:538–552. doi: 10.1002/cne.902910405. [DOI] [PubMed] [Google Scholar]
  7. Brown JT, Chan-Palay V, Palay SL. A study of afferent input to the inferior olivary complex in the rat by retrograde axonal transport of horseradish peroxidase. The Journal of Comparative Neurology. 1977;176:1–22. doi: 10.1002/cne.901760102. [DOI] [PubMed] [Google Scholar]
  8. Bryant JL, Boughter JD, Gong S, LeDoux MS, Heck DH. Cerebellar cortical output encodes temporal aspects of rhythmic licking movements and is necessary for normal licking frequency. European Journal of Neuroscience. 2010;32:41–52. doi: 10.1111/j.1460-9568.2010.07244.x. [DOI] [PMC free article] [PubMed] [Google Scholar]
  9. Chabrol FP, Blot A, Mrsic-Flogel TD. Cerebellar contribution to preparatory activity in motor neocortex. Neuron. 2019;103:506–519. doi: 10.1016/j.neuron.2019.05.022. [DOI] [PMC free article] [PubMed] [Google Scholar]
  10. Chen TW, Wardill TJ, Sun Y, Pulver SR, Renninger SL, Baohan A, Schreiter ER, Kerr RA, Orger MB, Jayaraman V, Looger LL, Svoboda K, Kim DS. Ultrasensitive fluorescent proteins for imaging neuronal activity. Nature. 2013;499:295–300. doi: 10.1038/nature12354. [DOI] [PMC free article] [PubMed] [Google Scholar]
  11. Dum RP, Strick PL. An unfolded map of the cerebellar dentate nucleus and its projections to the cerebral cortex. Journal of Neurophysiology. 2003;89:634–639. doi: 10.1152/jn.00626.2002. [DOI] [PubMed] [Google Scholar]
  12. Gaffield MA, Amat SB, Bito H, Christie JM. Chronic imaging of movement-related purkinje cell calcium activity in awake behaving mice. Journal of Neurophysiology. 2016;115:413–422. doi: 10.1152/jn.00834.2015. [DOI] [PMC free article] [PubMed] [Google Scholar]
  13. Gaffield MA, Christie JM. Movement rate is encoded and influenced by widespread, coherent activity of cerebellar molecular layer interneurons. The Journal of Neuroscience. 2017;37:4751–4765. doi: 10.1523/JNEUROSCI.0534-17.2017. [DOI] [PMC free article] [PubMed] [Google Scholar]
  14. Gao Z, Davis C, Thomas AM, Economo MN, Abrego AM, Svoboda K, De Zeeuw CI, Li N. A cortico-cerebellar loop for motor planning. Nature. 2018;563:113–116. doi: 10.1038/s41586-018-0633-x. [DOI] [PMC free article] [PubMed] [Google Scholar]
  15. Graham DJ, Wylie DR. Zebrin-immunopositive and -immunonegative stripe pairs represent functional units in the pigeon vestibulocerebellum. Journal of Neuroscience. 2012;32:12769–12779. doi: 10.1523/JNEUROSCI.0197-12.2012. [DOI] [PMC free article] [PubMed] [Google Scholar]
  16. Heffley W, Song EY, Xu Z, Taylor BN, Hughes MA, McKinney A, Joshua M, Hull C. Coordinated cerebellar climbing fiber activity signals learned sensorimotor predictions. Nature Neuroscience. 2018;21:1431–1441. doi: 10.1038/s41593-018-0228-8. [DOI] [PMC free article] [PubMed] [Google Scholar]
  17. Heffley W, Hull C. Classical conditioning drives learned reward prediction signals in climbing fibers across the lateral cerebellum. eLife. 2019;8:e46764. doi: 10.7554/eLife.46764. [DOI] [PMC free article] [PubMed] [Google Scholar]
  18. Hesslow G. Inhibition of inferior olivary transmission by mesencephalic stimulation in the cat. Neuroscience Letters. 1986;63:76–80. doi: 10.1016/0304-3940(86)90016-9. [DOI] [PubMed] [Google Scholar]
  19. Holt GR, Softky WR, Koch C, Douglas RJ. Comparison of discharge variability in vitro and in vivo in cat visual cortex neurons. Journal of Neurophysiology. 1996;75:1806–1814. doi: 10.1152/jn.1996.75.5.1806. [DOI] [PubMed] [Google Scholar]
  20. Horn KM, Pong M, Gibson AR. Functional relations of cerebellar modules of the cat. Journal of Neuroscience. 2010;30:9411–9423. doi: 10.1523/JNEUROSCI.0440-10.2010. [DOI] [PMC free article] [PubMed] [Google Scholar]
  21. Ikai Y, Takada M, Shinonaga Y, Mizuno N. Dopaminergic and non-dopaminergic neurons in the ventral tegmental area of the rat project, Respectively, to the cerebellar cortex and deep cerebellar nuclei. Neuroscience. 1992;51:719–728. doi: 10.1016/0306-4522(92)90310-X. [DOI] [PubMed] [Google Scholar]
  22. Isomura Y, Harukuni R, Takekawa T, Aizawa H, Fukai T. Microcircuitry coordination of cortical motor information in self-initiation of voluntary movements. Nature Neuroscience. 2009;12:1586–1593. doi: 10.1038/nn.2431. [DOI] [PubMed] [Google Scholar]
  23. Isomura Y, Takekawa T, Harukuni R, Handa T, Aizawa H, Takada M, Fukai T. Reward-modulated motor information in identified striatum neurons. Journal of Neuroscience. 2013;33:10209–10220. doi: 10.1523/JNEUROSCI.0381-13.2013. [DOI] [PMC free article] [PubMed] [Google Scholar]
  24. Ju C, Bosman LWJ, Hoogland TM, Velauthapillai A, Murugesan P, Warnaar P, van Genderen RM, Negrello M, De Zeeuw CI. Neurons of the inferior olive respond to broad classes of sensory input while subject to homeostatic control. The Journal of Physiology. 2019;597:2483–2514. doi: 10.1113/JP277413. [DOI] [PMC free article] [PubMed] [Google Scholar]
  25. Jun JJ, Steinmetz NA, Siegle JH, Denman DJ, Bauza M, Barbarits B, Lee AK, Anastassiou CA, Andrei A, Aydın Ç, Barbic M, Blanche TJ, Bonin V, Couto J, Dutta B, Gratiy SL, Gutnisky DA, Häusser M, Karsh B, Ledochowitsch P, Lopez CM, Mitelut C, Musa S, Okun M, Pachitariu M, Putzeys J, Rich PD, Rossant C, Sun WL, Svoboda K, Carandini M, Harris KD, Koch C, O'Keefe J, Harris TD. Fully integrated silicon probes for high-density recording of neural activity. Nature. 2017;551:232–236. doi: 10.1038/nature24636. [DOI] [PMC free article] [PubMed] [Google Scholar]
  26. Kitamura K, Häusser M. Dendritic calcium signaling triggered by spontaneous and sensory-evoked climbing fiber input to cerebellar purkinje cells in vivo. Journal of Neuroscience. 2011;31:10847–10858. doi: 10.1523/JNEUROSCI.2525-10.2011. [DOI] [PMC free article] [PubMed] [Google Scholar]
  27. Kostadinov D, Beau M, Pozo MB, Häusser M. Predictive and reactive reward signals conveyed by climbing fiber inputs to cerebellar purkinje cells. Nature Neuroscience. 2019;22:950–962. doi: 10.1038/s41593-019-0381-8. [DOI] [PMC free article] [PubMed] [Google Scholar]
  28. Kubo R, Aiba A, Hashimoto K. The anatomical pathway from the mesodiencephalic junction to the inferior olive relays perioral sensory signals to the cerebellum in the mouse. The Journal of Physiology. 2018;596:3775–3791. doi: 10.1113/JP275836. [DOI] [PMC free article] [PubMed] [Google Scholar]
  29. Llinás RR. Cerebellar motor learning versus cerebellar motor timing: the climbing fibre story. The Journal of Physiology. 2011;589:3423–3432. doi: 10.1113/jphysiol.2011.207464. [DOI] [PMC free article] [PubMed] [Google Scholar]
  30. Locke TM, Soden ME, Miller SM, Hunker A, Knakal C, Licholai JA, Dhillon KS, Keene CD, Zweifel LS, Carlson ES. Dopamine D1 Receptor-Positive neurons in the lateral nucleus of the cerebellum contribute to cognitive behavior. Biological Psychiatry. 2018;84:401–412. doi: 10.1016/j.biopsych.2018.01.019. [DOI] [PMC free article] [PubMed] [Google Scholar]
  31. Marek S, Siegel JS, Gordon EM, Raut R, Gratton C, Newbold DJ, Ortega M, Laumann TO, Adeyemo B, Miller DB, Zheng A, Lopez KC, Berg JJ, Coalson RS, Nguyen AL, Dierker D, Van A N HCR, McDermott KB, Norris SA, Shimony JS, Snyder AZ, Nelson SM, Barch DM, Schlaggar BL, Raichle ME, Petersen SE, Greene DJ, Dosenbach NUF. Spatial and temporal organization of the individual human cerebellum. Neuron. 2018;993:e977. doi: 10.1016/j.neuron.2018.10.010. [DOI] [PMC free article] [PubMed] [Google Scholar]
  32. Molinari HH, Schultze KE, Strominger NL. Gracile, cuneate, and spinal trigeminal projections to inferior olive in rat and monkey. The Journal of Comparative Neurology. 1996;375:467–480. doi: 10.1002/(SICI)1096-9861(19961118)375:3&#x0003c;467::AID-CNE9&#x0003e;3.0.CO;2-0. [DOI] [PubMed] [Google Scholar]
  33. Mukamel EA, Nimmerjahn A, Schnitzer MJ. Automated analysis of cellular signals from large-scale calcium imaging data. Neuron. 2009;63:747–760. doi: 10.1016/j.neuron.2009.08.009. [DOI] [PMC free article] [PubMed] [Google Scholar]
  34. Najafi F, Giovannucci A, Wang SS-H, Medina JF. Sensory-Driven enhancement of calcium signals in individual purkinje cell dendrites of awake mice. Cell Reports. 2014;6:792–798. doi: 10.1016/j.celrep.2014.02.001. [DOI] [PMC free article] [PubMed] [Google Scholar]
  35. Nguyen-Minh VT, Tran-Anh K, Luo Y, Sugihara I. Electrophysiological excitability and parallel fiber synaptic properties of Zebrin-Positive and -Negative purkinje cells in Lobule VIII of the mouse cerebellar slice. Frontiers in Cellular Neuroscience. 2018;12:513. doi: 10.3389/fncel.2018.00513. [DOI] [PMC free article] [PubMed] [Google Scholar]
  36. Ohmae S, Kunimatsu J, Tanaka M. Cerebellar roles in Self-Timing for sub- and Supra-Second intervals. The Journal of Neuroscience. 2017;37:3511–3522. doi: 10.1523/JNEUROSCI.2221-16.2017. [DOI] [PMC free article] [PubMed] [Google Scholar]
  37. Oscarsson O. Functional units of the cerebellum - sagittal zones and microzones. Trends in Neurosciences. 1979;2:143–145. doi: 10.1016/0166-2236(79)90057-2. [DOI] [Google Scholar]
  38. Ozden I, Dombeck DA, Hoogland TM, Tank DW, Wang SS. Widespread state-dependent shifts in cerebellar activity in locomoting mice. PLOS ONE. 2012;7:e42650. doi: 10.1371/journal.pone.0042650. [DOI] [PMC free article] [PubMed] [Google Scholar]
  39. Pachitariu M, Stringer C, Dipoppa M, Schröder S RLF, Dalgleish H, Carandini M, Harris KD. Suite2p: beyond 10,000 neurons with standard two-photon microscopy. bioRxiv. 2017 doi: 10.1101/061507. [DOI]
  40. Paukert M, Huang YH, Tanaka K, Rothstein JD, Bergles DE. Zones of enhanced glutamate release from climbing fibers in the mammalian cerebellum. Journal of Neuroscience. 2010;30:7290–7299. doi: 10.1523/JNEUROSCI.5118-09.2010. [DOI] [PMC free article] [PubMed] [Google Scholar]
  41. Person AL, Raman IM. Purkinje neuron synchrony elicits time-locked spiking in the cerebellar nuclei. Nature. 2012;481:502–505. doi: 10.1038/nature10732. [DOI] [PMC free article] [PubMed] [Google Scholar]
  42. Pologruto TA, Sabatini BL, Svoboda K. ScanImage: flexible software for operating laser scanning microscopes. Biomedical Engineering Online. 2003;2:13. doi: 10.1186/1475-925X-2-13. [DOI] [PMC free article] [PubMed] [Google Scholar]
  43. Rousseeuw PJ. Silhouettes: a graphical aid to the interpretation and validation of cluster analysis. Journal of Computational and Applied Mathematics. 1987;20:53–65. doi: 10.1016/0377-0427(87)90125-7. [DOI] [Google Scholar]
  44. Stuesse SL, Newman DB. Projections from the medial agranular cortex to brain stem visuomotor centers in rats. Experimental Brain Research. 1990;80:532–544. doi: 10.1007/BF00227994. [DOI] [PubMed] [Google Scholar]
  45. Sugihara I, Marshall SP, Lang EJ. Relationship of complex spike synchrony bands and climbing fiber projection determined by reference to aldolase C compartments in crus IIa of the rat cerebellar cortex. The Journal of Comparative Neurology. 2007;501:13–29. doi: 10.1002/cne.21223. [DOI] [PubMed] [Google Scholar]
  46. Sugihara I. Compartmentalization of the deep cerebellar nuclei based on afferent projections and aldolase C expression. The Cerebellum. 2011;10:449–463. doi: 10.1007/s12311-010-0226-1. [DOI] [PubMed] [Google Scholar]
  47. Sugihara I, Quy PN. Identification of aldolase C compartments in the mouse cerebellar cortex by olivocerebellar labeling. The Journal of Comparative Neurology. 2007;500:1076–1092. doi: 10.1002/cne.21219. [DOI] [PubMed] [Google Scholar]
  48. Sugihara I, Shinoda Y. Molecular, topographic, and functional organization of the cerebellar cortex: a study with combined aldolase C and olivocerebellar labeling. Journal of Neuroscience. 2004;24:8771–8785. doi: 10.1523/JNEUROSCI.1961-04.2004. [DOI] [PMC free article] [PubMed] [Google Scholar]
  49. Swenson RS, Castro AJ. The afferent connections of the inferior olivary complex in rats. An anterograde study using autoradiographic and axonal degeneration techniques. Neuroscience. 1983;8:259–275. doi: 10.1016/0306-4522(83)90064-7. [DOI] [PubMed] [Google Scholar]
  50. Tang T, Xiao J, Suh CY, Burroughs A, Cerminara NL, Jia L, Marshall SP, Wise AK, Apps R, Sugihara I, Lang EJ. Heterogeneity of purkinje cell simple spike-complex spike interactions: zebrin- and non-zebrin-related variations. The Journal of Physiology. 2017;595:5341–5357. doi: 10.1113/JP274252. [DOI] [PMC free article] [PubMed] [Google Scholar]
  51. Tang T, Blenkinsop TA, Lang EJ. Complex spike synchrony dependent modulation of rat deep cerebellar nuclear activity. eLife. 2019;8:e40101. doi: 10.7554/eLife.40101. [DOI] [PMC free article] [PubMed] [Google Scholar]
  52. Tsutsumi S, Yamazaki M, Miyazaki T, Watanabe M, Sakimura K, Kano M, Kitamura K. Structure-function relationships between aldolase C/zebrin II expression and complex spike synchrony in the cerebellum. The Journal of Neuroscience. 2015;35:843–852. doi: 10.1523/JNEUROSCI.2170-14.2015. [DOI] [PMC free article] [PubMed] [Google Scholar]
  53. Tsutsumi S. Imaging_Lick. 4bde2b6GitHub. 2019 https://github.com/stsutsumi223/Aldoc-behavior
  54. Veazey RB, Severin CM. Afferent projections to the deep mesencephalic nucleus in the rat. The Journal of Comparative Neurology. 1982;204:134–150. doi: 10.1002/cne.902040204. [DOI] [PubMed] [Google Scholar]
  55. Voogd J, Glickstein M. The anatomy of the cerebellum. Trends in Neurosciences. 1998;21:370–375. doi: 10.1016/S0166-2236(98)01318-6. [DOI] [PubMed] [Google Scholar]
  56. Voogd J, Ruigrok TJ. The organization of the corticonuclear and olivocerebellar climbing fiber projections to the rat cerebellar vermis: the congruence of projection zones and the zebrin pattern. Journal of Neurocytology. 2004;33:5–21. doi: 10.1023/B:NEUR.0000029645.72074.2b. [DOI] [PubMed] [Google Scholar]
  57. Welsh JP, Lang EJ, Suglhara I, Llinás R. Dynamic organization of motor control within the olivocerebellar system. Nature. 1995;374:453–457. doi: 10.1038/374453a0. [DOI] [PubMed] [Google Scholar]
  58. Welsh JP. Functional significance of climbing-fiber synchrony: a population coding and behavioral analysis. Annals of the New York Academy of Sciences. 2002;978:188–204. doi: 10.1111/j.1749-6632.2002.tb07567.x. [DOI] [PubMed] [Google Scholar]
  59. Zhou H, Lin Z, Voges K, Ju C, Gao Z, Bosman LW, Ruigrok TJ, Hoebeek FE, De Zeeuw CI, Schonewille M. Cerebellar modules operate at different frequencies. eLife. 2014;3:e02536. doi: 10.7554/eLife.02536. [DOI] [PMC free article] [PubMed] [Google Scholar]

Decision letter

Editor: Megan R Carey1

In the interests of transparency, eLife includes the editorial decision letter and accompanying author responses. A lightly edited version of the letter sent to the authors after peer review is shown, indicating the most substantive concerns; minor comments are not usually included.

Thank you for submitting your article "Modular organization of cerebellar climbing fiber inputs during goal-directed behavior" for consideration by eLife. Your article has been reviewed by Ronald Calabrese as the Senior Editor, a Reviewing Editor, and three reviewers. The reviewers have opted to remain anonymous.

The reviewers have discussed the reviews with one another and the Reviewing Editor has drafted this decision to help you prepare a revised submission.

Summary:

The reviewers agreed that the questions being addressed were interesting and the study has potential to be suitable for publication in eLife. However, there was concern that while the data are potentially very rich, the analysis and the spin chosen are rather weak. Although no additional experiments would be required, a substantial reanalysis of the data set is necessary, with proper statistics and data reporting with less pooling (allowing the reader to assess the variability of the responses by themselves).

In the consultation process there was general agreement about the strengths and weaknesses of the study. In particular, the following points were emphasized by all reviewers:

- All reviewers agreed that it would be interesting to know if there are sharp functional boundaries at zebrin transitions, but the manuscript in its current form does not achieve this, since the authors classified ROI's according to the zebrin stripe from the beginning based on the overall synchrony calculated from a whole imaging session. Specifically, all three Reviewers agreed that it would be important to establish the categories of dendritic responses independently from the zebrin and then show the correspondence between the two, i.e., analyze response type independent of anatomy.

- There is concern that the pooling by and across zebrin zone is poorly justified (the implicit logic in the manuscript is that there is synchrony within bands, hence, all Purkinje cells in single bands behave the same.) It seems that all CF-evoked calcium signals were averaged (across cells/animals, and even pooling across zones). This makes it difficult to assess the actual strength of the differences reported. (See reviewer 2's essential revision 3 and reviewer 1's essential revision 2.)

- Essential revisions 3 and 4 of reviewer 3 propose many possible analyses that the authors can try

- Orienting the manuscript toward the demonstration of the diversity of responses along a wide medio-lateral axis would fit well in eLife.

In preparing the revised manuscript, we ask you to please pay particular attention to these points, as well as to the individual comments of the three reviewers, which are appended below.

Reviewer #1:

The authors make use of a zebrin promoter-dependent transgenic mouse line to label microzones, thus allowing in vivo responses to be mapped to molecular markers. This is potentially an important contribution to understanding the functional mapping of cerebellum crus II.

Several concerns make it difficult to evaluate the paper in its current form. First, the mice are not generally available, which may not be in alignment with eLife policies. Second, claims are made for sharp boundaries between different zones, yet statistical analysis is not offered to support such a claim. The observations could also be consistent with gradients of responsiveness that do not correlate with boundaries. Third, other technical and biological claims are not adequately demonstrated by rigorous analysis.

No new experiments would be needed to address any of these comments. However, much more analysis is required.

Essential revisions

1): validation of anatomical locations

1) AldoII/tdTomato mice: Are these mice the same as the ones reported in Tsutsumi et al., 2015? That was four years ago. Are they now deposited at an internationally available resource? After they are deposited, in the Materials and methods section, describe where these mice came from and how others can gain access to them. Note that eLife journal policies state "Data, methods used in the analysis, and materials used to conduct the research must be clearly and precisely documented, and be maximally available to any researcher for purposes of reproducing the results or replicating the procedure." https://reviewer.elifesciences.org/author-guide/journal-policies

2) Locations: Although the emphasis is on the difference between zebrin-positive and zebrin-negative zones, the reward-vs-error signal seems to sort by anatomical position, not zebrin+/-. In this case, the zebrin bands act, in a sense, as a mediolateral coordinate system. What are the stereotactic coordinates of the zones in groups I, II/III, and IV? Is it possible to add such information to Figure 3H? Where is the distinction between medial and lateral Crus II? Please report the location of zebrin-band boundaries relative to visible landmarks. For instance: "The boundary between lateral bands (7+, 6+/-, and 5+/-, or Groups I and IV) and medial bands (5a+/- and 4b-, or Groups II and III) was found XXX +/- XXX μm (average+/-SD) lateral from the most medial visible location of crus II, its junction with STRUCTURENAME." This will maximize the impact of the authors' work, especially with other investigators who do not have the tdTomato line.

3) Figure 2A: Related to the comment above, explain how the diagram in Figure 2A was generated. Is this from a single animal or averaged? How reproducible are the compartments?

4) Figure 2B: It is hard to see expression patterns. Please show red and green images from two-photon microscopy side-by-side along with an overlay image.

5) Group II/III zones contain zebrin-positive and zebrin-negative zones, but this distinction is not made in the analyses for the group II/III zones. This is contrary to the analyses for groups I and IV, where different functions are described for CF in zebrin -positive and zebrin -negative zones. Figure 3—figure supplement 1A: looks like more CF activity following cue onset in the hit trials in the zebrin-positive zones. Given that based on these data, zones in group II/III are pooled, please show quantifications of CF activity following a cue in the zebrin-positive and zebrin-negative zones (not just as synchrony as in Figure 3—figure supplement 1C).

2: analysis of responses and qualitative claims

6) For several zones within a group, the claim is made that at the population level three different responses were found. That is, CF responses in group I zones during hit trials had 3 responses: (1) decrease during the pre-cue period. (2) early increase after the cue. (3) later decrease after the reward. Is anything known about these three different types of responses at the level of individual dendrites? Does one dendrite show all 3 types of responses, or can one distinguish a subset of the population only responsible for one of the responses?

7) Subsection “Difference in CF inputs between AldC+ and AldC− zones£”: "although these task-relevant CF responses were graded within zones, the boundary of the response pattern was largely congruent…": Explain this gradation in more detail. In what way and direction, were they graded? What is the quantitative distinction between a gradient and a sharp step?

8) Claims of segregation by microzone are not adequately supported. Show responses of PC dendrites based on location with 100-micron step. Also, please plot functional parameters for dendrites as a function of mediolateral distance from key microzone boundaries. If there is a microzone effect, it would be apparent as a step at the boundary.

9) Subsection “Mediolateral differences in CF responses”, "synchrony": define this term precisely so that readers do not have to look up another article to find out what was analyzed.

10) Subsection “Function of CF inputs 1 to group II/III zones”: "In summary, the population CF responses in group II/III zones tended to decrease before a cue,.…" (related to Figure 6). This is not apparent in Figure 6B. Also mentioned is a 'tendency' toward an anticipatory decrease (subsection “Function of CF inputs 1 to group II/III zones”). Where is the quantification for that? What is the size of this tendency? An effect size (i.e. difference divided by SD) would be helpful.

11) Figure 6—figure supplement 1, "higher temporal resolution images from these zones revealed rhythmic relationships with individual licks" (also subsection “Function of CF inputs 1 to group II/III zones”): What is the duration of individual licks? Is the temporal resolution of the calcium indicator high enough to capture responses to individual licks? Need to demonstrate.

12) How many imaging sessions were done per mouse? Figure 6—Figure supplement 1B and C: each trace is for 1 session. Are the 12 sessions in B and C the same 12 sessions as in A? Does that mean that each trace is from 1 mouse? Or is this whole figure an example from 1 mouse? Please clarify. If it is from one mouse, can we then also see data from averages of all mice to support this claim?

3: interpretation of results

13) Abstract: "These results indicate that spatially segregated CF inputs represent diverse brain functions, and are indispensable for execution of goal-directed behavior" This seems like an overstatement of the findings. The "diversity" of functions includes reward and motor initiation/termination, which would be "multiple functions." "Indispensable for execution of" clause is overstated and should be reworded to "may contribute to".

14) Introduction, "reward outcomes": Because complex spikes (CSs) could represent both rewards and errors, maybe change this to either "rewards" so it is clear that the CS encodes a positive reward event? Or "positive reward outcomes"

15) Discussion section: Discussion starts confusingly because the terminology changes. Is lateral zebrin+ the same as 7+/6+/5+ and Group I? Is lateral zebrin- the same as 6- and 5- or Group IV? And so on. I think the authors are trying to be clearer, but it is better to either introduce the lateral/medial concept earlier, or use all the terminology here so that readers can be anchored

16) Discussion section are confusing. I assume the inhibitory effect of the cerebellar nuclei on the inferior olive would explain how a decrease in population CF can reflect the ramping up activity in fastigial nuclei. Some mention of simple spike activity occurs in the Discussion section, but it would be helpful to include those earlier in the discussion, and explain the (hypothesized) mechanisms of how CF activity reflects ramping up activity in cerebellar nuclei with all other pathways involved as well.

Reviewer #2:

This study observed optic dendritic Ca2+ signal simultaneously from many Purkinje cells in identified anatomical compartments in crus II in mice during behavior performance of the go/no-go task. A combination of new techniques has been employed in this study. The main finding is that the type of response is well correlated with the anatomical compartment in which the Purkinje cell is located, and that the previous anatomical classification of compartments is well correlated with different type of responses. The results demonstrated functional importance of the anatomical compartmentalization of the cerebellum in animal behavior. The essential finding in results seems to be quite novel. Limitation of this study would be that (1) contents of the manuscript are basically descriptive about the recorded signal, without clear interpretation of mechanisms or consequences and that (2) time resolution of the signal seems poor to provide some time dependent aspects of CF inputs, such as the degree of synchronous firing of complex spikes among Purkinje cells (Sasaki, Bouwer and Llinas, 1989). Nevertheless, this report seems to have certain level of impact to general readers as well as researchers in the cerebellum field. The experiments seem to be performed with expertise. Writing is understandable. However, I have several concerns as follows.

1) The Ca2+ signal recorded in this study is not in parallel with the climbing fiber input (or complex spikes), in time or in intensity. Kitamura and Hausser, (2011), which have been cited in the manuscript, shows that (dendritic) Ca2+ signal decays in a slow time constant of ~1 s. On the other hand, the complex spike has a duration of several tens of ms and can fire repetitively at a frequency of ~10 Hz. Therefore, I think "CF input" in the manuscript should be replaced by "CF-dependent dendritic Ca2+" or something in many places. Also, the response speed (rise time, decay time, etc.) of protein Ca2+ indicator (GCaMP6f) used in experiments should be mentioned.

2) In the Abstract: "Crus II" should be mentioned, since "medial and/or lateral aldolase C-positive and/or -negative modules" cannot be defined unless the lobule is specified.

"…represent diverse brain functions". This study does not support this conclusion, since no "functions" were demonstrated. Instead, this study demonstrated different types of Ca2+ signals in relation to go/no-go tongue behavior.

"…are indispensable for.." This study does not support this conclusion. This phrase should be omitted.

3) Concerns about experiments and analyses:

"ROI" should be clearly defined. It seems that the authors assume that one ROI is equivalent with one Purkinje cell. But, in Figure 3A, the size of single ROIs varies significantly.

Basic information of experiments, for example, the number of ROIs (or Purkinje cells) in each compartment should be provided. For example, in Figure 2A, the recording area covers 4b- and 7+ according to this drawing. But, no data from Purkinje cells in 7+ or in 4b- are provided in the paper. However, the authors’ claims that Purkinje cells in 5+, 6+ and 7+ are similar (group I) and Purkinje cells in 4b-, 5a+ and 5a- are similar (group II/III).

I could not find data that show that Purkinje cells in 5+, 6+ and 7+ (or Purkinje cells in 5- and 6-) show similar response patterns in this paper, although it is claimed.

Is it possible to quantify the Ca2+ response? For example, traces in Figure 2C,D. show signals of various intensity. How these signal correspond to or reflect complex spike firing frequencies?

Reviewer #3:

In this manuscript Shinichiro Tsutsumi and co-authors explore the dynamics of climbing fiber activity in the cerebellar cortex of head-fixed mice performing a simple auditory-cued go/no-go task. The climbing fibers (CF) are recorded by calcium imaging using two-photon microscopy in a perio-oral lobule of the cerebellum, and their functional identity is provided by their relation to the zebrin positive/negative bands of the cerebellar cortex. The main conclusion of the study is that CF innervating Purkinje cells belonging to different bands have different relation to behavior, with somewhat different modulation of their activity in relation to movement, movement omission, movement initiation, reward. Overall the experiments and data curation seem carefully performed but the statistical analysis and presentation of the results is currently unsatisfactory and makes the assessment of the strength of the author's claim difficult. Moreover, the differences seem in many cases more quantitative than qualitative, preventing firm conclusions to be drawn on a differential involvement of the cerebellar regions in behavior.

Essential revisions:

1) The relevance of the task chosen may be questioned; indeed, the inactivation of the cerebellar cortex seems mostly to decrease licking vigor/onset, yielding a moderate increase in correct rejection and decrease in hit rate. There is no real evidence that the animals fail to process the cue or cue-reward association very differently with or without cerebellum; the cerebellum could help thus to have a slightly better time-locking of licking (as already shown in Rahmati et al., 2014) the authors focus here on a signal associated with learning (CF discharge) but it is unclear what the cerebellum needs to learn in this task.

2) The task used by the authors does not include a delay between the cue onset and the availability of the water, making difficult to separate what is sensory representation, reward expectation, motor preparation and motor execution. For example, in many cases, the calcium responses are seen in the absence of lick (CR) (absence of calcium signal in "misses" could be due to lack of attention of the mouse); the 1 second time period before the cue is defined as a period of motor preparation but it could be as well caused by an attentional shift. It seems to me a number of experiments could have been attempted to examine their impact on the CF responses (changes in the protocol such as omission of the reward, delayed reward delivery, presentation of the sound in the absence of the lick port etc.).

3) The differences of activations seem in many cases quantitative more than qualitative. Is it possible (or even likely since microzones could be a few PC wide) that the functional segmentation by zebrin zones is too coarse: indeed inspection of the correlation matrices in Figure 2—figure supplement 1 and Figure 3—figure supplement 1 suggest the existence of sub-compartments in the lobules 5+, 5- and 4- (other zones are not illustrated). I wonder whether a more fruitful analysis would be instead to categorize single CF response using functional criteria (probability of firing correlated to licking vigor, latency, presence of a reward, etc.) and examine the spatial distribution of the cells which, based on the current analysis, should be constrained by the zebrin zonation. Finally, the lobule studied is known to receive sensory inputs from many regions of the oral/peri-oral area in the rat (although the C3/5- zone could be more associated with the forelimb); it may therefore be engaged in other motor responses than licking (e.g. tightening of the mouth in the case of active omission?); therefore interpreting an increased response as encoding motor suppression is questionable.

4) While the number of cells/animals seems appropriate, the statistics are questionable, and the analysis seems sometimes incomplete. First, many cases show highly significant p-values, but tiny effect sizes (<10% of the SD, see for example Figure 4—figure supplement 1H,I); it seems no repeated measure ANOVA was used throughout the paper. This has to be corrected and the effects should be tested by nesting the random effects of cells within mice. The ANOVA with Gaussian model is probably not adequate for testing proportions (which are bounded between 0 and 1). In many cases the Ns are not indicated (e.g. when splitting trials for presence/absence of early response). Second, the choice of data illustrated or analyzed may be aggregating multiple factors. To provide a few examples, the lick rate is sometimes presented just for cases with licks (Hit+FA) or for all cases (including trials without licks, which make little sense); in the latter case, the quantification of Miss would be more appropriate to illustrate the difference in behavior (e.g. Panels 4C and 4E, could be instead 4E + Miss rate histogram). Also, DF/F aggregates the CF response probability and the fluorescence amplitude of CF discharge, which may show considerable changes from trial to trial according to Figure 2BE and is not reported nor analyzed. It seems that two types of 'Early' CF response take place: either in the 0-.5 second following cue onset or in the next.5 second (in groups II-III-IV); it would be useful to analyze this phenomenon more in detail: is the absence of 0.5-1s CF response due to a high CF firing probability in the 0-0.5s period and an apparent refractory period of >.5 s? are the late 0.5-1s CF response due to a poor temporal tuning of the CF within single trial? or the ability of the CF to fire twice in that time window in the zones where this occurs? The synchrony in relation to the movement seems not explored (while it could help to enhance the contrast between types of responses).

[Editors' note: further revisions were requested prior to acceptance, as described below.]

Thank you for resubmitting your work entitled "Modular organization of cerebellar climbing fiber inputs during goal-directed behavior" for further consideration at eLife. Your revised article has been favorably evaluated by Ronald Calabrese (Senior Editor), a Reviewing Editor, and three reviewers.

The manuscript has been improved but there are some remaining issues that need to be addressed before acceptance, as outlined below:

There are still concerns about the extent to which the claims of segregation of responses by aldolase C/zebrin expression are supported by the data. However, we appreciate that the demonstration of a wide range of activity patterns that are now well documented by the glm and which are grossly -if not finely- delineated by the zebrin zones. We therefore ask you to revise the manuscript in order to de-emphasize the strong conclusion, that CF responses are strictly segregated by aldolase C banding, and emphasize instead the diversity of responses across regions more broadly. Specific examples of necessary changes are given by reviewers 1 and 3, below.

Reviewer #1:

The authors have addressed a number of concerns. I appreciate the availability of the mice.

However, a central claim, segregation of responses by aldolase C expression, is still not convincing. Therefore, I cannot recommend acceptance of this manuscript.

1) Subsection “AldC expression delineates task-related CF signals”: The choice of a silhouette threshold appears to be arbitrary. It is claimed that "Silhouette value was mostly above 0.7, indicating good separation." But inspection of Figure 2—figure supplement 2 shows that only 5-/5+ shows a clear segregation by correlation. The other boundaries are blurred.

Therefore their conclusion in subsection “AldC expression delineates task-related CF signals” is not suitable: "showing that unbiased clustering of ROIs based on their responses largely corresponds to separation using AldC expression, thus further verifying our approach to separately analyze function per each AldC compartment."

2) Figure 2—figure supplement 1: Similarly, quite often the probability in CF response varies within a microzone. 5a-5a+ doesn't show a difference in probability between the neighboring 100 microns of each zone, either for Hits, False Alarm, or Correct Rejection. Also, probabilities between individual imaging sessions (gray lines) are variable. So, their conclusion that "Significant differences in response probability were noted across all the AldC boundaries for either or all of hit, FA, and CR trials (Figure 2—figure supplement 1),.… " (subsection “AldC expression delineates task-related CF signals”) seems too far-fetched at the least. What does it say if all 4 zones of 100 μm differ from each other? The effect does not seem to always be AldC-dependent.

Reviewer #2:

This study observed optic dendritic Ca2+ signal simultaneously from many Purkinje cells in identified anatomical compartments in crus II in mice during behaviour performance of the go/no-go task. A combination of new techniques has been employed in this study. The main finding is that the type of response is well correlated with the anatomical compartment in which the Purkinje cell is located, and that the previous anatomical classification of compartments is well correlated with different type of responses. The results demonstrated functional importance of the anatomical compartmentalization of the cerebellum in animal behaviour. The essential finding in results seems to be quite novel. Limitation of this study is that (1) contents of the manuscript are basically descriptive about the recorded signal, without clear interpretation of mechanisms or consequences of findings (different types of CS signals in different compartments) and that (2) time resolution of the signal seems poor to provide some time dependent aspects of CF inputs. Nevertheless, this report seems to have certain level of impact to general readers as well as researchers in the cerebellum field. The experiments seem to be performed with expertise. Writing is understandable.

All concerns that I indicated in the previous version seem to be solved appropriately. The limitation of this study that I indicated in the previous manuscript still stays in the revised version of the manuscript. However, the authors are more conscious about the limitation of the study, and have corrected the manuscript accordingly. They omitted some conclusions that were not fully supported by the results in Abstract.

As a whole, the manuscript seems easier to understand and I do not have other comments. The authors also seem to have responded to comments of other reviewers, which other reviewers can judge better.

Reviewer #3:

This manuscript has been much improved and I feel the authors have satisfactorily addressed many of the concerns raised previously. I still have a few comments:

1) Match of boundaries of functional and anatomical zones: the phrasing in the text seems stronger than the figures. Microzones within zones seem to be visible in the data either using clustering (Figure 2—figure supplement 2) or distance (Figure 2—figure supplement 1). Notably, a number of clusters of dendrite are crossing the zebrin borders (Figure 2—figure supplement 2 panels 5a+/4b-, 6+/5-, 6-/6+). The quantitative arguments (Figure 2—figure supplement 4C) provides enough argument to group responses using anatomical boundaries in the rest of the paper, but I feel the presentation of the results should acknowledge more clearly that the zebrin zonation is far from covering all the functional segmentation.

2) The manuscript is much improved by the addition of all the data, but the message may become harder to grasp for the reader; a synthetic scheme might help to gather the main information currently distributed in many schemes and increase the impact of the manuscript.

[Editors' note: further revisions were requested prior to acceptance, as described below.]

Thank you for resubmitting your work entitled "Modular organization of cerebellar climbing fiber inputs during goal-directed behavior" for further consideration at eLife. Your revised article has been favorably evaluated by Ronald Calabrese (Senior Editor), a Reviewing Editor, and one reviewer.

The manuscript has been improved but there are some remaining issues that need to be addressed before acceptance, as outlined below:

In the previous decision letter, we had asked you to "revise the manuscript in order to de-emphasize the strong conclusion, that CF responses are strictly segregated by aldolase C banding, and emphasize instead the diversity of responses across regions more broadly." While the specific examples given by the reviewers have been attended to in the current revision, several problematic statements still remain, and the abstract in particular gives a misleading impression as to what is actually shown.

We ask you to please, read through the entire paper to make sure the concerns about the imperfect correspondence between functional and anatomical boundaries have been addressed. At a minimum, please address the following specific points:

1) The Abstract still overemphasizes the aspects of the study relating to the correspondence of the functional and anatomical boundaries. The abstract needs to be revised in accordance with the previous decision letter, and for clarity. We suggest the following changes:

- In the third sentence, please return to the original phrasing, so that the sentence ends with "to investigate the functional differences in CF inputs to modules." (at a minimum, remove "across aldolase C-positive and -negative")

- Please edit these sentences for clarity and readability: "Anticipatory decreases and early increases in CF signals in the medial modules represent quick motor initiation, and early and secondary increases in these modules represent fast motor behavior. Early increases in CF signals also discriminated go/no-go cues oppositely in the medial aldolase C-positive and lateral aldolase C-negative modules. Positive reward outcomes were indicated by decreases in CF signals in the lateral modules. " Perhaps it would be helpful to focus on stating each spatial region and describing the signals found there (as was the style of the original abstract). Please also tone down the conclusions regarding aldolase C patterning, as requested. It may be helpful use language such as, "broadly corresponding to molecular patterning" or similar, as used in previous reviews.

- Please revise the last sentence of the Abstract to reduce the emphasis on molecular segregation, either by removing "molecularly" or at least to moving it after "spatially" and qualifying it based on the concerns about the hard borders that have already been raised.

2) Additional problematic statements need to be addressed:

- Subsection “AldC expression delineates task-related CF signals”: 'indicating that the AldC expression boundaries delineate CF functions at microzone level to some extent.'

This is untrue as noted by the other reviewers as well. Maybe it would be more appropriate to say that AldC expression boundaries have a close (<100µm?) spatial correspondence with the CF functional boundaries?

- Subsection “AldC expression delineates task-related CF signals”: 'in many cases': this is again rather fuzzy. According to Figure 2—figure supplement 2, the coincidence of boundaries seemed to fit approximately at the cellular level (which is the nature of zebrin limits) for the 7+/6-, 5-/5+, 5a-/5a+ boundaries; the other boundaries seem far less perfect.

- Furthermore, in the Discussion section "spatial organization of CF signals was delineated at AldC expression boundary at both microzone level (Figure 2—figure supplement 1) and single cell level (Figure 2—figure supplement 2, Figure 2—figure supplement 3 and Figure 2—figure supplement 4)." Same comment as above; this is not supported by the figures. A statement cannot be sometimes true and sometimes wrong.

3) Figure 8: shouldn't "intermediate" (which is more spatial than temporal) become 'late'? It is unclear how the arrows to 5-/6- and 6+ are related to the text underneath.

eLife. 2019 Oct 9;8:e47021. doi: 10.7554/eLife.47021.038

Author response


Summary:

The reviewers agreed that the questions being addressed were interesting and the study has potential to be suitable for publication in eLife. However, there was concern that while the data are potentially very rich, the analysis and the spin chosen are rather weak. Although no additional experiments would be required, a substantial reanalysis of the data set is necessary, with proper statistics and data reporting with less pooling (allowing the reader to assess the variability of the responses by themselves).

We appreciate very much for reviewers’ positive evaluation and constructive comments on our manuscript. We carefully reanalyzed the data as shown below to fully address the concerns.

In the consultation process there was general agreement about the strengths and weaknesses of the study. In particular, the following points were emphasized by all reviewers:

- All reviewers agreed that it would be interesting to know if there are sharp functional boundaries at zebrin transitions, but the manuscript in its current form does not achieve this, since the authors classified ROI's according to the zebrin stripe from the beginning based on the overall synchrony calculated from a whole imaging session. Specifically, all three Reviewers agreed that it would be important to establish the categories of dendritic responses independently from the zebrin and then show the correspondence between the two, i.e., analyze response type independent of anatomy.

We addressed this point by adding the following two analyses:

1) Task-related climbing fiber (CF) response probability binned each 100 μm from Aldolase C (AldC) expression boundaries as suggested by reviewer #1, essential revision 2, point 8 (Figure 2—figure supplement 1; Results section).

2) Principal component analysis on the whole calcium trace followed by k-means clustering, irrespective of AldC expression (Figure 2—figure supplement 2, Figure 2—figure supplement 3 and Figure 2—figure supplement 4; Results section).

The results of these analyses clearly indicate that boundaries of functional clusters identified by dendritic responses correspond to anatomical boundaries determined by AldC expression.

- There is concern that the pooling by and across zebrin zone is poorly justified (the implicit logic in the MS is that there is synchrony within bands, hence, all Purkinje cells in single bands behave the same.) It seems that all CF-evoked calcium signals were averaged (across cells/animals, and even pooling across zones). This makes it difficult to assess the actual strength of the differences reported. (See reviewer 2's essential revision 3 and reviewer 1's essential revision 2.)

We justified pooling response by AldC compartment by high coincidence rate (>80%) between clusters identified by PCA and AldC expression (Figure 2 —figure supplement 2 and Figure 2 —figure supplement 4B and 4C), and by looking at single region of interest (ROI) response averaged across trials, rather than looking at ROI-averaged trace per single trial (Figure 2D, thin lines in Figure 2E, Figure 3B, and Figure 3—figure supplement 1B). Task-related CF signals were similar across ROIs within single AldC compartment.

Then we pooled response within compartment and sorted task-related responses in single compartments from lateral to medial (Figure 3—figure supplement 1C). Overall, the same AldC compartments shared task-related CF signals.

On the basis of these analyses, we have regrouped the compartments according to response properties and mediolateral axis (lateral AldC+; 7+ and 6+, lateral AldC–; 6– and 5–, medial AldC+; 5+ and 5a+, medial AldC–; 5a– and 4b–, Figure 3E) rather than the grouping based on the climbing fiber innervation pattern (Group I – IV).

Further analyses for behavioral correspondence of CF signals were performed on individual compartments without pooling across compartments (Figure 4, Figure 5, Figure 6 and Figure 7).

- Essential revisions 3 and 4 of reviewer 3 propose many possible analyses that the authors can try.

We have addressed these points as answers to reviewer #3.

- Orienting the manuscript toward the demonstration of the diversity of responses along a wide medio-lateral axis would fit well in eLife.

We have emphasized this point by scrutinizing task-related CF signals in each compartment along entire mediolateral axis (Figure 3—figure supplement 1C) and their behavioral relevance by using generalized linear model with mixed effects per compartment (Figure 4, Figure 5, Figure 6 and Figure 7).

Reviewer #1:

Several concerns make it difficult to evaluate the paper in its current form. First, the mice are not generally available, which may not be in alignment with eLife policies. Second, claims are made for sharp boundaries between different zones, yet statistical analysis is not offered to support such a claim. The observations could also be consistent with gradients of responsiveness that do not correlate with boundaries. Third, other technical and biological claims are not adequately demonstrated by rigorous analysis.

In order to fully address the reviewer’s points, we have added substantial amount of analyses and improved the manuscript to explain them in detail.

1) The mice used have been available upon request since we published 2015 paper (Tsutsumi et al., 2015). However, according to this reviewer’s suggestion, we will deposit the mice at RIKEN Bio Resource Center when the paper is published.

2) Following the reviewer’s advice, we added analyses on task-related CF response probability binned each 100 μm from Aldolase C (AldC) expression boundaries (Figure 2—figure supplement 1), and showed that functional boundaries correspond to AldC expression boundaries. To look at these relationships at single cell level, we added principal component analysis (PCA) on the whole calcium trace followed by k-means clustering, irrespective of AldC expression (Figure 2—figure supplement 2–4), and showed that unbiased functional classification of CF signals mostly correspond to separation using AldC expression.

3) We have reanalyzed spatiotemporal pattern of CF responses at single dendrites and single compartments to avoid excessive pooling of the data. In particular, we added analyses using generalized linear model with mixed effects (GLMM) per compartment to closely look at behavioral relevance of single compartments controlled for across mice variations, rather than on pooled data.

We have performed proper statistics and the results are provided as Supplementary file 1.

No new experiments would be needed to address any of these comments. However, much more analysis is required.

We appreciate the reviewer’s constructive comment. We substantially added analyses to address all the points raised below.

Essential revisions

1: validation of anatomical locations

1) AldoII/tdTomato mice: Are these mice the same as the ones reported in Tsutsumi et al., 2015? That was four years ago. Are they now deposited at an internationally available resource? After they are deposited, in the Materials and methods section describe where these mice came from and how others can gain access to them. Note that eLife journal policies state "Data, methods used in the analysis, and materials used to conduct the research must be clearly and precisely documented, and be maximally available to any researcher for purposes of reproducing the results or replicating the procedure." https://reviewer.elifesciences.org/author-guide/journal-policies

The Aldoc-tdTomato mouse line have already been made available upon request since Tsutsumi et al., (2015) was published. However, following the reviewer’s advice, we are now preparing to deposit these mice at RIKEN Bio Resource Center and they would be available after this work will be published. We have added this information in Materials and methods section.

2) Locations: Although the emphasis is on the difference between zebrin-positive and zebrin-negative zones, the reward-vs-error signal seems to sort by anatomical position, not zebrin+/-. In this case, the zebrin bands act, in a sense, as a mediolateral coordinate system. What are the stereotactic coordinates of the zones in groups I, II/III, and IV? Is it possible to add such information to Figure 3H? Where is the distinction between medial and lateral Crus II? Please report the location of zebrin-band boundaries relative to visible landmarks. For instance: "The boundary between lateral bands (7+, 6+/-, and 5+/-, or Groups I and IV) and medial bands (5a+/- and 4b-, or Groups II and III) was found XXX +/- XXX μm (average+/-SD) lateral from the most medial visible location of crus II, its junction with STRUCTURENAME." This will maximize the impact of the authors' work, especially with other investigators who do not have the tdTomato line.

We manually mapped the relative location of these AldC bands on the basis of tdTomato fluorescence on two-photon imaging. Relative and absolute coordinates of all the AldC boundaries were measured with reference to the 6+/5− boundary located at center of the cranial window (2 mm lateral from the midline and 4 mm caudal from lambda) and we have added these values in Materials and methods section. We have also added a scale bar to the diagram in new Figure 3E on the basis of these measurements.

3) Figure 2A: Related to the comment above, explain how the diagram in Figure 2A was generated. Is this from a single animal or averaged? How reproducible are the compartments?

As above, the diagrams in Figure 2A and new Figure 3E were manually made on the basis of tdTomato fluorescence on two-photon imaging from a single animal. This information is now added to Materials and methods section. We have previously shown that the boundaries of tdTomato expression in these mice are exactly the same as those of AldC expression by using immunohistochemistry (Tsutsumi et al., 2015) (Results section), and the expression pattern of AldC in inbred mice should be the same.

4) Figure 2B: It is hard to see expression patterns. Please show red and green images from two-photon microscopy side-by-side along with an overlay image.

We thank the reviewer for this suggestion. In the new version of Figure 2B, we separately showed red channel (tdTomato), green channel (GCaMP6f), and ROI selection.

5) Group II/III zones contain zebrin-positive and zebrin-negative zones, but this distinction is not made in the analyses for the group II/III zones. This is contrary to the analyses for groups I and IV, where different functions are described for CF in zebrin -positive and zebrin -negative zones. Figure 3—figure supplement 1A: looks like more CF activity following cue onset in the hit trials in the zebrin-positive zones. Given that based on these data, zones in group II/III are pooled, please show quantifications of CF activity following a cue in the zebrin-positive and zebrin-negative zones (not just as synchrony as in Figure 3—figure supplement 1C).

Instead of pooling the data by grouping based on CF innervation pattern, we now showed task-related CF signals in each compartment sorted from lateral to medial (Figure 3—figure supplement 1C), and found some difference between AldC+ and AldC− compartments even in the medial Crus II, as the reviewer pointed out. Then we compared the responses in the lateral vs. medial Crus II separately for AldC+ and AldC− compartments (Figure 3C–D).

2: analysis of responses and qualitative claims

6) For several zones within a group, the claim is made that at the population level three different responses were found. That is, CF responses in group I zones during hit trials had 3 responses: (1) decrease during the pre-cue period. (2) early increase after the cue. (3) later decrease after the reward. Is anything known about these three different types of responses at the level of individual dendrites? Does one dendrite show all 3 types of responses, or can one distinguish a subset of the population only responsible for one of the responses?

We thank the reviewer for raising this important issue. We analyzed single ROI, single trial traces (Figure 4—figure supplement 2) to address this point. Decreases in CF signals at pre-cue period (−1 to 0 s from cue onset), increases in CF signals at early (0 to 0.5 s from cue onset) and intermediate (0.5 to 1 s from cue onset) response window could be induced simultaneously even in single dendrites and single trial level (Figure 4—figure supplement 2A; Results section). Decreases in CF signals at late response window (1.2 to 2.2 s from lick onset; Figure 4—figure supplement 2B; Result section) were also observed in single dendrites.

7) Subsection “Difference in CF inputs between AldC+ and AldC− zones£”: "although these task-relevant CF responses were graded within zones, the boundary of the response pattern was largely congruent…": Explain this gradation in more detail. In what way and direction, were they graded? What is the quantitative distinction between a gradient and a sharp step?

We added analyses on task-related CF response probability binned each 100 μm from Aldolase C (AldC) expression boundaries (Figure 2—figure supplement 1) to address this point. We showed both sharp steps at the AldC expression boundaries (such as 5−/5+, hit trials) and gradients even within compartment (such as 6+/5−, hit trials).

8) Claims of segregation by microzone are not adequately supported. Show responses of PC dendrites based on location with 100-micron step. Also, please plot functional parameters for dendrites as a function of mediolateral distance from key microzone boundaries. If there is a microzone effect, it would be apparent as a step at the boundary.

According to this suggestion, as above, we added analyses on task-related CF response probability binned each 100 μm from aldolase C (AldC) expression boundaries (Figure 2—figure supplement 1) and found that task-related CF signals are delineated at AldC expression boundaries at microzone level.

9) Subsection “Mediolateral differences in CF responses”, "synchrony": define this term precisely so that readers do not have to look up another article to find out what was analyzed.

We refrain from using the term “synchrony” in the revised manuscript, because our imaging frame rate was only 7.8 frames/s, thus it is not adequate to discuss synchrony.

10) Subsection “Function of CF inputs 1 to group II/III zones”: "In summary, the population CF responses in group II/III zones tended to decrease before a cue,.…" (related to Figure 6). This is not apparent in Figure 6B. Also mentioned is a 'tendency' toward an anticipatory decrease (subsection “Function of CF inputs 1 to group II/III zones”). Where is the quantification for that? What is the size of this tendency? An effect size (i.e. difference divided by SD) would be helpful.

We now have these statistics per compartment (Figure 4—figure supplement 1 and Figure 4—figure supplement 3) and their effect sizes (Supplementary file 1). For example, pre-cue decreases in CF signals were only observed in a 5+ compartment (effect size = 0.18; Supplementary file 1; Results section). We now refrain from using the term “tended” in the revised manuscript.

11) Figure 6—figure supplement 1, "higher temporal resolution images from these zones revealed rhythmic relationships with individual licks" (also subsection “Function of CF inputs 1 to group II/III zones”): What is the duration of individual licks? Is the temporal resolution of the calcium indicator high enough to capture responses to individual licks? Need to demonstrate.

12) How many imaging sessions were done per mouse? Figure 6—figure supplement 1B and C: each trace is for 1 session. Are the 12 sessions in B and C the same 12 sessions as in A? Does that mean that each trace is from 1 mouse? Or is this whole figure an example from 1 mouse? Please clarify. If it is from one mouse, can we then also see data from averages of all mice to support this claim?

Regarding both point 11) and 12), we removed the previous Figure 6—figure supplement 1 because it was only from one mouse, and therefore, it is difficult to claim this point.

3: interpretation of results

13) Abstract: "These results indicate that spatially segregated CF inputs represent diverse brain functions, and are indispensable for execution of goal-directed behavior" This seems like an overstatement of the findings. The "diversity" of functions includes reward and motor initiation/termination, which would be "multiple functions." "Indispensable for execution of" clause is overstated and should be reworded to "may contribute to".

We agree that we overstated here, so now it is rephrased as “indicate that… play distinct roles for” (Abstract).

14) Introduction, "reward outcomes": Because complex spikes (CSs) could represent both rewards and errors, maybe change this to either "rewards" so it is clear that the CS encodes a positive reward event? Or "positive reward outcomes"

Thank you for pointing this out. It is rephrased as “positive reward outcomes” throughout the manuscript.

15) Discussion section: Discussion starts confusingly because the terminology changes. Is lateral zebrin+ the same as 7+/6+/5+ and Group I? Is lateral zebrin- the same as 6- and 5- or Group IV? And so on. I think the authors are trying to be clearer, but it is better to either introduce the lateral/medial concept earlier, or use all the terminology here so that readers can be anchored

We now listed up all the relevant AldC compartments for each grouping. Also we ceased to use the previous grouping as Group I–IV, and instead use simple grouping based on functional property and mediolateral location of each compartment: lateral AldC+, 7+ and 6+; lateral AldC−, 6− and 5−; medial AldC+, 5+ and 5a+; medial AldC−, 5a− and 4b− compartments (Figure 3C–E and Figure 3—figure supplement 2; Results section).

16) Discussion section are confusing. I assume the inhibitory effect of the cerebellar nuclei on the inferior olive would explain how a decrease in population CF can reflect the ramping up activity in fastigial nuclei. Some mention of simple spike activity occurs in the Discussion section, but it would be helpful to include those earlier in the discussion, and explain the (hypothesized) mechanisms of how CF activity reflects ramping up activity in cerebellar nuclei with all other pathways involved as well.

We are sorry for causing the confusions. It is still controversial how ramping up activity in cerebellar nuclei (both fastigial and dentate) is generated. According to this reviewer’s suggestion, we have removed discussion about simple spikes and only discuss the relationship between nuclear ramping up activity and decreases in CF signals (Discussion section).

Reviewer #2:

This study observed optic dendritic Ca2+ signal simultaneously from many Purkinje cells in identified anatomical compartments in crus II in mice during behavior performance of the go/no-go task. A combination of new techniques has been employed in this study. […] The experiments seem to be performed with expertise. Writing is understandable. However, I have several concerns as follows.

We appreciate the reviewer’s evaluation of our work.

As for the limitations:

(1) We have added generalized linear model with mixed effects (GLMM) fitting trial-by-trial ΔF/F in each compartment to single trial behavior to address behavioral relevance of these climbing fiber (CF) signals.

(2) We agree that the temporal resolution of our experiments was too poor to address CF synchrony, thus the argument about synchrony is omitted from the revised manuscript.

1) The Ca2+ signal recorded in this study is not in parallel with the climbing fiber input (or complex spikes), in time or in intensity. Kitamura and Hausser, (2011), which have been cited in the manuscript, shows that (dendritic) Ca2+ signal decays in a slow time constant of ~1 s. On the other hand, the complex spike has a duration of several tens of ms and can fire repetitively at a frequency of ~10 Hz. Therefore, I think "CF input" in the manuscript should be replaced by "CF-dependent dendritic Ca2+" or something in many places. Also, the response speed (rise time, decay time, etc.) of protein Ca2+ indicator (GCaMP6f) used in experiments should be mentioned.

We agree that “CF input” is overstated for our study, because the temporal resolution of our imaging (7.8 frames/s) is not enough to quantify actual complex spikes, as the reviewer pointed out. We now rephrased it as “CF-dependent dendritic Ca2+ signals” or simply “CF signals” (Results section) throughout the manuscript. As for response speed of GCaMP6f, we cited Gaffield et al., (2016), where they showed that the rise and decay time constant are ~33 ms and ~100 ms, respectively, for CF-dependent Ca2+ signals in Purkinje cell dendrites. We have stated this in Materials and methods section.

2) In the Abstract: "Crus II" should be mentioned, since "medial and/or lateral aldolase C-positive and/or -negative modules" cannot be defined unless the lobule is specified.

Thank you for pointing this out. We have added “Crus II” in the Abstract.

"…represent diverse brain functions". This study does not support this conclusion, since no "functions" were demonstrated. Instead, this study demonstrated different types of Ca2+ signals in relation to go/no-go tongue behavior.

"…are indispensable for.." This study does not support this conclusion. This phrase should be omitted.

Regarding these points, we agree that we overstated here. We now describe the results as “indicate that […] play distinct roles for execution of goal-directed behavior” (Abstract).

3) Concerns about experiments and analyses:

"ROI" should be clearly defined. It seems that the authors assume that one ROI is equivalent with one Purkinje cell. But, in Figure 3A, the size of single ROIs varies significantly.

We are sorry for the confusions. As in the Materials and methods section, we inspected the results of automatic ROI extraction and semi-automatically corrected by the criteria described (Materials and methods section). In brief, closely located fractured ROIs which showed highly correlated activity (r > 0.75) were regarded as dendrites of the same cell. Furthermore, there is a manual inclusion criterion for the shape of regions of interest (ROIs), where round or vessel-shaped ROIs were omitted (Materials and methods section). In a new Figure 2B, we separately showed selected ROIs to make this point clearer.

Basic information of experiments, for example, the number of ROIs (or Purkinje cells) in each compartment should be provided. For example, in Figure 2A, the recording area covers 4b- and 7+ according to this drawing. But, no data from Purkinje cells in 7+ or in 4b- are provided in the paper. However, the authors’ claims that Purkinje cells in 5+, 6+ and 7+ are similar (group I) and Purkinje cells in 4b-, 5a+ and 5a- are similar (group II/III).

We added the number of ROIs in each compartment in the main text (n = 472 compartments, 13.7 ± 5.7 ROIs, mean ± s.d.; Results section). We also added at least one representative data from all the aldolase C (AldC) expression boundaries (Figure 2 and Figure 3 and Figure 3—figure supplement 1). Similarity of task-related CF signals across compartments is now shown in Figure 3—figure supplement 1C. On the basis of this result, we determined the functional boundary for lateral and medial Crus II at 5−/5+ boundary (Results section).

I could not find data that show that Purkinje cells in 5+, 6+ and 7+ (or Purkinje cells in 5- and 6-) show similar response patterns in this paper, although it is claimed.

As above, similarity of task-related CF signals across compartments is now shown in Figure 3—figure supplement 1C. AldC compartments in the same division (lateral vs. medial, and AldC+ vs. AldC−) share task-related CF signals.

Is it possible to quantify the Ca2+ response? For example, traces in Figure 2C,D. show signals of various intensity. How these signals correspond to or reflect complex spike firing frequencies?

We might lack the temporal resolution to quantify single CF input as discussed above, nevertheless we tried to extract CF events by using a published method (Mukamel et al., 2009), where local peaks exceeding mean + 2 s.d. of whole trace were extracted as events. On the basis of this method, we found that baseline event rates (during pre-trial: −2 to −1 s from cue onset) were 0.46 ± 0.02 and 0.43 ± 0.02 events/s for AldC+ and AldC− PCs (n = 1,295 and 1,219 ROIs; Materials and methods section). Given that ΔF/F can represent both probability and amplitude of CF signals (Najafi et al., 2014), the event rate that we measured by simple thresholding could underestimate the actual complex spike rate (~1 spikes/s Zhou et al., 2014). Therefore, we used either binarized response for each region of interest (ROI) for each trial (Figure 2—figure supplement 1), or whole session (Figure 2 and Figure 3 and Figure 3—figure supplement 2), or relative change in ROI-averaged ΔF/F detected within single trials (Figure 4—figure supplement 1 and Figure 4—figure supplement 3).

Reviewer #3:

In this manuscript Shinichiro Tsutsumi and co-authors explore the dynamics of climbing fiber activity in the cerebellar cortex of head-fixed mice performing a simple auditory-cued go/no-go task. […] Moreover, the differences seem in many cases more quantitative than qualitative, preventing firm conclusions to be drawn on a differential involvement of the cerebellar regions in behavior.

We appreciate the reviewer’s evaluation of our work. To address this reviewer’s concerns, we substantially added new analyses and statistics to make our conclusions stronger.

Essential revisions:

1) The relevance of the task chosen may be questioned; indeed, the inactivation of the cerebellar cortex seems mostly to decrease licking vigor/onset, yielding a moderate increase in correct rejection and decrease in hit rate. There is no real evidence that the animals fail to process the cue or cue-reward association very differently with or without cerebellum; the cerebellum could help thus to have a slightly better time-locking of licking (as already shown in Rahmati et al., 2014); the authors focus here on a signal associated with learning (CF discharge) but it is unclear what the cerebellum needs to learn in this task.

We agree that we are not addressing the causal sensory role of the cerebellum in our task. Nevertheless, we still observed difference in CF signals in response to go and no-go cues, and they were opposite for the lateral and medial Crus II (Figure 5B). This result provides insights into spatial organization of sensory-related CF signals (lateral > medial) of the cerebellum.

We also agree that the role of the cerebellum (Crus II) in motor timing has been somehow shown and not novel (Welsh, 2002, and Rahmati et al., 2014, as pointed out). However, the present finding that motor timing is mostly relevant to CF signals in the medial Crus II rather than the lateral Crus II (new Figure 4, Figure 5 and Figure 6) is novel and we believe that our findings provides a new perspective on mediolateral differences in cerebellar function.

We are not claiming CF’s role in learning in the previous and revised manuscript, rather addressing their role in learned motor execution (Welsh et al., 1995, Welsh, 2002, and ten Brinke et al., 2017). Nevertheless, we totally agree that their role in goal-directed learning remains a very important topic and needs to be addressed in future. We added a sentence on this topic with regard to the reward-related CF signals (Discussion section).

2) The task used by the authors does not include a delay between the cue onset and the availability of the water, making difficult to separate what is sensory representation, reward expectation, motor preparation and motor execution. For example, in many cases, the calcium responses are seen in the absence of lick (CR) (absence of calcium signal in "misses" could be due to lack of attention of the mouse); the 1 second time period before the cue is defined as a period of motor preparation but it could be as well caused by an attentional shift. It seems to me a number of experiments could have been attempted to examine their impact on the CF responses (changes in the protocol such as omission of the reward, delayed reward delivery, presentation of the sound in the absence of the lick port etc.).

We agree that a delayed go/no-go task can clearly separate sensory, motor, and reward expectation-related signals. Nevertheless, we tried to separate out sensory and motor aspects of CF signals by building a generalized linear model with mixed effects (GLMM) using both the presence (1) and absence (0) of licking and the presence of go cue (1) and no-go cue (0) in the trial to fit single trial ROI-averaged ΔF/F of each compartment (Figure 5B). We found distinct contributions of sensory and motor variables to CF signals in each Aldolase C (AldC) compartments: lick initiation to 6−, 5+, and 5a− compartments (mostly medial Crus II), and go cues to 5+, 5a+, and 5a− (medial Crus II), and no-go cues to 6− and 5− (lateral AldC−), which suggested their distinct roles in sensory and motor functions (Results section; Discussion section).

As the reviewer pointed out, what we call “motor preparation” could also be explained by attentional shift or timing prediction. Actually, the observed delay in lick initiation after decreases in CF signals in the 5− compartment (Figure 4C–D) could be regarded as low level of attention to the task. We added these different interpretations in Discussion section.

We also agree that we did not address full potential of reward representations in CF signals (such as in Kostadinov et al., 2019). However, we believe that our findings of delayed (> 1 s) decreases in CF signals at the lateral Crus II and their increases in a medial compartment (Figure 4—figure supplement 3), and their significant representations of positive reward outcomes (Figure 7), could add another layer of (or task-specific) spatiotemporal representations of positive reward outcomes in CF signals (Discussion section).

3) The differences of activations seem in many cases quantitative more than qualitative. Is it possible (or even likely since microzones could be a few PC wide) that the functional segmentation by zebrin zones is too coarse: indeed inspection of the correlation matrices in Figure 2—figure supplement 1 and Figure 3—figure supplement 1 suggest the existence of sub-compartments in the lobules 5+, 5- and 4- (other zones are not illustrated). I wonder whether a more fruitful analysis would be instead to categorize single CF response using functional criteria (probability of firing correlated to licking vigor, latency, presence of a reward, etc.) and examine the spatial distribution of the cells which, based on the current analysis, should be constrained by the zebrin zonation. Finally, the lobule studied is known to receive sensory inputs from many regions of the oral/peri-oral area in the rat (although the C3/5- zone could be more associated with the forelimb); it may therefore be engaged in other motor responses than licking (e.g. tightening of the mouth in the case of active omission?); therefore interpreting an increased response as encoding motor suppression is questionable.

To fully address the functional separation irrespective of AldC expression identity, we performed principal component analysis on whole trace followed by k-means clustering to functionally separate CFs for each field of view (Figure 2—figure supplement 2). This analysis indeed revealed sub-compartmental structures: CFs in single fields of view were divided into three or more clusters in some cases, which showed distinct task-related responses (Figure 2—figure supplement 3). Nevertheless, this unbiased functional separation still largely corresponded to the separation using AldC expression boundary (coincidence rate > 80%; Figure 2—figure supplement 4), which validated our approach to group CFs on the basis of AldC compartments. We then performed the analyses regarding various functional aspects of CF signals on single AldC compartment basis instead of excessive grouping (Figure 4, Figure 5, Figure 6 and Figure 7), and showed functional differences between compartments along the entire mediolateral axis in Crus II.

We agree that the Crus II is also responsible for sensory processing and motor control other than licking, and also agree that CF signals during correct rejection trials could also be explained by non-monitored motor actions. We have added this possibility in Discussion section.

4) While the number of cells/animals seems appropriate, the statistics are questionable, and the analysis seems sometimes incomplete. […] The synchrony in relation to the movement seems not explored (while it could help to enhance the contrast between types of responses).

Effect sizes for all the comparisons are now summarized in Supplementary file 1(Materials and methods section). We agree that effect sizes are sometimes very small (< 0.2), in that case we attenuated the claims (Results section). We now use repeated measures ANOVA and GLMM to control for across mice variability in every single statistic in the figures. For data that has bounds such as percentage, response probability, and cluster numbers, we used ANOVA on ranks (Figure 2F, Figure 3C, 3D, Figure 2—figure supplement 1, Figure 2—figure supplement 4, and Figure 3—figure supplement 2). We also provided the number of trials and mice used for each analysis in the figure legends as well as in Supplementary file 1.

Lick rate analyses are now only using licking trials (hit and FA). We agree that ΔF/F can represent both probability and amplitude of CF signals (Najafi et al., 2014). Therefore we used either binarized response for each region of interest (ROI) for each trial (Figure 2—figure supplement 1), or whole session (Figure 2F, Figure 3C, 3D and Figure 3—figure supplement 2), or relative change in ROI-averaged ΔF/F was detected within single trials (Figure 4—figure supplement 1 and Figure 4—figure supplement 3).

We deeply appreciate this reviewer’s comment on the two phases of CF signals within “early” (0 to 1 s from cue onset) response window. Following the reviewer’s advice, we separated this “early” response window into two: 0 to 0.5 s (early) and 0.5 to 1 s (intermediate) from cue onset. We basically found the same results on the narrower early CF signals (0 to 0.5 s from cue onset; Figure 2, Figure 3 and Figure 5) as those of old broader early CF signals (0 to 1 s from cue onset), whereas we found clear differences across the lateral and medial Crus II with regard to the secondary increases in CF signals (0.5 to 1 s from cue onset; Figure 3—figure supplement 2) and their behavioral relevance (Figure 6), which were unclear in the previous version of our manuscript. Single ROI single trial traces (Figure 4—figure supplement 2A) suggest that even a single ROI can sometimes fire twice within 0–1 s time window.

We ceased to pursue synchrony of CF signals because we lack temporal resolution (frame rate of 7.8 frames/s) to support the claims.

[Editors' note: further revisions were requested prior to acceptance, as described below.]

[…] We therefore ask you to revise the manuscript in order to de-emphasize the strong conclusion, that CF responses are strictly segregated by aldolase C banding, and emphasize instead the diversity of responses across regions more broadly. Specific examples of necessary changes are given by reviewers 1 and 3, below.

We would like to thank the editors and reviewers for the second inspection and further comments on our manuscript. We appreciate their positive evaluation for our revised manuscript. We have addressed their additional concerns by correcting the corresponding figures (Figure 2—figure supplement 2A and new Figure 8) and texts.

We very much appreciate the reviewers’ positive evaluation on the changes made on our manuscript. We de-emphasized our results in our revised manuscript with regard to complete separation of CF functions by AldC expression. To further emphasize our main results on the diversity of CF signals, we added a summary figure for the readers to better understand the significance.

Reviewer #1:

The authors have addressed a number of concerns. I appreciate the availability of the mice.

We appreciate the reviewer’s positive comment on the changes in our manuscript.

However, a central claim, segregation of responses by aldolase C expression, is still not convincing. Therefore, I cannot recommend acceptance of this manuscript.

We attenuated the statement that only some of the AldC boundaries delineate CF functions.

1) Subsection “AldC expression delineates task-related CF signals”: The choice of a silhouette threshold appears to be arbitrary. It is claimed that "Silhouette value was mostly above 0.7, indicating good separation." But inspection of Figure 2—figure supplement 2 shows that only 5-/5+ shows a clear segregation by correlation. The other boundaries are blurred.

We changed the expression regarding silhouette values (subsection “AldC expression delineates task-related CF signals”) and omitted the later part of the sentence that was pointed out, to avoid exaggeration of our results.

Therefore their conclusion in subsection “AldC expression delineates task-related CF signals” is not suitable: "showing that unbiased clustering of ROIs based on their responses largely corresponds to separation using AldC expression, thus further verifying our approach to separately analyze function per each AldC compartment."

2) Figure 2—figure supplement 1: Similarly, quite often the probability in CF response varies within a microzone. 5a-5a+ doesn't show a difference in probability between the neighboring 100 microns of each zone, either for Hits, False Alarm, or Correct Rejection. Also, probabilities between individual imaging sessions (gray lines) are variable. So, their conclusion that "Significant differences in response probability were noted across all the AldC boundaries for either or all of hit, FA, and CR trials (Figure 2—figure supplement 1),.… " (subsection “AldC expression delineates task-related CF signals”) seems too far-fetched at the least. What does it say if all 4 zones of 100 μm differ from each other? The effect does not seem to always be AldC-dependent.

We appreciate the reviewer’s careful inspection of our data. We now attenuated the statement that only some of the AldC boundaries delineate microzones (subsection “AldC expression delineates task-related CF signals”).

Reviewer #2:

[…] All concerns that I indicated in the previous version seem to be solved appropriately. The limitation of this study that I indicated in the previous manuscript still stays in the revised version of the manuscript. However, the authors are more conscious about the limitation of the study, and have corrected the manuscript accordingly. They omitted some conclusions that were not fully supported by the results in Abstract.

As a whole, the manuscript seems easier to understand and I do not have other comments. The authors also seem to have responded to comments of other reviewers, which other reviewers can judge better.

We very much appreciate the reviewer’s positive evaluation on our substantial effort to improve our manuscript.

Reviewer #3:

This manuscript has been much improved and I feel the authors have satisfactorily addressed many of the concerns raised previously. I still have a few comments:

1) Match of boundaries of functional and anatomical zones: the phrasing in the text seems stronger than the figures. Microzones within zones seem to be visible in the data either using clustering (Figure 2—figure supplement 2) or distance (Figure 2—figure supplement 1). Notably, a number of clusters of dendrite are crossing the zebrin borders (Figure 2—figure supplement 2 panels 5a+/4b-, 6+/5-, 6-/6+). The quantitative arguments (Figure 2—figure supplement 4C) provides enough argument to group responses using anatomical boundaries in the rest of the paper, but I feel the presentation of the results should acknowledge more clearly that the zebrin zonation is far from covering all the functional segmentation.

We attenuated the statement that only some of the AldC boundaries delineate CF function (subsection “AldC expression delineates task-related CF signals”).

2) The manuscript is much improved by the addition of all the data, but the message may become harder to grasp for the reader; a synthetic scheme might help to gather the main information currently distributed in many schemes and increase the impact of the manuscript.

We appreciate this reviewer’s constructive comment. We added the summary schematic as a main figure (new Figure 8). We hope the addition increases the impact of our manuscript.

[Editors' note: further revisions were requested prior to acceptance, as described below.]

In the previous decision letter, we had asked you to "revise the manuscript in order to de-emphasize the strong conclusion, that CF responses are strictly segregated by aldolase C banding, and emphasize instead the diversity of responses across regions more broadly." While the specific examples given by the reviewers have been attended to in the current revision, several problematic statements still remain, and the abstract in particular gives a misleading impression as to what is actually shown.

We ask you to please, read through the entire paper to make sure the concerns about the imperfect correspondence between functional and anatomical boundaries have been addressed. At a minimum, please address the following specific points:

We would like to thank the editors and reviewers for their comments on our revised manuscript. We apologize for insufficient revisions and problematic statements remaining in the previous version of the. According to their comments, we have corrected the Abstract, the main text, and the figures. We have reduced the strong emphasis on the correspondence between functional clusters and aldolase C expression throughout the manuscript.

1) The Abstract still overemphasizes the aspects of the study relating to the correspondence of the functional and anatomical boundaries. The abstract needs to be revised in accordance with the previous decision letter, and for clarity. We suggest the following changes:

- In the third sentence, please return to the original phrasing, so that the sentence ends with "to investigate the functional differences in CF inputs to modules." (at a minimum, remove "across aldolase C-positive and -negative")

We have changed this sentence as suggested.

- Please edit these sentences for clarity and readability: "Anticipatory decreases and […] in the lateral modules. " Perhaps it would be helpful to focus on stating each spatial region and describing the signals found there (as was the style of the original abstract). Please also tone down the conclusions regarding aldolase C patterning, as requested. It may be helpful use language such as, "broadly corresponding to molecular patterning" or similar, as used in previous reviews.

According to these suggestions, we now describe the patterns of activity and their functions in medial and lateral modules respectively, instead of emphasizing correspondence with aldolase C expression. We also added a sentence as suggested. Abstract: The boundaries of CF functions broadly correspond to those of aldolase C patterning.

- Please revise the last sentence of the Abstract to reduce the emphasis on molecular segregation, either by removing "molecularly" or at least to moving it after "spatially" and qualifying it based on the concerns about the hard borders that have already been raised.

We have removed a word “molecularly” and changed the sentence as follows (Abstract); “These results indicate that spatially segregated CF inputs in different modules play distinct roles for execution of goal-directed behavior.”

2) Additional problematic statements need to be addressed:

- Subsection “AldC expression delineates task-related CF signals”: 'indicating that the AldC expression boundaries delineate CF functions at microzone level to some extent.'

This is untrue as noted by the other reviewers as well. Maybe it would be more appropriate to say that AldC expression boundaries have a close (<100µm?) spatial correspondence with the CF functional boundaries?

We have changed this sentence as suggested (subsection “Correspondence between task-related CF signals and AldC expression”).

The AldC expression boundaries have a close (≦ 100 µm) spatial correspondence with the CF functional boundaries.

- Subsection “AldC expression delineates task-related CF signals”: 'in many cases': this is again rather fuzzy. According to Figure 2—figure supplement 2, the coincidence of boundaries seemed to fit approximately at the cellular level (which is the nature of zebrin limits) for the 7+/6-, 5-/5+, 5a-/5a+ boundaries; the other boundaries seem far less perfect.

We have changed this part as follows (subsection “Correspondence between task-related CF signals and AldC expression”);

Mean coincidence rates across animals were as high as 90% in 7+/6−, 5−/5+, and 5+/5a− boundaries (Figure 2—figure supplement 4C), indicating that unbiased clustering of ROIs based on their responses corresponds to separation using AldC expression at cellular resolution in these boundaries, but more broadly tuned in the other boundaries.

- Furthermore, in the Discussion section "spatial organization of CF signals was delineated at AldC expression boundary at both microzone level (Figure 2—figure supplement 1) and single cell level (Figure 2—figure supplement 2, Figure 2—figure supplement 3 and Figure 2—figure supplement 4)." Same comment as above; this is not supported by the figures. A statement cannot be sometimes true and sometimes wrong.

We have changed this sentence as follows (subsection “AldC modules provide a functional reference for CF inputs”);

Furthermore, spatial organization of CF signals broadly corresponded to AldC expression boundaries at both microzone level (Figure 2—figure supplement 1) and single cell level (Figure 2—figure supplement 2, Figure 2—figure supplement 3 and Figure 2—figure supplement 4).

3) Figure 8: shouldn't "intermediate" (which is more spatial than temporal) become 'late'? It is unclear how the arrows to 5-/6- and 6+ are related to the text underneath.

We are very sorry for the confusion. We used the word “late” for the later time window (1.2 to 2.2 s from lick onset). Therefore, we now use “secondary” for this time window. We have changed Figure 8, and other corresponding figures and texts.

In addition, we have modified several sentences throughout the manuscript to de-emphasize the strong conclusions, corrected several minor errors and added a reference that was recently published (all modifications are in colored and underlined text).

Associated Data

    This section collects any data citations, data availability statements, or supplementary materials included in this article.

    Supplementary Materials

    Figure 1—source data 1. Datasets used to create Figure 1.
    DOI: 10.7554/eLife.47021.007
    Figure 1—figure supplement 1—source data 1. Datasets used to create Figure 1—figure supplement 1.
    DOI: 10.7554/eLife.47021.004
    Figure 1—figure supplement 2—source data 1. Datasets used to create Figure 1—figure supplement 2.
    DOI: 10.7554/eLife.47021.006
    Figure 2—source data 1. Datasets used to create Figure 2.
    DOI: 10.7554/eLife.47021.015
    Figure 2—figure supplement 1—source data 1. Datasets used to create Figure 2—figure supplement 1.
    DOI: 10.7554/eLife.47021.010
    Figure 2—figure supplement 4—source data 1. Datasets used to create Figure 2—figure supplement 4.
    DOI: 10.7554/eLife.47021.014
    Figure 3—source data 1. Datasets used to create Figure 3.
    DOI: 10.7554/eLife.47021.020
    Figure 3—figure supplement 1—source data 1. Datasets used to create Figure 3—figure supplement 1.
    DOI: 10.7554/eLife.47021.018
    Figure 4—source data 1. Datasets used to create Figure 4.
    DOI: 10.7554/eLife.47021.026
    Figure 4—figure supplement 1—source data 1. Datasets used to create Figure 4—figure supplements 1 and 3.
    DOI: 10.7554/eLife.47021.023
    Figure 5—source data 1. Datasets used to create Figure 5.
    DOI: 10.7554/eLife.47021.028
    Figure 6—source data 1. Datasets used to create Figure 6.
    DOI: 10.7554/eLife.47021.030
    Figure 7—source data 1. Datasets used to create Figure 7.
    DOI: 10.7554/eLife.47021.032
    Supplementary file 1. Statistics results.

    Complete statistics results for all the figures.

    elife-47021-supp1.xls (115.5KB, xls)
    DOI: 10.7554/eLife.47021.034
    Transparent reporting form
    DOI: 10.7554/eLife.47021.035

    Data Availability Statement

    Data analysed for all the figures are included in the manuscript and source data files. The Aldoc-tdTomato mouse line is available at RIKEN Bio Resource Center (RBRC10927).


    Articles from eLife are provided here courtesy of eLife Sciences Publications, Ltd

    RESOURCES