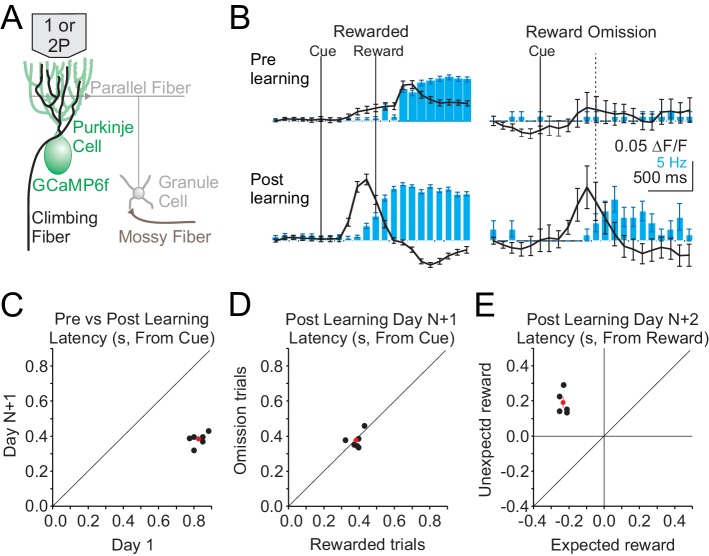
Figure 2. Single photon, mesoscale imaging of Cspk activity during behavior.
(A) Schematic of the cerebellar cortex with GCaMP6f expressed in PCs for single or two photon dendrite imaging. (B) Average ΔF/F timecourse (black, collected at 10 Hz) and lick rate (blue bars) for an example animal before (top) and after (bottom) learning for rewarded (left) and reward omission (right) trials. (C,D,E) Summary of bulk Cspk response latencies relative to the visual cue (C,D) or the reward (E) for all trial types. Response latency is defined by the maximum positive change in ΔF/F rate within 500 ms before the peak response.

