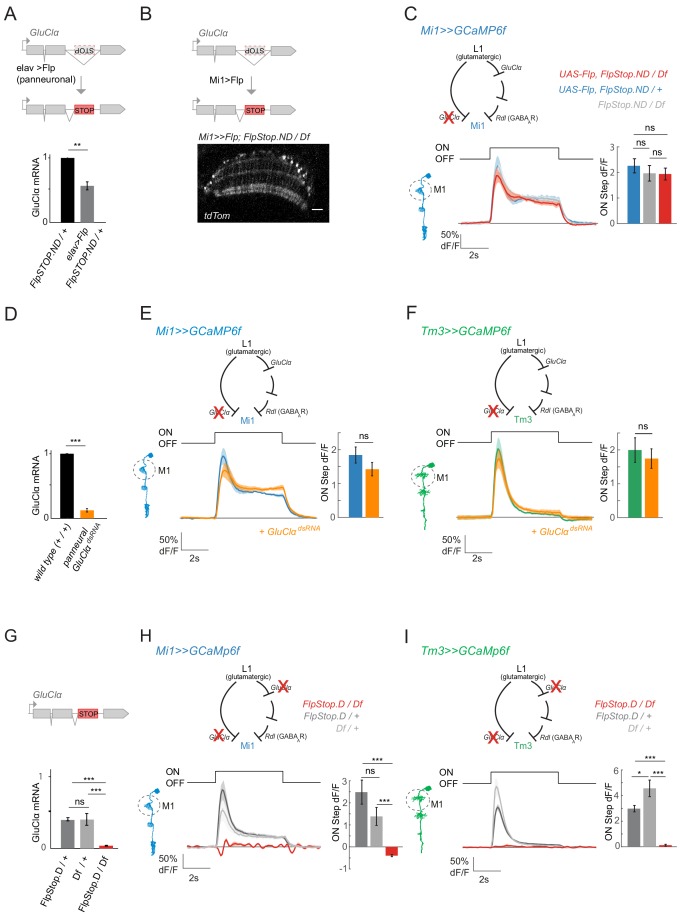
Figure 7. ON selectivity is a multisynaptic computation mediated by GluClα.
(A) Schematic illustrating inversion of the GluClα FlpStop exon in all neurons by panneuronal expression of Flp recombinase using elav-Gal4. qRT-PCR results show GluClα mRNA levels relative to the GAPDH housekeeping gene, normalized to controls. (B) The FlpStop exon in the non-disrupting (ND) orientation was inverted specifically in Mi1 neurons by cell-type-specific expression of Flp recombinase. This is visualized via expression of tdTom signal, and is specific to and broad in Mi1. (C) In vivo calcium signals recorded in a cell-type-specific Mi1 GluClα loss-of-function. Calcium signals were recorded in layer M1 of GluClα mutant Mi1 neurons (n = 5 (136)) (red), and heterozygous controls (n = 5[166], n = 5[139]) (blue, gray). The bar plot shows quantification of the ON step. (D) qRT PCR results quantifying pan neuronal knockdown of UAS-GluClαRNAi using elav-Gal4, normalized to control. (E,F) In vivo calcium signals upon cell-type-specific GluClα knockdown. Calcium signals in response to full-field flashes were recorded in layer M1 of (E) Mi1 control (n = 8[229]) or Mi1 >>GluClαRNAi (n = 6[215]) or of (F) Tm3 control (n = 8[150]) and Tm3 >>GluClαRNAi (n = 6[146]). Bar plot show quantification. (G) qRT PCR results quantifying GluClα mRNA levels in heterozygous GluClαFlp.Stop.D/+ and GluClαDf/+, as well as the homozygous mutant GluClαFlp.Stop.D/Df. (H,I) In vivo calcium signals recorded in a full GluClαFlpStop.D mutant background (red). Heterozygous GluClαFlpStop.D controls are in blue (Mi1, n = 5 (117)) or green (Tm3, n = 8 (275)), heterozygous Df controls are in gray (Mi1, n = 5[142]; Tm3, n = 5[198]) and the experimental condition is in red (Mi1, n = 9 [134]; Tm3, n = 5[96]). Bar plots show quantification of the ON step response. All traces show mean ± SEM. All sample sizes are shown as number of flies (number of cells). Statistics was done using an unpaired Student t test for comparison in (A,D,E,F), and a one-way ANOVA and a post-hoc unpaired t-test with Bonferroni-Holm correction for multiple comparisons in (C,G,H,I). *p<0.05, **p<0.01, ***p<0.001.

