Supplemental Digital Content is available in the text
Keywords: Intertrochanteric fracture, Fracture pattern, Frequency spectra, Computed tomography data, Classification
Abstract
Background:
Available research about the anatomic patterns of intertrochanteric fractures is lacking, and fracture mapping has not previously been performed on intertrochanteric fractures. This study aimed to determine the major trajectories of intertrochanteric fracture lines using computed tomography data from a series of surgically treated patients.
Methods:
In this study, 504 patients with intertrochanteric fractures were retrospectively analyzed. Fracture patterns were graded according to Arbeitsgemeinschaft für Osteosynthesefragen (AO) classification. Fracture lines were transcribed onto proximal femoral templates and graphically superimposed to create a compilation of fracture maps that were subsequently divided into anterior, posterior, lateral, and medial fracture maps to create a three-dimensional (3D) pattern by reducing fragments in the 3D models. The fracture maps were then converted into frequency spectra. The major fracture patterns were assessed by focusing on the lateral femoral wall, lesser trochanter, intertrochanteric crest, and inner cortical buttress.
Results:
Anterior, posterior, lateral, and medial fracture maps were created. The majority of fracture lines (85.9%, 433/504) on the anterior maps were along the intertrochanteric line where the iliofemoral ligament was attached. In the medial plane, the majority of fracture lines (49.0%, 247/504) shown on the frequency spectrum included the turning point involving the third quadrant. In the posterior plane, the majority of fracture lines (52.0%, 262/504) involved the intertrochanteric crest from the greater to the lesser trochanter. In the lateral plane, the majority of fracture lines (62.7%, 316/504) involved the greater trochanter at the gluteus medius attachment.
Conclusions:
The fracture patterns observed in the present study might be used to describe morphologic characteristics and aid with management strategies. Further classifications or modifications that incorporate the fracture patterns identified in this study may be used in future research.
Background
The incidence of intertrochanteric fractures is increasing remarkably due to the increasing elderly population and rapidly developing automobile industry.[1,2] Surgical intervention is the most common treatment for intertrochanteric fractures, and the preferred surgical strategy is appropriate internal fixation and early mobilization.[3] The therapeutic goals are to achieve stable fixation, allow early mobilization, restore the baseline functional mobility and independence, and improve patient's quality of life.[3]
Several classification systems have been used to assess and manage intertrochanteric fractures, including Evans classification,[4] Jensen classification,[5] Boyd-Griffin classification,[6] Kyle classification,[7] and Arbeitsgemeinschaft für Osteosynthesefragen (AO)/Orthopaedic Trauma Association (OTA) classification[8,9]; the AO classification is the most commonly used in clinical practice. These classification systems describe fracture types, stability, and patterns and predict post-operative prognosis. However, with developments and advances in radiography, the above “classic” X-ray-based classifications are now considered insufficient and have limited ability to provide accurate and consistent information about the actual fracture morphology.[10–13] Intertrochanteric fractures are very difficult to precisely diagnose, especially those involving large oblique fragments that include the lesser trochanter.[14]
With advances in radiography, computed tomography (CT) and three-dimensional (3D) CT have been widely used in clinical settings to provide precise evaluation and diagnosis in orthopedics. A method for describing the fracture lines in 3D intertrochanteric fracture patterns is required to explain the morphology and fracture mechanism. A better understanding of the common fracture patterns of intertrochanteric fractures would facilitate surgical strategies, pre-operative planning, and implant strategy design and help clinicians determine optimal approaches, better achieve anatomical fracture reduction, and decrease fixation failures. Furthermore, CT is considered a useful diagnostic modality in the pre-operative planning of managing intertrochanteric fractures. To date, studies have described fracture mapping for scapular fractures,[15] pilon fractures,[16] tibial plateau fractures,[17] and proximal humeral fractures.[18] However, available research about the anatomic patterns of intertrochanteric fractures is lacking, and fracture mapping has not previously been performed on intertrochanteric fractures. Thus, this study aimed to map intertrochanteric fracture lines using CT data.
Methods
Ethical approval
The study was conducted in accordance with the Declaration of Helsinki and was approved by the Ethics Committee of the Ethics Review Board of Chinese PLA General Hospital. Informed written consent was obtained from all patients before their enrollment in this study.
Patients
This study included 504 consecutive intertrochanteric fractures treated surgically at Department of Orthopaedics, Chinese PLA General Hospital between September 2009 and May 2017. The inclusion criteria were as follows: (1) CT data of the proximal femur obtained before surgical intervention; (2) CT images with a thickness <3.0 mm; (3) a minimum of 1 year of radiographic follow-up; (4) age ≥18 years; (5) low-energy mechanism of injury. The exclusion criteria were as follows: (1) patients with pathological fractures; (2) patients with mental disorders; (3) patients walking with assistive devices before the fractures; (4) patients’ fractures with associated neurovascular injuries; (5) patients with previous surgery or osteoarthritis on the affected hip joints.
Proximal femoral templates
Essential Skeleton 4 (3D4 Medical, San Diego, CA, USA) was used to export the typical anterior, posterior, medial, and lateral images of a 3D proximal femur positioned in the anatomic plane. The above two-dimensional (2D) images were imported into Adobe Photoshop CC 2015 (Adobe Systems Software Ireland, Dublin, Ireland) and became the fracture mapping templates.
Fracture models
The original Digital Imaging and Communications in Medicine files of the CT data were collected and imported into Mimics 15.0 (Materialise, Leuven, Belgium). We reconstructed all 3D fragments of every patient. With application of the move and rotate function, each fragment was virtually reduced in the 3D view. Consequently, the fracture lines were clearly observed. These reductive fracture models were then modified to develop 2D images that were presented in the same anatomic plane as the templates. With Mimics and Adobe Photoshop open side by side, the fracture lines were transcribed freehand onto the template layer and graphically superimposed to create a fracture mapping compilation [Figure 1A–C]. Notably, only one researcher performed the transcriptions and the process was re-evaluated by a senior consultant orthopedist. Any disagreement between the two observers was re-evaluated. Each simulative reductive intertrochanteric fracture could be viewed in the 3D images that were freely rotated to create a clearer view of the fracture pattern. The overlapping of all layers resulted in maps with density variations relative to the fracture frequency and fragment zones.
Figure 1.
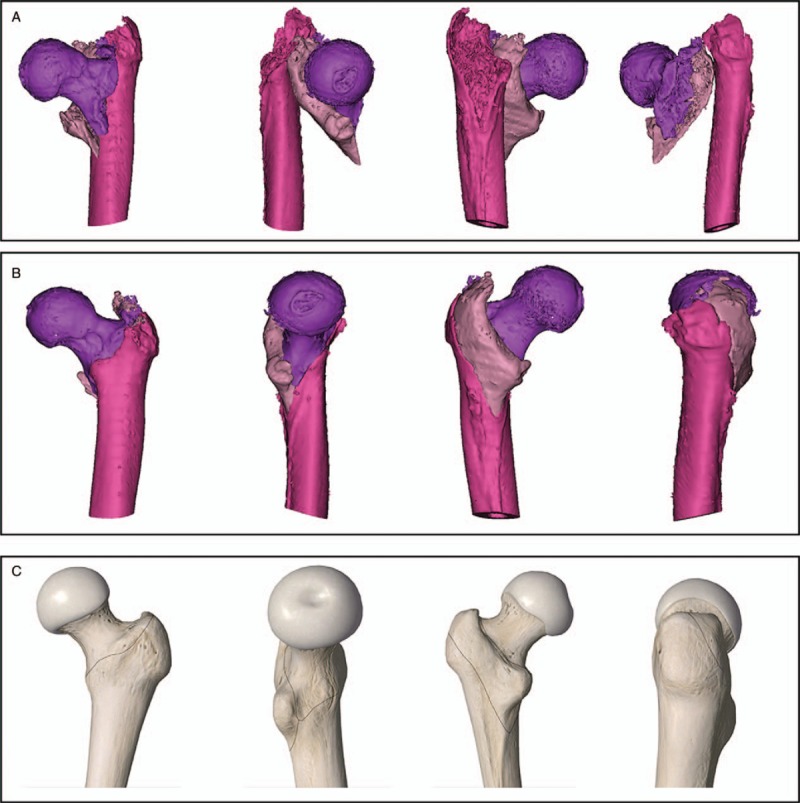
Images illustrating the fracture mapping method. (A) Every fragment was reconstructed in Mimics. (B) Fracture fragments were selected for reduction in the three-dimensional views. (C) Fracture lines were transcribed freehand onto the two-dimensional template in Adobe Photoshop.
Fracture descriptions
The fracture map was subsequently divided into anterior, posterior, lateral, and medial views. To assess the fracture patterns, the anterior fracture template is shown in Figure 2; the medial fracture template was divided into four zones; the posterior fracture template was analyzed according to the fracture fragments and intertrochanteric crest integrality; and the lateral fracture template was divided into four zones. The fracture lines drawn on the template are described according to specific zones.
Figure 2.

Anterior view: the anterior fracture template was analyzed according to trajectory of fracture lines. Medial view: the first line extended from the intersection point of the intertrochanteric line and medial plane to the upper edge of the lesser trochanter. A second vertical line was placed at the midpoint of the first line. The numbers indicate the corresponding quadrants. Posterior view: the posterior fracture template was analyzed according to fracture fragments and integrality of the intertrochanteric crest. Lateral view: the first horizontal line was placed along the vastus lateralis ridge, while the second vertical line equally divided the lateral plane. Thus, four zones were created.
Fracture line frequency spectrum
To further enhance the 2D fracture maps, frequency spectra were created on which the fracture line intensities were graphically represented as colors. All layers on which the fracture lines were drawn were exported from Adobe Photoshop CC 2015 and saved as jpg. files. We programmed a PC using Matlab (MathWorks, Natick, MA, USA) to create a frequency spectrum based on the data density. The programming content is shown in the supplemental data.
Statistical analysis
The analysis was descriptive. Patient characteristics are summarized as mean ± standard deviation (SD) for continuous variables and as frequencies and percentages for categorical variables. The fracture maps illustrated the fracture location, while the frequency spectra illustrated the fracture line majorities and trajectories.
Results
Patient characteristics
The cohort of 504 patients (including 195 men, 309 women; 252 right, and 252 left hip fractures) had a wide range of intertrochanteric fracture types. The mean patient age was 80.2 ± 13.0 years (range: 20.0–103.0 years).
Fracture map using AO classification
As defined by AO/OTA classification, 32.3% (163/504) had A1 fractures, 56.0% (282/504) had A2 fractures, and 11.7% (59/504) had A3 fractures [Figure 3].
Figure 3.
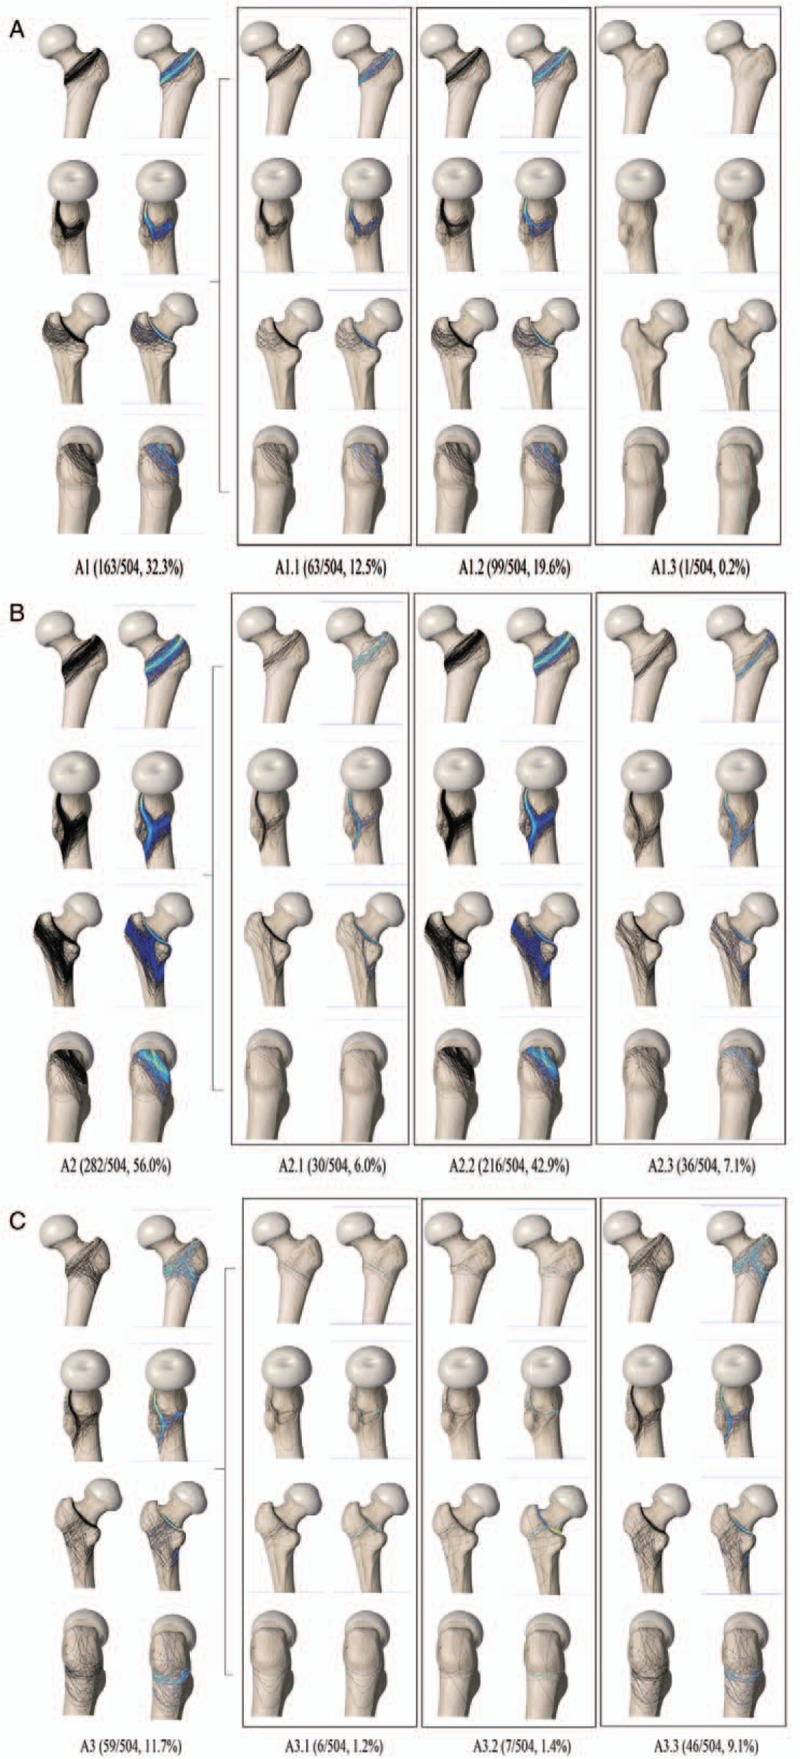
Fracture map using Arbeitsgemeinschaft für Osteosynthesefragen classification. (A) The 31-A1 fracture types (pertrochanteric simple) and frequency spectrum displaying fracture line patterns and distributions. Fracture lines are shown as black lines on the template, while fracture line intensity is illustrated on a frequency spectrum. Fracture counts by type: 31-A1.1 (n = 63), A1.2 (n = 99), A1.3 (n = 1). (B) The 31-A2 fracture types (multi-fragmentary pertrochanteric) and frequency spectrum displaying fracture line patterns and distributions. Fracture lines are shown as black lines on the template, while fracture line intensity is illustrated on a frequency spectrum. Fracture counts by type: 31-A2.1 (n = 30), A2.2 (n = 216), A2.3 (n = 36). (C) The 31-A3 fracture type (intertrochanteric) and frequency spectrum displaying fracture line patterns and distributions. Fracture lines are shown as black lines on the template, while fracture line intensity is illustrated on a frequency spectrum. Fracture counts by type: 31-A3.1 (n = 6), A3.2 (n = 7), A3.3 (n = 46).
Anterior fracture map
The majority of fracture lines were concentrated at the intertrochanteric line where the iliofemoral ligament was attached with a trajectory running from superolateral to inferomedial. The anterior fracture map is shown in Figure 4. Based on the fracture pattern in the anterior plane, the fractures were divided into typical and non-typical fracture lines. Typical fracture lines (433 cases, 85.9%) were those in which a single fracture line ran from superolateral to inferomedial. A non-typical fracture pattern was identified in 71 patients (14.1%): 9 (1.8%) with reversed V fracture lines, 16 (3.2%) with transverse oblique fracture lines, 34 (6.7%) with a combination of pertrochanteric and lateral wall fractures, and 12 (2.4%) with multiple intertrochanteric lines.
Figure 4.
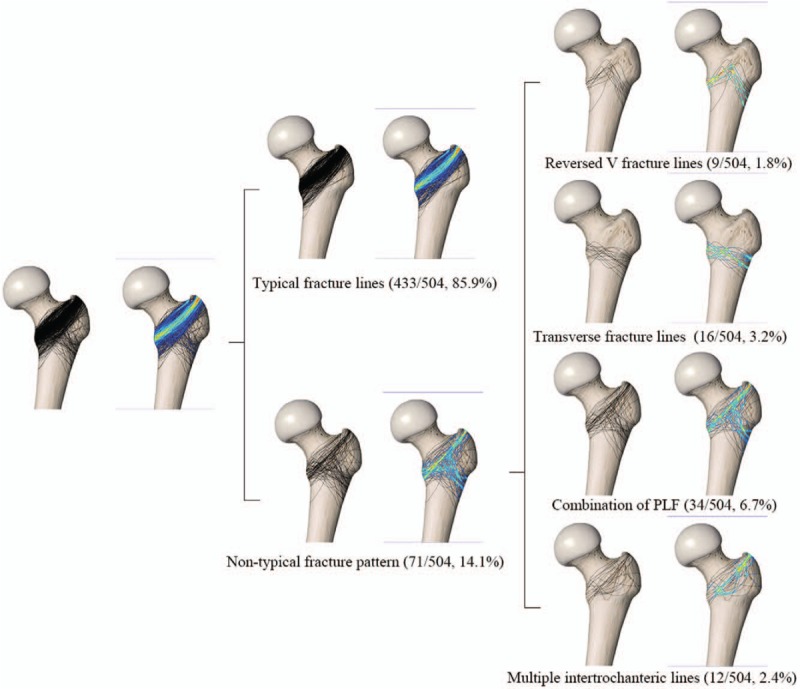
Anterior view of the fracture map and frequency spectrum.
Medial fracture map
A cross was constructed at the medial plane to form four parts. The medial fracture map is shown in Figure 5. The position of the turning points (the intersection between the major line and the line involving the lesser trochanter) of the fracture lines and fracture patterns were assessed. The turning point of the majority of fracture lines was located in the third quadrant, indicating lesser trochanter detachment from the medial cortex. Of the entire cohort, 5.0% (25/504) had a turning point of fracture lines in the second quadrant, 49.0% (247/504) had a turning point in the third quadrant, and 10.3% (52/504) had a turning point in the fourth quadrant. A simple fracture line traversed the first and second quadrants in 14.7% (74/504) and the third and fourth quadrants in 21.0% (106/504).
Figure 5.
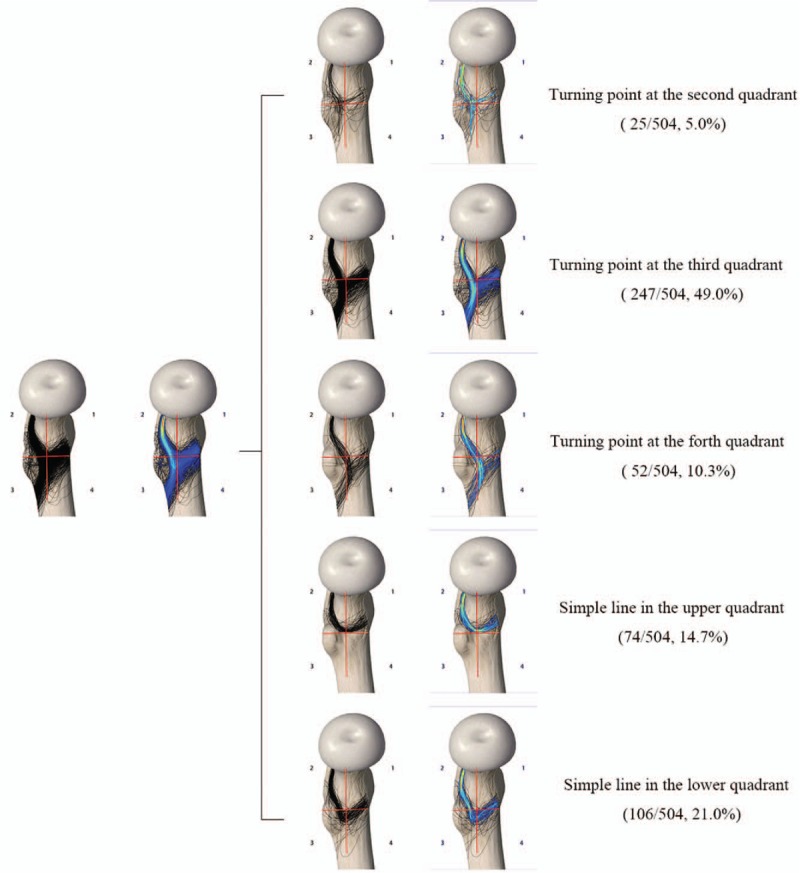
Medial view of the fracture map and frequency spectrum.
Posterior fracture map
The posterior fracture map is shown in Figure 6. The majority of fracture lines involving the intertrochanteric crest were discontinuous or comminuted and extended from the greater to the lesser trochanter. According to fracture pattern, six types were identified: Type I, only the fracture line was seen in the posterior basal part of the femoral neck and the trochanteric crest was intact (66/504, 13.1%); Type II, the proximal part of the crest appeared fragmented but the distal lesser trochanter was intact (95/504, 18.9%); Type III, the distal lesser trochanter was fragmented but the proximal part of the crest was intact (22/504, 4.4%); Type IV, only one fracture fragment was seen in the posterior trochanteric crest that involved the distal lesser trochanter and proximal greater trochanter (89/504, 17.7%); Type V, two or more fracture fragments were seen in the posterior trochanteric crest (173/504, 34.3%); and Type VI, reverse trochanteric fracture (59/504, 11.7%).
Figure 6.
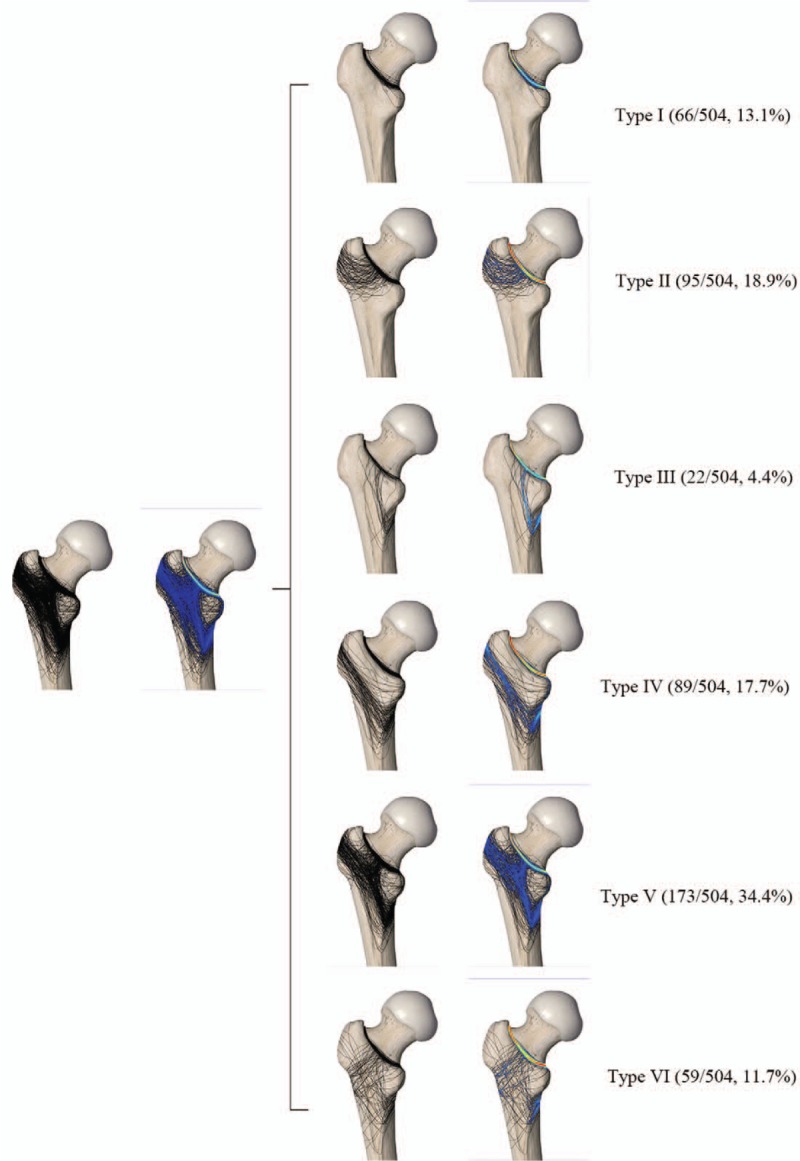
Posterior view of the fracture map and frequency spectrum.
Lateral fracture map
The lateral fracture map is shown in Figure 7. The majority of fracture lines involved the greater trochanter where the gluteus medius attached with a trajectory running from anterosuperior to posteroinferior. According to the lines involving the different zones, all fractures were divided into four groups: Group I (89/504, 17.7%) included those with no fracture line; Group II (316/504, 62.7%) included fractures that traversed the first and second zones; Group III (45/504, 8.9%) included fractures that partially involved the lateral wall; and Group IV (54/504, 10.7%) included fractures that involved the entire lateral wall.
Figure 7.
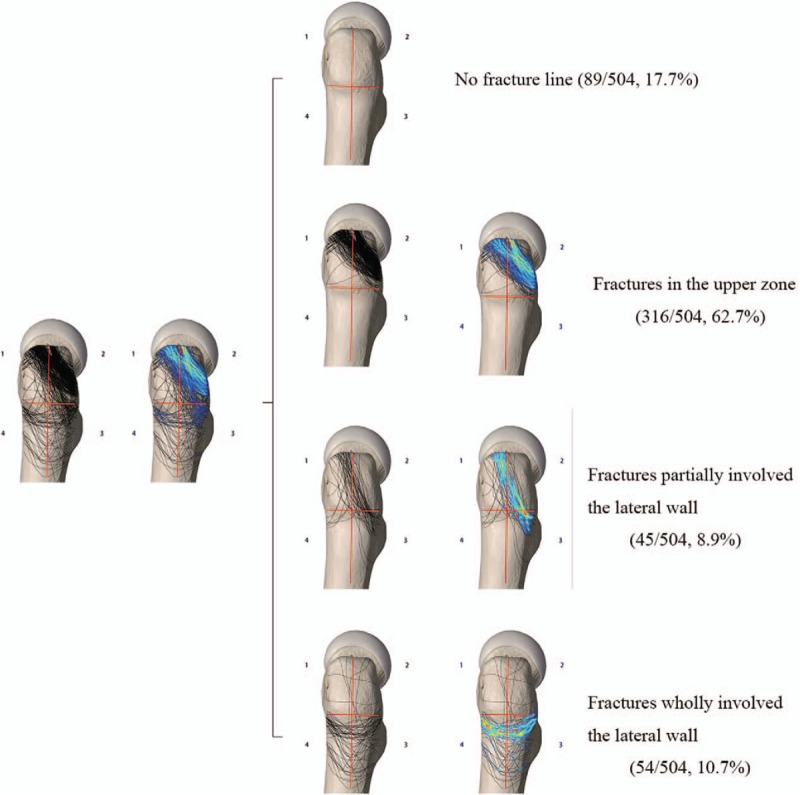
Lateral view of the fracture map and frequency spectrum.
Discussion
In the present study, the fracture mapping related technique described by Armitage et al[15] and Mellema et al[19] was applied to 504 intertrochanteric fractures to make the shape characteristics of this osteoporosis-related fracture easy to understand. A qualitative method of freehand transcription drawn on the four orthogonal direction planes based on the 3D pre-reduction model was proposed and combined with a quantitative method of a frequency spectrum map to provide a comprehensive description of intertrochanteric fracture morphology. This study showed that morphologic characteristics of the fracture lines were diversified, the fracture pathology was complicated, and the fracture pattern variations were far wider than the existing fracture classifications could include.
Several classification systems have been widely used in the clinical setting to assess and manage intertrochanteric fractures, including Evans classification,[4] Jensen classification,[5] Boyd-Griffin classification,[6] Kyle classification,[7] and AO/OTA classification.[8,9] All classifications mentioned above were based on radiographic evaluations. The classification proposed by Evans et al[4] in 1949 was based on the fracture line direction with special emphasis on reduction stability, which divided the fractures into five types. Boyd-Griffin classification[6] divided the fractures into four types based on the relative ease or difficulty of securing and maintaining the reduction because the author thought that this provided valuable information in the therapeutic planning and estimation of post-operative prognosis. In 1980, based on Evans classification, Jensen[5] considered plain lateral X-ray assessments. Involvement of the greater trochanter and calcar femorale was considered in this study, as it contained the most reliable information about the possibility of obtaining stable fracture reduction and most accurately predicted the risk of secondary fracture dislocation. In 1979, Kyle classification[7] was also developed according to Evans classification. And finally, the AO/OTA classification system[8,9] was proposed with emphasis on fracture line pattern stability. However, critical morphologic details such as fracture orientation, medial fragment size, and comminution zones of the intertrochanteric crest cannot accurately be reflected in those classification systems,[13] which may result in difficulties and limitations with surgical planning and implant strategies. The purpose of this study was not to propose a new classification system; however, the trends presented in the fracture maps and the frequency spectra may prove useful in facilitating improved fracture mechanism and surgical understanding of reduction and fixation concepts to better manage intertrochanteric fractures.
Generally speaking, these classification systems have been used in clinical practice for decades and re-considered useful in treatment planning and outcome predictions. Unfortunately, the above mentioned “classic” classifications were developed using X-rays during an era before the advent of CT scans, which was considered inaccurate for the diagnosis of fracture patterns.[10,11] Therefore, classification systems based on CT data are needed to achieve precise diagnoses of intertrochanteric fractures and best evaluate and treat them. Fortunately, in more recent studies, researchers have re-evaluated classifications and introduced some new classifications based on CT data. In 2016, Futamura et al[20] introduced a classification that divided intertrochanteric fractures into three types according to the relationship between attachment of the iliofemoral ligament and course of the fracture line: type I, the lateral wall pattern; type II, the transverse pattern; and type III, the reverse oblique pattern. In 2017, Shoda et al[14] also proposed a CT-based classification by modifying the Nakano classification.[21] In this study, fractures were classified as having two, three, or four parts, using combinations of the head, greater trochanter, lesser trochanter, and shaft. Three-part fractures were classified into five sub-groups according to whether the fracture pattern involved the greater and lesser trochanters.
However, most of those classification systems for intertrochanteric fractures have limited reliability and are inadequate for pre-operative planning because they were proposed according to the author's experience or observations instead of consisting of a series of mapped fractures. Post-operative complications such as delayed removal of the lag screw, union, or even non-union are not rare even in cases of stable intertrochanteric fractures according to the available classifications.[22,23] The new proposed CT-based classifications have not been applied in the clinical setting; thus, clinical practice tests are needed. Whether these classification systems have acceptable reliability remains to be explored. Furthermore, intertrochanteric fractures can be very difficult to diagnose precisely, especially those involving large oblique fragments including the lesser trochanter.[14] Therefore, a better understanding of the features of intertrochanteric fractures is warranted.
Notably, to our knowledge, this is the first study to explore mapping of intertrochanteric fractures. To assess fracture pattern, four fracture views were created [Figures 4–7] to indicate 3D orientation of the fracture lines. Fracture maps in just one plane have been widely used in some previous studies, including scapular fractures,[15] tibial plateau fractures,[24] pilon fractures,[16] coronoid fractures,[19] radial head fractures,[25] and olecranon fractures.[26] The fracture map that includes four orthotropic planes is considered better able to demonstrate the fracture characteristics and provides detailed information about fracture morphology. Moreover, we analyzed the fracture orientation based on the frequency spectrum and divided the fracture map into types according to the involved anatomic landmarks. The anterior fracture map was divided into two types according to the directions of fracture lines; the medial fracture map was analyzed based on the positional relationship between the posteromedial fragment and the major fracture line; the posterior fracture map was analyzed according to the fracture fragments and the integrality of the intertrochanteric crest, and the lateral fracture map was evaluated based on the integrality of the lateral femoral wall.
Our findings showed that the majority of fracture lines shown on the frequency spectrum were along the intertrochanteric line at the attachment point of the iliofemoral ligament. The non-typical fracture lines showed a reverse V pattern, transverse oblique fracture lines, and a combination of pertrochanteric fractures and lateral wall fractures, similar to the classification system proposed by Futamura et al[20] In the medial plane, we focused on the trajectory of the lesser trochanter fracture line and the major fracture line. We assessed the location of the turning point to indicate the fragment sizes of the lesser trochanter and remaining medial cortices of the proximal femur. The majority of fracture lines shown on the frequency spectrum included the turning point involving the third quadrant, indicating that most patients had lesser trochanter detachment but adequate sustainable medial cortices to provide stability, unlike those involving the fourth quadrant. In the posterior fracture map, all intertrochanteric fractures involved the posterior base of the femoral neck. The majority of fracture lines involved the intertrochanteric crest from the greater to the lesser trochanter, indicating fragility of the intertrochanteric crest and the easily affected area of the posteromedial cortices and the intra-medullary nail entry point. In the lateral plane, the fractures partially involved the lateral wall in 8.9% of cases and the entire lateral wall in 10.7% of cases. More precise and accurate information about intertrochanteric fractures was provided, enabling better surgical approaches, pre-operative planning, and implant strategies. The features of the intertrochanteric fracture patterns identified in this study may facilitate communication among surgeons. And the characteristics of fracture line indicated that the size of the intertrochanteric crest detachment affected the fragments of the greater and lesser trochanters. Based on the 3D mapping, structures of fragment size of the intertrochanteric crest, medial cortical support, and lateral femoral wall were mostly involved in the frequency spectra, which were vital factors in the treatment of the intertrochanteric fractures, but did not be considered in the existing classifications. The future classification system would incorporate the fracture patterns identified in this study.
The study limitations included the following. First, we used a subjective simplification of drawn fracture lines when the major fracture fragments and lines were unclear. Second, one might argue that the interpretation of fracture maps was subjective because the methods and results were descriptive in nature. However, our database was relatively larger than that of previous studies.
In conclusion, the fracture patterns observed in the present study might be used to describe fracture morphologic characteristics, understand fracture mechanisms, and aid in management strategies. Further classifications or modifications that incorporate the fracture patterns identified in this study may be useful in future research.
Funding
This work was supported by grants from the Capital Health Research and Development of Special Grants (No. 2016-1-5012) and Medical Big Data Center of PLA General Hospital (No. 2017MBD-014).
Conflicts of interest
None.
Supplementary Material
Footnotes
How to cite this article: Li M, Li ZR, Li JT, Lei MX, Su XY, Wang GQ, Zhang H, Xu GX, Yin P, Zhang LC, Tang PF. Three-dimensional mapping of intertrochanteric fracture lines. Chin Med J 2019;00:00–00. doi: 10.1097/CM9.0000000000000446
Ming Li and Zhi-Rui Li contributed equally to this work.
References
- 1.Tsabasvi M, Davey S, Temu R. Hip fracture pattern at a major Tanzanian referral hospital: focus on fragility hip fractures. Arch Osteoporos 2017; 12:47.doi: 10.1007/s11657-017-0338-z. [DOI] [PubMed] [Google Scholar]
- 2.Dimai HP, Svedbom A, Fahrleitner-Pammer A, Pieber T, Resch H, Zwettler E, et al. Epidemiology of hip fractures in Austria: evidence for a change in the secular trend. Osteoporos Int 2011; 22:685–692.. doi: 10.1007/s00198-010-1271-9. [DOI] [PubMed] [Google Scholar]
- 3.Sheehan S, Shyu F, Weaver M, Sodickson A, Khurana B. Proximal femoral fractures: what the orthopedic surgeon wants to know. Radio Graphics 2015; 35:1563–1584.. doi: 10.1148/rg.2015140301. [DOI] [PubMed] [Google Scholar]
- 4.Evans EM. The treatment of trochanteric fractures of the femur. J Bone Joint Surg Br 1949; 31B:190–203.. doi: 10.1002/bjs.18003614433. [PubMed] [Google Scholar]
- 5.Jensen JS. Classification of trochanteric fractures. Acta Orthop Scand 1980; 51:803–810.. doi: 10.3109/17453678008990877. [DOI] [PubMed] [Google Scholar]
- 6.Boyd HB, Griffin LL. Classification and treatment of trochanteric fractures. Arch Surg 1949; 58:853–866.. doi: 10.1186/1756-0381-7-8. [DOI] [PubMed] [Google Scholar]
- 7.Kyle RF, Gustilo RB, Premer RF. Analysis of six hundred and twenty-two intertrochanteric hip fractures. Journal Bone Joint Surg Am 1979; 61:216–221.. doi: 10.1055/s-2007-959167. [PubMed] [Google Scholar]
- 8.Colton CL. Telling the bones. J Bone Joint Surg Br 1991; 73:362–364.. doi: 10.1302/0301-620X.73B3.1670427. [DOI] [PubMed] [Google Scholar]
- 9.Muller M, Nazarian S, Koch P. The Comprehensive Classification of Fractures of Long Bones. Berlin: Springer; 1990. [Google Scholar]
- 10.Cavaignac E, Lecoq M, Ponsot A, Moine A, Bonnevialle N, Mansat P, et al. CT scan does not improve the reproducibility of trochanteric fracture classification: a prospective observational study of 53 cases. Orthop Traumatol Surg Res 2013; 99:46–51.. doi: 10.1016/j.otsr.2012.09.019. [DOI] [PubMed] [Google Scholar]
- 11.Shen J, Hu F, Zhang L, Tang P, Bi Z. Preoperative classification assessment reliability and influence on the length of intertrochanteric fracture operations. Int Orthop 2013; 37:681–687.. doi: 10.1007/s00264-012-1748-6. [DOI] [PMC free article] [PubMed] [Google Scholar]
- 12.Cho JW, Kent WT, Yoon YC, Kim Y, Kim H, Jha A, et al. Fracture morphology of AO/OTA 31-A trochanteric fractures: a 3D CT study with an emphasis on coronal fragments. Injury 2017; 48:277–284.. doi: 10.1016/j.injury.2016.12.015. [DOI] [PubMed] [Google Scholar]
- 13.Isida R, Bariatinsky V, Kern G, Dereudre G, Demondion X, Chantelot C. Prospective study of the reproducibility of X-rays and CT scans for assessing trochanteric fracture comminution in the elderly: a series of 110 cases. Eur J Orthop Surg Traumatol 2015; 25:1165–1170.. doi: 10.1007/s00590-015-1666-6. [DOI] [PubMed] [Google Scholar]
- 14.Shoda E, Kitada S, Sasaki Y, Hirase H, Niikura T, Lee SY, et al. Proposal of new classification of femoral trochanteric fracture by three-dimensional computed tomography and relationship to usual plain X-ray classification. J Orthop Surg (Hong Kong) 2017; 25:2309499017692700.doi: 10.1177/2309499017692700. [DOI] [PubMed] [Google Scholar]
- 15.Armitage BM, Wijdicks CA, Tarkin IS, Schroder LK, Marek DJ, Zlowodzki M, et al. Mapping of scapular fractures with three-dimensional computed tomography. J Bone Joint Surg Am 2009; 91:2222–2228.. doi: 10.2106/jbjs.h.00881. [DOI] [PubMed] [Google Scholar]
- 16.Cole PA, Mehrle RK, Bhandari M, Zlowodzki M. The pilon map: fracture lines and comminution zones in OTA/AO type 43C3 pilon fractures. J Orthop Trauma 2013; 27:e152–e156.. doi: 10.1097/BOT.0b013e318288a7e9. [DOI] [PubMed] [Google Scholar]
- 17.Molenaars RJ, Mellema JJ, Doornberg JN, Kloen P. Tibial plateau fracture characteristics: computed tomography mapping of lateral, medial, and bicondylar fractures. J Bone Joint Surg Am 2015; 97:1512–1520.. doi: 10.2106/jbjs.n.00866. [DOI] [PubMed] [Google Scholar]
- 18.Hasan AP, Phadnis J, Jaarsma RL, Bain GI. Fracture line morphology of complex proximal humeral fractures. J Shoulder Elbow Surg 2017; 26:e300–e308.. doi: 10.1016/j.jse.2017.05.014. [DOI] [PubMed] [Google Scholar]
- 19.Mellema J, Doornberg J, Dyer G, Ring D. Distribution of coronoid fracture lines by specific patterns of traumatic elbow instability. J Hand Surg Am 2014; 39:2041–2046.. doi: 10.1016/j.jhsa.2014.06.123. [DOI] [PubMed] [Google Scholar]
- 20.Futamura K, Baba T, Homma Y, Mogami A, Kanda A, Obayashi O, et al. New classification focusing on the relationship between the attachment of the iliofemoral ligament and the course of the fracture line for intertrochanteric fractures. Injury 2016; 47:1685–1691.. doi: 10.1016/j.injury.2016.05.015. [DOI] [PubMed] [Google Scholar]
- 21.Nakano T. Proximal femoral fracture. Seikeigeka (Orthopaedics) 2014; 65:842–850.. [Google Scholar]
- 22.Kleweno C, Morgan J, Redshaw J. Short versus long cephalomedullary nails for the treatment of intertrochanteric hip fractures in patients older than 65 years. J Orthop Trauma 2014; 28:391–397.. doi: 10.1097/BOT.0000000000000036. [DOI] [PubMed] [Google Scholar]
- 23.Erez O, Dougherty PJ. Early complications associated with cephalomedullary nail for intertrochanteric hip fractures. J Trauma Acute Care Surg 2012; 72:E101–E105.. doi: 10.1097/ta.0b013e31821c2ef2. [DOI] [PubMed] [Google Scholar]
- 24.Molenaars R, Mellema J, Doornberg J, Kloen P. Tibial plateau fracture characteristics: computed tomography mapping of lateral, medial, and bicondylar fractures. J Bone Joint Surg Am 2015; 97:1512–1520.. doi: 10.2106/JBJS.N.00866. [DOI] [PubMed] [Google Scholar]
- 25.Mellema J, Eygendaal D, van Dijk C, Ring D, Doornberg J. Fracture mapping of displaced partial articular fractures of the radial head. J Shoulder Elbow Surg 2016; 25:1509–1516.. doi: 10.1016/j.jse.2016.01.030. [DOI] [PubMed] [Google Scholar]
- 26.Lubberts B, Mellema J, Janssen S, Ring D. Fracture line distribution of olecranon fractures. Arch Orthop Trauma Surg 2017; 137:37–42.. doi: 10.1007/s00402-016-2593-7. [DOI] [PubMed] [Google Scholar]
Associated Data
This section collects any data citations, data availability statements, or supplementary materials included in this article.


