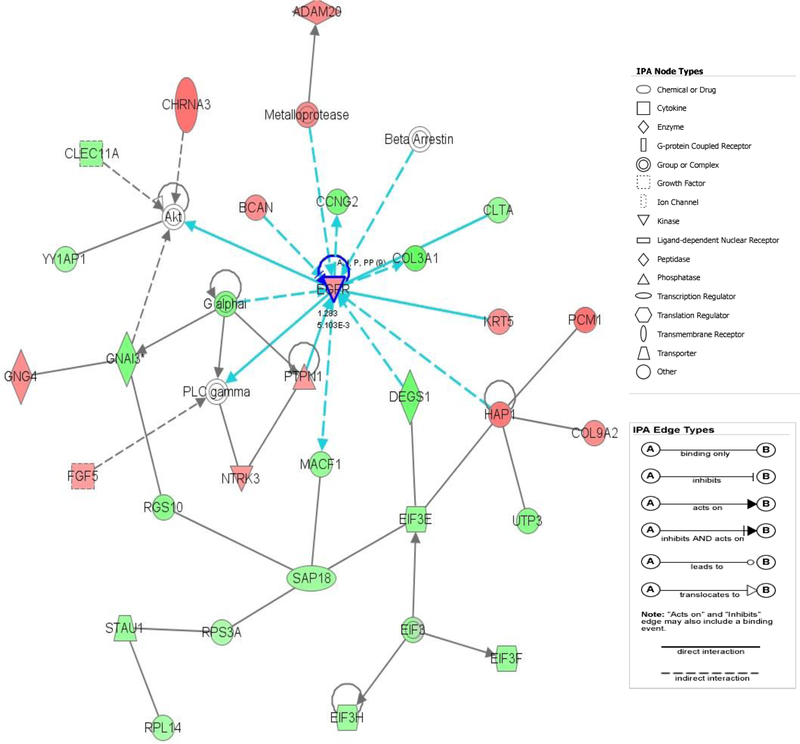
Figure 2:
The top-scoring network of interactions among the 58 probe sets identified as significantly differentially expressed when comparing HCV (+) vs. HCV (–) donors. The probe sets were subsequently analyzed using the Ingenuity pathway analysis software (https://analysis.ingenuity.com). This software is designed to identify dynamically generated biological networks, global canonical pathways and global functions. Interconnection of significant functional networks, where protein nodes in different shades of red and green or white depending on being up-regulated and down-regulated or no-change, respectively, in HCV (+) kidney donor samples. [Blue] For canonical pathways, molecules that are members of the network being examined are outlined in blue.

