

Abstract
Depression has been reliably associated with abnormalities in the neural representation of reward and loss. However, most studies have focused on monetary incentives; fewer studies have considered neural representation of social incentives. A direct comparison of non-social and social incentives within the same study would establish whether responses to the different incentives are differentially affected in depression. The functional magnetic resonance imaging study presented here investigated the neural activity of individuals with subthreshold depression (SD) and healthy controls (HCs) while they participated in an incentive delay task offering two types of reward (monetary gain vs social approval) and loss (monetary loss vs social disapproval). Compared to HCs, individuals with SD showed increased subgenual anterior cingulate cortex (sgACC) activity during anticipation of social loss, whereas the response in the putamen was decreased during consumption of social gain. Individuals with SD also exhibited diminished insula responses in consuming social loss. Furthermore, positive connectivity between the insula and ventral lateral pre-frontal cortex (VLPFC) was observed in individuals with SD while negative connectivity was found in HCs when consuming social loss. These results demonstrate neural alterations in individuals with depression, specific to the processing of social incentives, mainly characterised by dysfunction within the ‘social pain network’ (sgACC, insula and VLPFC).
Keywords: social incentive, depression, anticipation, subgenual cingulate cortex, insula, ventral lateral pre-frontal cortex
Introduction
Depression is characterised by altered processing of reward and loss (Eshel and Roiser, 2010; McCabe et al., 2012). Compared to healthy controls, depressed individuals show a maladaptive response to punishment, i.e. hypersensitivity to punishment or failed use of negative feedback to improve their future performance, combined with hyposensitivity to reward (Eshel and Roiser, 2010). This abnormality to reward and loss has been linked to aberrant function of frontal [dorsolateral and medial pre-frontal cortex (DLPFC, MPFC)] and ventral striatal regions (nucleus accumbens, putamen and caudate; Forbes et al., 2009; Knutson et al., 2008; Pizzagalli et al., 2009). While neural mechanisms of these abnormalities have been extensively explored for incentives such as money and food (Rizvi et al., 2016), another important incentive, i.e. social feedback (e.g. praise or conversely, disapproval), has been largely ignored (Spreckelmeyer et al., 2009). It is increasingly recognized that, compared to non-social feedback, social feedback processing is more likely to be affected by depression (Forbes, 2009; Brinkmann et al., 2014). There is therefore a clear rationale for exploring social feedback processing in depression.
Depressed individuals show blunted response to social rewards, decreased enjoyment and reduced interest in social activity (i.e. social anhedonia; for a review, see Kupferberg et al., 2016), while they are hypersensitive to social losses like social rejection (Hsu et al., 2015). Although impairments of non-social and social processing are consistent in depression at the behavioural level, i.e. hypersensitive to punishment and insensitive to rewarding (Eshel and Roiser, 2010; Kupferberg et al., 2016), previous neuroimaging studies have revealed that the neural manifestation between monetary and social incentives is somewhat different in depression. For instance, it is found that while depressed individuals show decreased striatal response to monetary reward (Forbes et al., 2006), they exhibit increased amygdala response to social reward (social acceptance; Davey et al., 2011). Furthermore, depressed individuals have greater activation for social punishment in brain areas including the ventral lateral pre-frontal cortex (VLPFC), insula and subgenual anterior cingulate cortex (sgACC), all regions of the ‘social pain’ network (Silk et al., 2014; Rudolph et al., 2016; Kumar et al., 2017; Jankowski et al., 2018). In contrast, reduced reactivity across multiple brain regions including pre-frontal regions, parietal cortex, amygdala and putamen have been observed for monetary losses in individuals with depression (Knutson et al., 2008; Schiller et al., 2013).
The processing of reward and loss can be divided into two distinct phases, i.e. consummatory and appetitive phases (Berridge, 1999; Rademacher et al., 2010). The monetary incentive delay (MID) paradigm and its social version, i.e. social incentive delay (SID) paradigm allow for separate investigation of the two phases so to distinguish between appetitive process during anticipation and hedonic process during consumption of reward and loss (Knutson et al., 2000; Spreckelmeyer et al., 2009). Using the MID and similar paradigms, evidence suggests that anhedonia, a core symptom in depression, can be observed in not only the ‘liking’ but also the ‘wanting’ phase (Pizzagalli, 2014; Rizvi et al., 2016). While reduced fronto-striatal activity during monetary reward anticipation has been suggested as the major neural correlate of an abnormal ‘wanting’ process in depression (Knutson et al., 2008; Pizzagalli et al., 2009; Smoski et al., 2009; Ubl et al., 2015), dysfunction in other brain regions has also been reported, e.g. increased dorsal ACC activation is usually considered to reflect increased conflict during anticipation of monetary gains (Knutson et al., 2008).
However, while there is emerging research on anticipation of monetary incentives, relatively little is known about the neural basis of anticipation of social incentives in depression. Behavioural studies have indicated that individuals with depression reported more expectation of negative and less expectation of positive social feedback (i.e. negative expectancy bias) compared to control participants (Feeser et al., 2013; Caouette and Guyer, 2016; Setterfield et al., 2016). Thus, behavioural evidence suggests altered anticipatory processing in individuals with depression, but the neural basis of social incentive anticipation in individuals with depression has yet to be studied. Furthermore, since there are few studies presenting non-social and social incentives within the same experiment (Rademacher et al., 2010; Hames et al., 2013), it is unclear whether there is specific and dissociable neural deficits for social feedback processing in depression.
To address the issue, the current study therefore aimed to directly compare the neural correlates of monetary and social incentive processing in individuals with subthreshold depression (SD), with the hypothesis that SD is associated with neural dysfunctions in anticipating and experiencing monetary and (particularly) social incentives. We focused on SD as it allows for investigating potential depression vulnerability indices and excludes the influence of antidepressant medications or other clinical treatments on the incentive processing. We combined the MID and SID tasks in which neural responses could be examined using two types of reward (monetary gain and social approval) and loss (monetary loss and social disapproval). In healthy people, evidence suggest that non-social (e.g. money) and social incentive processing overlap in their underlying neural substrates (Izuma et al., 2008; Spreckelmeyer et al., 2009; Lin et al., 2012; Gu et al., 2019). For instance, neuroimaging meta-analysis and relevant studies revealed robust activation in striatum, ACC, insula and VLPFC in tasks presenting monetary or social incentives (Spreckelmeyer et al., 2009; Wilson et al., 2018). Individuals with depression have reduced striatum and increased ACC activity in response to monetary incentives (Knutson et al., 2008; Pizzagalli et al., 2009), while they show increased ACC, insula and VLPFC responses in processing social incentives (Silk et al., 2014; Kumar et al., 2017; Jankowski et al., 2018). Therefore, we expected that in individuals with SD, processing both types of incentive would share a common pattern of increased ACC response, while reduced striatum would be specific to the processing of monetary incentives, and increased VLPFC and insula would be specific to social incentive processing.
Methods
Participants
In a mental health screening of Shenzhen University, the Self-rating Depression Scale (SDS, Zung et al., 1965), the Beck Depression Inventory Second Edition (BDI-II, Beck et al., 1996) and the Trait form of Spielberger’s State-trait Anxiety Inventory (STAI-T, Spielberger et al., 1983) were administered to all the freshman students (approximately 6000 students). This study included individuals from this sample with SD indexed by (1) level of depressive severity (measured by SDS) > 0.5 and (2) BDI-II scores > 13. Note: according to the norms of SDS (Zung et al., 1965), a SDS score > 0.5/0.6/0.7 indicates mild, moderate and severe depression; according to the norms of BDI-II (Zung et al., 1965), a BDI-II score > 13/19/28 indicates mild, moderate and severe depression.
Exclusion criteria included: (i) any lifetime Axis I disorders other than depression according to Structured Clinical Interview for DSM-IV-TR Axis I Disorders, Research Version, Non-patient Edition (SCID-I/NP; First et al., 2002); (ii) high level of anxiety, i.e. students with STAI-T scores ranked above 75% of the distribution (Xie et al., 2018); (iii) seizure disorder; (iv) history of head injury with possible neurological sequelae; (v) self-reported prior use of any psychoactive drugs especially medication for depression; and (vi) current alcohol drug dependence.
Age- and gender-matched healthy controls (HCs) were recruited from the same sample source as individuals with SD. These participants had scores of depressive severity <0.5 (measured by SDS) and satisfied the same exclusion criteria as individuals with SD; furthermore, the HCs were screened with SCID-I/NP to guarantee without depression. Among the students who met the above criteria, 45 individuals (23 individuals with SD and 22 HCs) participated in the current study. Written informed consent was obtained prior to the experiment. The study was approved by the Ethics Committee of Shenzhen University.
Four participants failed to complete the experiment due to technical problems or personal discomfort, so the data from 41 individuals (20 females; 19 ± 1.7 years old, mean ± s.d.) were included for data analysis. As shown in Table 1, no significant difference was found between the two groups with respect to gender (χ2 = 0.161, P = 0.217), age, handedness and STAI-T scores.
Table 1.
Demographic characteristics of the participants (mean and s.d.). SDS, Self-rating Depression Scale; STAI-T, the Trait form of Spielberger’s State-trait Anxiety Inventory; BIS/BAS, Behavioural Inhibition/Avoidance Scales; SHAPS, the Snaith–Hamilton Pleasure Scale; SPSRQ, the Sensitivity to Punishment and Sensitivity to Reward Questionnaire. Independent samples t-test was performed (two-tailed)
| Items | SDs (n = 21) | HCs (n = 20) | t | P |
|---|---|---|---|---|
| Gender (male/female) | 13/8 | 8/12 | ||
| Age (years) | 19.76 (1.92) | 19.45 (1.57) | 0.57 | 0.574 |
| Handedness, right/left | 21/0 | 20/0 | ||
| SDS | 0.54 (0.04) | 0.42 (0.06) | 7.49 | <0.001 |
| BDI-II | 16.00 (8.00) | 7.80 (5.79) | 3.74 | 0.001 |
| STAI-T | 46.67 (6.22) | 44.40 (4.37) | 1.34 | 0.187 |
| BIS/BAS | ||||
| BIS | 14.10 (2.96) | 15.60 (3.39) | −1.51 | 0.138 |
| BAS Drive | 8.48 (2.20) | 7.30 (2.15) | 1.73 | 0.092 |
| BAS Fun Seeking | 8.00 (1.84) | 8.00 (1.59) | <0.01 | 1.000 |
| BAS Reward Responsiveness | 8.62 (1.72) | 8.25 (1.80) | 0.67 | 0.506 |
| SHAPS | 1.38 (1.75) | 0.55 (0.89) | 1.94 | 0.063 |
| SPSRQ | ||||
| Sensitivity to reward | 34.43 (4.58) | 35.10 (2.94) | −0.56 | 0.581 |
| Sensitivity to punishment | 32.90 (4.95) | 35.00 (4.17) | −1.46 | 0.152 |
Brief introduction of self-reported measures
Both the Self-rating Depression Scale (SDS; Zung et al., 1965) and BDI-II (Beck et al., 1996) are widely used questionnaires to assess depressive symptoms. The score of depressive severity measured by the SDS ranges from 0.25 to 1.0, with higher scores corresponding to higher depressive severity. The BDI-II scores from 0 to 63, with high scores indicating a high level of depressive tendency.
The STAI-T (Spielberger et al., 1983) scores from 20 to 80, with high scores corresponding to high levels of anxiety.
The Behavioural Inhibition/Activation Scale (BIS/BAS) is used to assess motivation of behavioural inhibition and behavioural approach (Carver and White, 1994). It contains four subscales: BIS, BAS-Drive, BAS-Fun Seeking and BAS-Reward Responsiveness. A high score on BIS or BAS indicates a greater tendency to regulate aversive or appetitive motives so as to avoid unpleasant, or to approach desired, events and stimuli.
The Snaith–Hamilton Pleasure Scale (SHAPS) is used to capture hedonic capacity (Snaith et al., 1995). It scores from 0 to 14. A higher SHAPS score indicates higher levels of anhedonia.
The Sensitivity to Punishment and Sensitivity to Reward Questionnaire (SPSRQ) is used to assess BIS and BAS functioning, respectively (Torrubia et al., 2001). It includes two subscales: sensitivity to punishment and sensitivity to reward. Higher scores indicate higher levels of sensitivity.
These measures of the two experimental groups are reported in Table 1.
Procedure
Before the experiment, participants were required to complete the six questionnaires mentioned above. Prior to entering the functional magnetic resonance imaging (fMRI) scanner, participants performed a practice session consisting of 36 trials of both MID and SID tasks to familiarise themselves with the experiment. Then, the threshold of visual reaction time was assessed by a simple reaction time task for each participant to personalise the difficulty of the formal experiment.
The scanning task comprised 2 MID and 2 SID blocks (randomly presented; see Figure 1), preceded by an instruction screen. In both MID and SID blocks, trials began with a cue indicating potential gains (an upward arrow), losses (a downward arrow) or ‘non-rewarded control’ (a horizontally oriented arrow) for 1 s, followed by a delay (anticipation) period for a various duration ranging from 2 to 4 s. After that, a white square (target) was presented; this indicated that participants had to press a button as quickly as possible in order to gain reward or avoid loss. The presentation time of the target was individually adjusted (between 160 and 260 ms) based on the pre-assessed threshold of visual reaction time. After the response, participants received visual feedback of short video clips for 2 s.
Fig. 1.
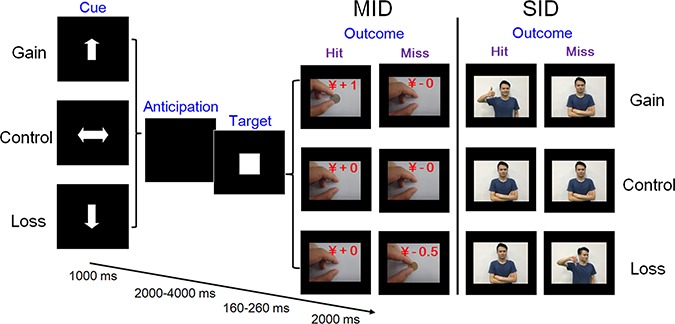
Schematic of trial sequence for the Monetary (MID) and the Social Incentive Delay (SID) Task. To increase the ecological validity of the paradigm, static photos were replaced with short movie clips during the outcome period. The person in the picture gave his consent for the material to appear in academic journals.
For the MID block, successful target hits in gain trials were followed by a short video clip showing a hand putting 1 Yuan on the desk while feedback for target misses was a neutral video clip showing the same hand putting nothing on the desk. Similarly in loss trials, feedback for misses was a video showing the hand removing 0.5 Yuan from the desk, while target hits were followed by the neutral video clip (Figure 1). The feedback video clips for SID blocks were analogous to those in MID blocks: successful target hits in gain trials resulted in a video clip showing a person who nodded with a smile and held up his/her thumb, while feedback for misses was a neutral video showing the same person with neutral facial expressions and body gestures. In loss trials, feedback for hits was the neutral clip while feedback for misses was a video clip showing a person who shook his/her head with a contemptuous facial expression and gave a ‘thumbs down’ gesture. In both MID and SID blocks, feedback in control trials was always the neutral video clip. There were four (paper and coin money with front or the other side) and eight (four actors and four actresses) sets of video clips for MID and SID blocks.
Participants were encouraged to respond to maximise their total rewards: for the MID block, their monetary gain and loss were linked to their final payment; for the SID block, they were told that their performance would be judged by peers assessing their IQ (with the assumption that faster reaction time is associated with higher IQ). Participants were led to believe that the ‘peers’ giving the feedback were the ones making the judging. Unbeknownst to participants, these ‘peers’ had not judged participants’ response capability, and the video clips presented during the scanning session were simply of volunteers who provided consent for their video to be used for scientific purposes. After the task, participants were asked if they really believed that their IQ was evaluated by the peers during the task. All the 41 individuals believed the cover story.
Image acquisition
Brain images were collected using a 3 T Siemens TRIO MR scanner. Functional images were collected using an echo planar imaging sequence (number of slices, 41; gap, 0.6 mm; slice thickness, 3.0 mm; repetition time (TR), 2000 ms; echo time (TE), 25 ms; flip angle, 90°; voxel size, 3 mm × 3 mm × 3 mm; field of view (FOV), 200 mm × 200 mm). Structural images were acquired through 3D sagittal T1-weighted magnetisation-prepared rapid gradient echo (192 slices; TR, 2530 ms; TE, 3.39 ms; voxel size, 1.0 mm × 1.0 mm × 1.0 mm; flip angle, 7°; inversion time, 1100 ms; FOV, 256 mm × 256 mm).
Image analysis
fMRI data processing
Images were pre-processed and analysed using Statistical Parametric Mapping (SPM8; http://www.fil.ion.ucl.ac.uk/spm). The first five volumes were discarded because of signal equilibration and participants’ adaptation to scanning noise. All remaining images were slice timing–corrected and realigned for motion correction by registration to the mean image. Artefact detection was conducted using the Artifact Detection Tools (ART) toolbox (https://www.nitrc.org/projects/artifact_detect); global mean intensity (>2 s.d. from mean image intensity for the entire scan) and motion (>2 mm) outliers were identified and entered as a regressor of no interest in the first-level general linear model (GLM) (Stoodley et al., 2012). Then, functional images were co-registered with the T1-weighted 3D images, normalized to standard MNI space and smoothed with a 6 mm FWHM isotropic Gaussian kernel. We chose this parameter as it was double the voxel size (3 mm) and would retain resolution for identifying changes in the relatively small brain regions we are interested in (see Pizzagalli et al., 2009; Ubl et al., 2015).
Pre-processed data were analysed as an event-related design in the context of the GLM approach in a two-level procedure. At the first level, regressors including three anticipation conditions (anticipation of gain, loss and neutral outcome) and three outcome conditions (feedback of gain, loss and neutral outcome) were modelled (a total of six factors). Due to the insufficient number of ‘miss’ trials in the behavioural task, only ‘hit’ trials during the outcome period were included for fMRI data analysis. Anticipation was the delay between cue disappearance and target appearance and was modelled as a brief block corresponding to the actual delay. Outcome was the feedback appearance, which was modelled as a single event with 0 s duration convolved with the canonical hemodynamic response function (HRF). To account for variance caused by head movement, six realignment motion parameters (three translations/rotations), and outlier scans identified by the ART toolbox were included as nuisance regressors in the model. Each normalized image was then high-pass filtered using a cutoff time constant of 128 s. In two tasks (MID, SID), contrast images for gain and loss were separately calculated for both anticipation and outcome stages, including (i) monetary gain vs monetary control, (ii) monetary loss vs monetary control, (iii) social gain vs social control, (iv) social loss vs social control, (v) (monetary and social) gain vs control, (vi) (monetary and social) loss vs control, (vii) monetary gain vs social gain, (viii) social gain vs monetary gain, (ix) monetary loss vs social loss and (x) social loss vs monetary loss.
These contrast images were taken to the second-level analysis. First, we performed one-sample t-tests, in which whole-brain analyses were computed for all contrasts separately for individuals with SD and HCs to identify whether the paradigm had activated brain regions as established in previous studies (Silk et al., 2014; Kumar et al., 2017; Jankowski et al., 2018; Wilson et al., 2018). To detect group differences, two-sample t-tests were also conducted at the whole-brain level. These tests were set to a threshold of family-wise error (FWE)–corrected P < 0.05. Results are reported in the Supplementary Material.
Based on findings from previous meta-analysis on monetary or social incentive processing in health (Oldham et al., 2018; Wilson et al., 2018; Gu et al., 2019) and relevant neuroimaging research in individuals with depression (Ubl et al., 2015), we created masks including ACC (Knutson et al., 2008; McCabe et al., 2009; Smoski et al., 2009; Gotlib et al., 2010; Smoski et al., 2011; Dichter et al., 2012; McCabe et al., 2012), insula (Silk et al., 2014; Kumar et al., 2017; Jankowski et al., 2018), striatum (caudate and putamen; Forbes, 2009; Kohls et al., 2013; McCabe et al., 2009; Pizzagalli et al., 2009; Smoski et al., 2009; Stoy et al., 2012) and VLPFC (Silk et al., 2014; Kumar et al., 2017; Jankowski et al., 2018) to perform the region of interest (ROI) analyses. ROIs specified by masks were derived from the automated anatomical labelling in the Wake Forest University Pick Atlas (WFU Pick Atlas v2.5; http://fmri.wfubmc.edu/software/PickAtlas). Peak activations were extracted from ROIs that reached significance threshold of P < 0.012 with false discovery rate (FDR) correction (Bonferroni adjusted accounting for four ROIs) using the MarsBaR function (Matthew et al., 2002). Maximum peak activations were then compared using follow-up group-by-condition ANOVA with task (MID, SID) and valence (gain, loss) as within- and group (individuals with SD, HCs) as the between-subject factor, unless otherwise stated.
Brain-behavioural correlations
For each participant, beta weights were extracted from ROIs that reached significance during second-level analyses for both anticipation and consumption stages. The extracted beta weights represent the magnitude of peak activation for each significant ROI, which was used to test for the degree of association between self-reported measures and anticipation- and consumption-related brain activations.
Task-dependent functional connectivity analysis
To further explore the group differences in functional connectivity, we used a generalized form of task-dependent psychophysiological interaction (gPPI, http://www.nitrc.org/projects/gppi) to examine task-dependent functional connectivity of brain regions associated with both anticipation and consumption of social feedback to shed light on the neural networks involved (McLaren et al., 2012). The peak voxel of ROIs that reached significance during second-level analyses were used to create volumes of interest (VOIs) for each participant. Specifically, for each participant, a VOI was generated by creating a 6 mm sphere around this voxel (Ford and Kensinger, 2014). The first eigenvariate was extracted from the time series of the voxels in the specific clusters for each participant. Then, the extracted time series were deconvolved so as to uncover neuronal activity (i.e. physiological variable). The resulting time series were then multiplied with the task design vector and reconvolved with the canonical HRF to form the PPI regressor of interest. These regressors along with the task conditions and the eigenvariate time course were all included in the first-level GLM. Contrast images were then entered into a second-level statistical analysis with a two-sample t-test. Multiple comparison correction was performed as described for the GLM analysis. All the data and code used in this study could be available via email zhangdd05@gmail.com (D.Z.).
Statistics
Descriptive data are presented as means ± SEM, unless otherwise stated.
Behavioural data
Three-way repeated-measure ANOVA was performed on reaction time (RT) for hits, with task (MID, SID) and valence (gain, loss, control) as the within factors and group (individuals with SD, HCs) as the between factors. Post hoc Bonferroni tests were used to examine pairwise differences in the ANOVA.
Neuroimaging data
For ROI analysis, maximum peak activations that reached Bonferroni-corrected significance during second-level analyses were then compared using follow-up group-by-condition ANOVA with task and valence (gain, loss) as within- and group as the between-subject factor, unless otherwise stated.
To assess brain-behavioural correlations, we calculated group-wise Pearson’s partial correlation coefficients separately for individuals with SD and HCs to allow for statistical non-independence (P < 0.05; two-tailed; Poldrack and Mumford, 2009; Ubl et al., 2015). Depression severity measured by the SDS was controlled. The Fisher r-to-z transformation (Zar, 1996) was applied to assess the significance of the difference between two correlation coefficients.
For functional connectivity, independent samples t-test was performed (two-tailed) on the extracted gPPI parameter estimates of connectivity between groups.
Results
Behavioural results
A significant main effect of valence was found [F(2,78) = 11.79, P < 0.001,  = 0.232] with faster RTs in gain (245.32 ± 5.65 ms) and loss conditions (245.37 ± 5.53 ms) than in the control condition (250.75 ± 6.01 ms). No significant group differences were found.
Whole-brain analyses
Within-group analyses
The anticipation and consumption of both incentives were associated with significant response in brain regions including all ROIs, i.e. ACC, striatum, insula and VLPFC, which are known to be responsible for the processing of reward and loss. This was observed in both HC and SD groups (Supplementary Tables S1 and S2).
Between-group analyses
No regions showed between-group differences surviving correction at P < 0.05 (FWE-corrected) in whole-brain analysis. In the following sections, we report results for the between group comparisons using the previously defined ROIs (Table 2).
Table 2.
Result of the ROI analysis. Data are thresholded at P < 0.012 (Bonferroni-adjusted FDR), with MNI coordinates listed. R: right. L: left
| Region | Cluster size, voxels | z score | P value | x | y | z |
|---|---|---|---|---|---|---|
|
Anticipation of social loss vs social control
Individuals with SD > HCs | ||||||
| L ACC | 11 | 3.97 | 0.010 | 0 | 21 | −9 |
|
Consumption of social gain vs social control
Individuals with SD < HCs | ||||||
| L putamen | 13 | 3.89 | 0.011 | −21 | 3 | 12 |
|
Consumption of social loss vs social control
Individuals with SD < HCs | ||||||
| L insula | 16 | 4.18 | 0.008 | −36 | 6 | −9 |
Neural activation in ROIs
Statistical results of ANOVAs are listed in Table 3.
Table 3.
Significant results of the ANOVAs for neural activation in ROIs
| Effects | ACC | Putamen | Insula |
|---|---|---|---|
| Group |
F(1,39) = 6.96, P = 0.012,  = 0.151 = 0.151 |
Not significant | Not significant |
| Task | Not significant | Not significant | Not significant |
| Valance | Not significant | Not significant |
F(1,39) = 5.52, P = 0.024,  = 0.124 = 0.124 |
| Group × task |
F(1,39) = 6.27, P = 0.017,  = 0.138 = 0.138 |
F(1,39) = 11.70, P = 0.001,  = 0.231 = 0.231 |
F(1,39) = 18.38, P < 0.001,  = 0.320 = 0.320 |
| Group × valance |
F(1,39) = 4.16, P = 0.048,  = 0.096 = 0.096 |
Not significant | Not significant |
| Task × valance | Not significant | Not significant | Not significant |
| Group × task × valance | Not significant | Not significant | Not significant |
Anticipation
Group contrasts for social loss vs social control revealed significantly increased activity in SDs compared to HCs in the left sgACC (x = 0, y = 21, z = −9; P = 0.01, z = 3.97; Figure 2). The ANOVA revealed a main effect of group: SDs (−0.16 ± 0.09) showed enhanced sgACC response compared to HCs (−0.49 ± 0.09). A significant interaction was observed between group and task: while activation in SDs and HCs did not differ in the MID task [F(1,39) < 1; SDs = −0.41 ± 0.13, HCs = −0.37 ± 0.13]; SDs (0.09 ± 0.14) showed enhanced response compared to HCs in the SID task [−0.61 ± 0.14; F(1,39) = 12.31, P = 0.001]. Furthermore, while no significant activation difference was found in HCs between the MID and SID tasks [F(1,39) = 1.35, P = 0.253; MID = −0.37 ± 0.13, SID = −0.61 ± 0.14], SDs showed enhanced response in the SID task (0.09 ± 0.14) compared to the MID task [−0.41 ± 0.13; F(1,39) = 5.73, P = 0.022]. The interaction between group and valence was also significant. While SDs and HCs did not differ for the gain condition [F(1,39) = 1.48, P = 0.231; SDs = −0.19 ± 0.10, HCs = −0.36 ± 0.10], SDs (−0.13 ± 0.10) showed enhanced response compared to HCs [−0.61 ± 0.11] in the loss condition [F(1,39) = 10.58, P = 0.002]. Furthermore, while SDs did not show significantly different activation in gain compared to loss conditions [F(1,39) < 1; gain = −0.19 ± 0.10, loss = −0.13 ± 0.10], HCs exhibited enhanced response in the gain condition (−0.36 ± 0.10) compared to the loss condition [−0.61 ± 0.11; F(1,39) = 5.24, P = 0.028; Figure 2).
Fig. 2.
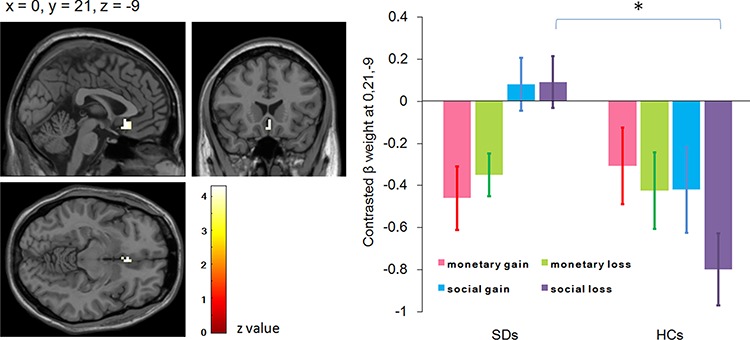
Activation foci showing increased activity in individuals with subthreshold depression (SD) compared with healthy controls (HCs) during anticipation of social loss vs social control and the follow-up interaction effect between task and group in the left subgenual anterior cingulate cortex (ROI analysis, P < 0.012, Bonferroni-adjusted FDR, displayed on the SPM canonical template). All conditions (monetary gain, monetary loss, social gain and social loss) have been contrasted by relevant control conditions.
Consumption
Group contrasts for social gain vs social control revealed significantly decreased activity in SDs compared with HCs in the left striatum (putamen; x = −21, y = 3, z = 12; P = 0.011, z = 3.89; Figure 3). The ANOVA revealed a significant interaction between group and task: while activation in SDs and HCs did not differ in the MID task [F(1, 39) = 1.34, P = 0.254; SDs = 0.47 ± 0.39, HCs = −0.17 ± 0.40], SDs (−1.03 ± 0.36) showed reduced response compared to HCs in the SID task [0.64 ± 0.37; F(1,39) = 10.66, P = 0.002]. Furthermore, while no significant activation difference was found in HCs between the MID task and SID task [F(1,39) = 2.83, P = 0.101; MID = −0.17 ± 0.40, SID = 0.64 ± 0.37], SDs showed reduced response in the SID task (−1.03 ± 0.36) compared to that in the MID task [0.47 ± 0.39; F(1,39) = 10.08, P = 0.003; Figure 3).
Fig. 3.
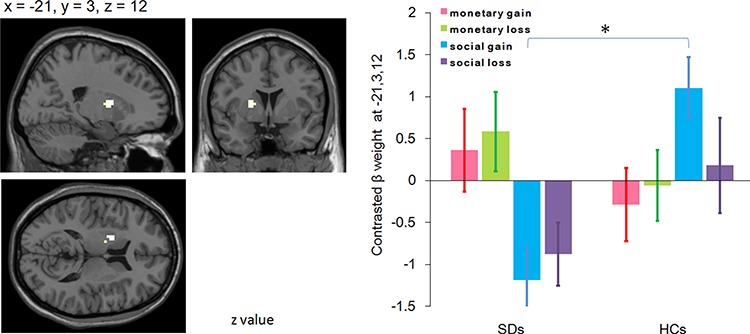
Activation foci showing decreased activity in individuals with SD compared with HCs during consumption of social gain vs social control and the follow-up interaction effect between task and group in the left putamen (ROI analysis, P < 0.012, Bonferroni-adjusted FDR). All conditions have been contrasted by relevant control conditions.
Group contrasts for social loss vs social control revealed significantly decreased activity in SDs compared to HCs in the left anterior insula (x = −36, y = 6, z = −9; P = 0.008, z = 4.18; Figure 4). The ANOVA revealed a significant main effect of valence, with enhanced response in the gain condition (0.60 ± 0.30) compared to that in the loss condition (−0.01 ± 0.17). The interaction between group and task was also significant: while activation in SDs and HCs did not differ in the MID task [F(1,39) = 3.09, P = 0.09; SDs = 0.55 ± 0.38, HCs = −0.40 ± 0.39], SDs (−0.37 ± 0.34) showed reduced response compared to HCs in the SID task [1.43 ± 0.35; F(1,39) = 13.90, P = 0.001]. Furthermore, while HCs showed enhanced response in the SID task (1.43 ± 0.35) compared to that in the MID task [−0.40 ± 0.39; F(1,39) = 15.85, P < 0.001], SDs showed reduced response in the SID task (−0.37 ± 0.34) compared to that in the MID task [0.55 ± 0.38; F(1,39) = 4.24, P = 0.046; Figure 4).
Fig. 4.
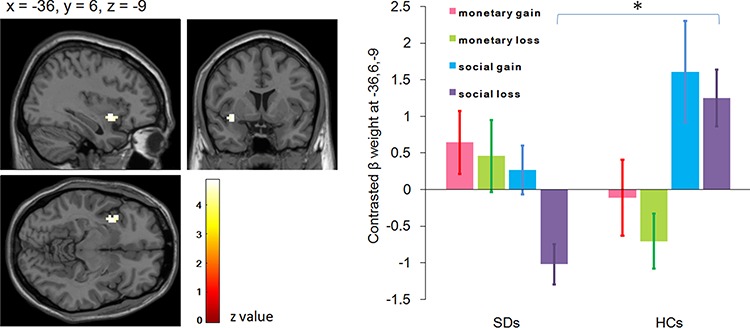
Activation foci showing decreased activity in individuals with SD compared with HCs during consumption of social loss vs social control and the follow-up interaction effect between task and group in the left insula (ROI analysis, P < 0.012, Bonferroni-adjusted FDR). All conditions have been contrasted by relevant control conditions.
Brain-behavioural correlations
Partial correlation was performed between individual beta weights of statistically significant ROIs and self-reported measures. Result revealed that sensitivity to punishment (measured by the SPSRQ) was positively correlated with insula activity during the consumption of social loss (rpart = 0.478, df = 18, P = 0.033) in SDs (Figure 5). No significant correlations were found in HCs (rpart = 0.037, df = 17, P = 0.880). Fisher r-to-z transformation revealed no significant difference of those two correlation coefficients between SDs and HCs (z = 1.43, P = 0.153).
Fig. 5.
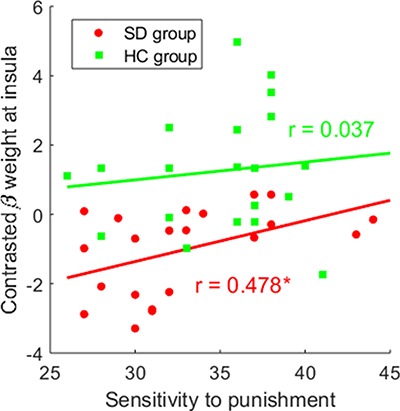
Scatter plot of partial correlations between the sensitivity to punishment (assessed by SPSRQ) and the maximal peak activation (beta weights) at insula during consumption of social loss vs social control. The correlation was adjusted for depression severity measured by the SDS scale.
Functional connectivity
The connectivity between the left insula (x = −36, y = 6, z = −9) and right VLPFC (x = 45, y = 21, z = 18; z = 4.87, κ = 1) was significantly larger in SDs (0.73 ± 0.24) than in HCs (−1.12 ± 0.21; t(39) = 5.807, P < 0.001) for the contrast of social loss vs social control in the consumption stage (Figure 6). Specifically, SDs showed a positive, whereas HCs showed a negative connectivity between the two regions.
Fig. 6.
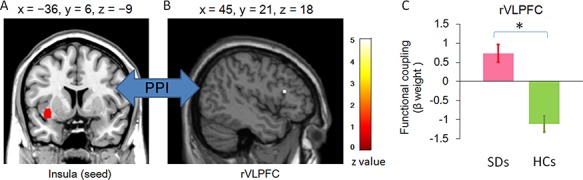
Functional connectivity between insula and rVLPFC during the consumption of social loss vs social control. (A) Coronal view of insula (seed), defined by peak voxel that reached significance during second-level analyses. Then, a VOI was generated by creating a 6 mm sphere around this voxel. (B) Sagittal view of rVLPFC showing increased functional connectivity in individuals with SD. (C) The bar chart of the parameter estimates and SEM in the rVLPFC cluster.
Discussion
The current study aimed to disentangle neural engagement of anticipating and consuming monetary vs social incentives in individuals with subthreshold depression. Results showed that, relative to HCs, individuals with SD showed elevated sgACC activity for anticipation of social loss, reduced putamen activity for consumption of social gain, and diminished insula response during consumption of social loss. In contrast, no group differences were observed for monetary incentive processing. The results therefore indicate specific neural dysfunction-associated social, but not non-social, incentive processing in individuals with SD.
Behavioural performance in individuals with SD and HCs was similar: both groups responded faster on reward and loss trials than on no-incentive trials, regardless of the incentive types. This result suggests that valence manipulations in both tasks successfully modified motivation to respond. The lack of group differences in behavioural performance has been reported previously using similar tasks in individuals with clinical (Knutson et al., 2008; Pizzagalli et al., 2009; Smoski et al., 2009; Stoy et al., 2012; Ubl et al., 2015) and subclinical depression (Mori et al., 2016). A possible reason is that the MID task is more sensitive to neural response than to behavioural performance (Mori et al., 2016). This explanation may also apply to the similar SID task.
In this study, individuals with SD exhibited enhanced responses in sgACC compared to HCs during social loss anticipation. BOLD signals in sgACC, a region strongly linked to both social pain (Eisenberger, 2012; Rotge et al., 2015) and an aetiology of depression (Drevets et al., 2008), have been shown to be elevated during social exclusion in depressed individuals (Silk et al., 2014) and could predict increases in depressive symptoms (Masten et al., 2011). The sgACC has been suggested to play a role not only in generation and recognition (Phillips et al., 2003) but also in anticipation of negative emotion (Ploghaus et al., 2003; Nitschke et al., 2006; Straube et al., 2009). We here demonstrated that individuals with SD over-recruited sgACC during anticipation of social loss, which is consistent with hyper-responsivity of the sgACC to social loss as suggested in previous research.
Relative to controls, individuals with SD exhibited weaker left putamen response as they consumed social gain. Decreased putamen response during the consumption of reward has been found in individuals at high risk of depression (Gotlib et al., 2010), MDD participants (Knutson et al., 2008), and those with remitted depression (McCabe et al., 2009), indicating that it could represent a potential endophenotypic marker for depression. The putamen is an important striatal structure for both money and social reward (Izuma et al., 2008) and has been shown to be related to anhedonia in depression (Keedwell et al., 2005). However, stimuli used in previous studies have to date been restricted to monetary gain, food reward or happy facial expressions with no or limited social approval meaning. Our finding corroborates and extends prior research by suggesting that, similar to non-social rewards (food or money), social rewards (i.e. positive social feedback) elicit reduced activation within the putamen in depression. This finding is also in agreement with the notion that hypoactivation of striatal areas could be an underlying mechanism for social anhedonia in depression (Kupferberg et al., 2016). However, it should be noted that putamen activity was not correlated with self-reported social anhedonia in our study. More studies are needed to further examine the issue using other paradigms.
We also found decreased left insula activation in response to social loss outcome in individuals with SD compared to HCs. This finding is consistent with a previous study, which observed lower insula activation in response to social evaluative threat in a subclinical depression group compared to a healthy group (Dedovic et al., 2014). The finding is also in accord with previous studies using negative non-social emotional stimuli, which showed reduced insula activity in people with current (Davidson et al., 2003; Kumari et al., 2003; Lee et al., 2007) and remitted (Thomas et al., 2011) depression. A meta-analysis of depression has also highlighted the hypoactivated insula in resting state paradigms and negative emotion induction studies (Fitzgerald et al., 2008). However, an opposite pattern of insula activation (hyperactivation) has been reported in response to social rejection in currently depressed youth (Silk et al., 2014; Jankowski et al., 2018) and older adult patients (Kumar et al., 2017). A possible explanation for the inconsistency in social-related studies is that different samples of depressed individuals were used. Those with subclinical depression may differ in their insula response (hypoactivity) to negative social stimuli compared to those with clinical depression (hyperactivity). Although the findings of the social rejection studies on clinical depression differ from the current study, probably because of the nature of the population recruited or the tasks employed, our findings do suggest that abnormalities in the neural substrate of social loss might be present in subclinical individuals before the onset of MDD. Future research could untangle this issue by comparing both subclinical and clinical samples.
Insula is known to be activated by aversive stimuli (e.g. social loss in the current study; Caria et al., 2010). Decreased insula activation in individuals with SD may indicate reduced negative emotional response to social loss. It is therefore worth considering whether there is a group difference of the underpinning neural networks associated with insula. Therefore, this study performed a PPI analysis to examine changes in functional connectivity between the insula and other ROIs. In addition to the above reason, we selected this region as a seed for the PPI analysis because of its modulation by positive and negative emotions (Uddin, 2015), especially social stress (exclusion; Wang et al., 2017), as well as its implicated role in both affective and social functioning (Lamm and Singer, 2010; Kumar et al., 2017). We discovered an increased insula functional connectivity with rVLPFC during social loss consumption in individuals with SD. Specifically, this coupling is positive in individuals with SD, while it is negative in HCs. Converging evidence in healthy participants has revealed that both are key regions in processing of ‘social pain’, and VLPFC negatively correlates with activities in the insula, reflecting a function of emotion regulation (Eisenberger et al., 2003; Lorenz et al., 2003; Masten et al., 2009; Wang et al., 2017). Our finding in HCs is in line with these previous accounts. However, positive VLPFC-insula functional activity in individuals with SD might reveal a failure on the part of the pre-frontal area to suppress insula functioning. Adopting a broader neural network view, dysfunctional cortical–limbic circuitry has been well-reported in individuals with depression (Seminowicz et al., 2004; Anand et al., 2005; Langenecker et al., 2007). Aberrant function in insula/VLPFC, as the key regions in this network (Sliz and Hayley, 2012), has been shown to be responsible for impaired emotion salience processing and maladaptive emotion regulation and thus leading to depressogenic information processing deficits (Jankowski et al., 2018). In the current study, the abnormally strengthened connectivity between the two areas may cause insensitivity to and insufficient regulation of these brief social challenges. Therefore, our results extend previous studies by indicating that dysfunctional cortical–limbic circuitry are not only involved in basic emotion processing (Anand et al., 2005) but also implicated in the processing of social signals. In individuals with SD, greater sensitivity to punishment as assessed by the SPSRQ scale was found to be associated with increased activation in insula during social loss consumption. This result suggests that individuals with SD who reported higher punishment sensitivity recruited stronger insula response to social loss, which might indicate that depressogenic insula activity was modulated by self-reported punishment sensitivity.
No differences were observed between individuals with SD and HCs in reward network activation during the monetary incentive processing. These findings are counter to previous research using the MID task, which found altered fronto-cingulate-striatal responses in clinical depression (Knutson et al., 2008; Pizzagalli et al., 2009; Zhang et al., 2013). Again, this may relate to studying subclinical participants in the present study, compared to findings in those with clinical depression in previous studies. To our knowledge, only one study has used this task in subclinical depression: Mori et al. (2016) showed hypoactive responsiveness in the left VLPFC and angular gyrus during a MID task in individuals with SD, which can be normalized by psychotherapy. However, neural alterations observed in their study were not located in typical monetary reward-related regions and, as the authors suggest, their sample size is relatively small (n = 15). Therefore, it is possible that subclinical populations with depression show reward-processing abnormalities that are specific to social incentives, while those with clinical symptoms show more widespread reward-related abnormalities extending to non-social domains.
Several limitations should be noted. First, we did not obtain a direct self-report comparison of the pleasantness or averseness of monetary vs social incentives. However, behavioural results found that gain and loss trials were associated with faster RTs than neutral trials for both monetary and social runs, indicating both may function in a similar way to change behaviour. Second, the monetary and social incentives used in this study are both secondary incentives, i.e. no inherent reward or loss in itself and for which incentive value must be learned (Rizvi et al., 2016). We did not include a comparison with a primary incentive (e.g. food). There is evidence for different neural mechanisms between the processing of primary and secondary rewards (Sescousse et al., 2013), and hedonic function has been shown to be disrupted in depression using food rewards as stimuli (Rizvi et al., 2016). It would be interesting if future studies on subclinical and clinical depression can probe the processing of primary vs secondary incentives. Third, most of the subjects in SD group only had mild depression symptoms (mean SDS sore of 0.54 and mean BDI-II score of 16), which might result in false negative findings in this study. Lastly, our study was carried out exclusively in young adults. These findings may therefore not be representative of those seen in older adults. However, it should be noted that the highest prevalence of major depressive disorder is seen in those aged 20–29 years (Ferrari et al., 2013). Understanding the biological and psychological factors that pre-dispose people to initial episodes of clinical depression is therefore a key to effective, early interventions. Furthermore, in older cohorts, multiple episodes, chronic symptoms and effects of treatment (pharmacological or psychological) may represent confounds.
In sum, our findings provide evidence that SD is characterised by distinct neural alteration in processing monetary and social incentives. The two incentives evoked distinct patterns of neural alteration in sgACC, putamen, insula and rVLPFC, which are specific to social incentive processing and largely reflect ‘social pain’ network dysfunction. Although there are some discrepancies between our findings and previous work, this could be at least partly explained by clinical status and demographic differences in different population samples. Our finding suggests that social incentive processing abnormalities may be more trait-like than non-social reward. This research may help us understand how specific brain dysfunctions in depression may contribute to their deficits in processing social incentives.
Funding
This study was funded by the National Natural Science Foundation of China (31571120), Shenzhen Basic Research Project (JCYJ20180305124305294; JCYJ20150729104249783) and Guangdong-Government Funding for Scientific Research (2015KCXTD009, 2016KZDXM009).
Supplementary Material
References
- Anand A., Li Y., Wang Y., Wu J., Gao S., Bukhari L., et al. (2005). Activity and connectivity of brain mood regulating circuit in depression: a functional magnetic resonance study. Biological Psychiatry, 57(10), 1079–88. [DOI] [PubMed] [Google Scholar]
- Beck A.T., Steer R.A., Brown G.K. (1996). Beck Depression Inventory-Second Edition Manual, San Antonio, TX: The Psychological Corporation. [Google Scholar]
- Berridge K.C. (1999). Pleasure, pain, desire, and dread: hidden core processes of emotion In: Kahneman D., Diener E., Schwarz N., editors. Well-being: The Foundations of Hedonic Psychology, New York: Russell Sage Foundation, pp. 525–57. [Google Scholar]
- Brinkmann K., Franzen J., Rossier C., Gendolla G.H.E. (2014). I don’t care about others’ approval: dysphoric individuals show reduced effort mobilization for obtaining a social reward. Motivation and Emotion, 38(6), 790–801. [Google Scholar]
- Caouette J.D., Guyer A.E. (2016). Cognitive distortions mediate depression and affective response to social acceptance and rejection. Journal of Affective Disorders, 190, 792–9. [DOI] [PMC free article] [PubMed] [Google Scholar]
- Caria A., Sitaram R., Veit R., Begliomini C., Birbaumer N. (2010). Volitional control of anterior insula activity modulates the response to aversive stimuli. A real-time functional magnetic resonance imaging study. Biological Psychiatry, 68(5), 425–32. [DOI] [PubMed] [Google Scholar]
- Carver C.S., White T.L. (1994). Behavioral inhibition, behavioral activation, and affective responses to impending reward and punishment: the BIS/BAS scales. Journal of Personality and Social Psychology, 67(2), 319–33. [Google Scholar]
- Davey C.G., Allen N.B., Harrison B.J., Yucel M. (2011). Increased amygdala response to positive social feedback in young people with major depressive disorder. Biological Psychiatry, 69(8), 734–41. [DOI] [PubMed] [Google Scholar]
- Davidson R.J., Irwin W., Anderle M.J., Kalin N.H. (2003). The neural substrates of affective processing in depressed patients treated with venlafaxine. The American Journal of Psychiatry, 160(1), 64–75. [DOI] [PubMed] [Google Scholar]
- Dedovic K., Duchesne A., Engert V., Lue S.D., Andrews J., Efanov S.I., et al. (2014). Psychological, endocrine and neural responses to social evaluation in subclinical depression. Social Cognitive and Affective Neuroscience, 9(10), 1632–44. [DOI] [PMC free article] [PubMed] [Google Scholar]
- Dichter G.S., Kozink R.V., McClernon F.J., Smoski M.J. (2012). Remitted major depression is characterized by reward network hyperactivation during reward anticipation and hypoactivation during reward outcomes. Journal of Affective Disorders, 136(3), 1126–34. [DOI] [PMC free article] [PubMed] [Google Scholar]
- Drevets W.C., Savitz J., Trimble M. (2008). The subgenual anterior cingulate cortex in mood disorders. CNS Spectrums, 13(8), 663–81. [DOI] [PMC free article] [PubMed] [Google Scholar]
- Eisenberger N.I. (2012). The pain of social disconnection: examining the shared neural underpinnings of physical and social pain. Nature Reviews Neuroscience, 13(6), 421–34. [DOI] [PubMed] [Google Scholar]
- Eisenberger N.I., Lieberman M.D., Williams K.D. (2003). Does rejection hurt? An FMRI study of social exclusion. Science, 302(5643), 290–2. [DOI] [PubMed] [Google Scholar]
- Eshel N., Roiser J.P. (2010). Reward and punishment processing in depression. Biological Psychiatry, 68(2), 118–24. [DOI] [PubMed] [Google Scholar]
- Feeser M., Schlagenhauf F., Sterzer P., Park S., Stoy M., Gutwinski S., et al. (2013). Context insensitivity during positive and negative emotional expectancy in depression assessed with functional magnetic resonance imaging. Psychiatry Research, 212(1), 28–35. [DOI] [PubMed] [Google Scholar]
- Ferrari A.J., Charlson F.J., Norman R.E., Patten S.B., Freedman G., Murray C.J., et al. (2013). Burden of depressive disorders by country, sex, age, and year: findings from the global burden of disease study 2010. PLoS Medicine, 10(11), e1001547. [DOI] [PMC free article] [PubMed] [Google Scholar]
- First M.B., Gibbon M., Spitzer R.L., Williams J.B.W. (2002). Structured Clinical Interview for DSM-IV-TR Axis I Disorders, Research Version, Non-Patient Edition (SCID-I/NP), New York: Biometrics Research Department, New York State Psychiatric Institute. [Google Scholar]
- Fitzgerald P.B., Laird A.R., Maller J., Daskalakis Z.J. (2008). A meta-analytic study of changes in brain activation in depression. Human Brain Mapping, 29(6), 683–95. [DOI] [PMC free article] [PubMed] [Google Scholar]
- Forbes E.E. (2009). Where’s the fun in that? Broadening the focus on reward function in depression. Biological Psychiatry, 66(3), 199–200. [DOI] [PMC free article] [PubMed] [Google Scholar]
- Forbes E.E., Christopher M.J., Siegle G.J., Ladouceur C.D., Ryan N.D., Carter C.S., et al. (2006). Reward-related decision-making in pediatric major depressive disorder: an fMRI study. Journal of Child Psychology and Psychiatry, 47(10), 1031–40. [DOI] [PMC free article] [PubMed] [Google Scholar]
- Forbes E.E., Hariri A.R., Martin S.L., Silk J.S., Moyles D.L., Fisher P.M., et al. (2009). Altered striatal activation predicting real-world positive affect in adolescent major depressive disorder. The American Journal of Psychiatry, 166(1), 64–73. [DOI] [PMC free article] [PubMed] [Google Scholar]
- Ford J.H., Kensinger E.A. (2014). The relation between structural and functional connectivity depends on age and on task goals. Frontiers in Human Neuroscience, 8, 307. [DOI] [PMC free article] [PubMed] [Google Scholar]
- Gotlib I.H., Hamilton J.P., Cooney R.E., Singh M.K., Henry M.L., Joormann J. (2010). Neural processing of reward and loss in girls at risk for major depression. Archives of General Psychiatry, 67(4), 380–7. [DOI] [PMC free article] [PubMed] [Google Scholar]
- Gu R., Huang W., Camilleri J., Xu P., Wei P., Eickhoff S.B., et al. (2019). Love is analogous to money in human brain: coordinate-based and functional connectivity meta-analyses of social and monetary reward anticipation. Neuroscience and Biobehavioral Reviews, 100, 108–28. [DOI] [PMC free article] [PubMed] [Google Scholar]
- Hames J.L., Hagan C.R., Joiner T.E. (2013). Interpersonal processes in depression. Annual Review of Clinical Psychology, 9, 355–77. [DOI] [PubMed] [Google Scholar]
- Hsu D.T., Sanford B.J., Meyers K.K., Love T.M., Hazlett K.E., Walker S.J., et al. (2015). It still hurts: altered endogenous opioid activity in the brain during social rejection and acceptance in major depressive disorder. Molecular Psychiatry, 20(2), 193–200. [DOI] [PMC free article] [PubMed] [Google Scholar]
- Izuma K., Saito D.N., Sadato N. (2008). Processing of social and monetary rewards in the human striatum. Neuron, 58(2), 284–94. [DOI] [PubMed] [Google Scholar]
- Jankowski K.F., Batres J., Scott H., Smyda G., Pfeifer J.H., Quevedo K. (2018). Feeling left out: depressed adolescents may atypically recruit emotional salience and regulation networks during social exclusion. Social Cognitive and Affective Neuroscience, 13(8), 863–76. [DOI] [PMC free article] [PubMed] [Google Scholar]
- Keedwell P.A., Andrew C., Williams S.C., Brammer M.J., Phillips M.L. (2005). The neural correlates of anhedonia in major depressive disorder. Biological Psychiatry, 58(11), 843–53. [DOI] [PubMed] [Google Scholar]
- Knutson B., Westdorp A., Kaiser E., Hommer D. (2000). FMRI visualization of brain activity during a monetary incentive delay task. NeuroImage, 12(1), 20–7. [DOI] [PubMed] [Google Scholar]
- Knutson B., Bhanji J.P., Cooney R.E., Atlas L.Y., Gotlib I.H. (2008). Neural responses to monetary incentives in major depression. Biological Psychiatry, 63(7), 686–92. [DOI] [PMC free article] [PubMed] [Google Scholar]
- Kohls G., Perino M.T., Taylor J.M., Madva E.N., Cayless S.J., Troiani V., et al. (2013). The nucleus accumbens is involved in both the pursuit of social reward and the avoidance of social punishment. Neuropsychologia, 51(11), 2062–9. [DOI] [PMC free article] [PubMed] [Google Scholar]
- Kumar P., Waiter G.D., Dubois M., Milders M., Reid I., Steele J.D. (2017). Increased neural response to social rejection in major depression. Depression and Anxiety, 34(11), 1049–56. [DOI] [PubMed] [Google Scholar]
- Kumari V., Mitterschiffthaler M.T., Teasdale J.D., Malhi G.S., Brown R.G., Giampietro V., et al. (2003). Neural abnormalities during cognitive generation of affect in treatment-resistant depression. Biological Psychiatry, 54(8), 777–91. [DOI] [PubMed] [Google Scholar]
- Kupferberg A., Bicks L., Hasler G. (2016). Social functioning in major depressive disorder. Neuroscience and Biobehavioral Reviews, 69, 313–32. [DOI] [PubMed] [Google Scholar]
- Lamm C., Singer T. (2010). The role of anterior insular cortex in social emotions. Brain Structure and Function, 214(5–6), 579–91. [DOI] [PubMed] [Google Scholar]
- Langenecker S.A., Kennedy S.E., Guidotti L.M., Briceno E.M., Own L.S., Hooven T., et al. (2007). Frontal and limbic activation during inhibitory control predicts treatment response in major depressive disorder. Biological Psychiatry, 62(11), 1272–80. [DOI] [PMC free article] [PubMed] [Google Scholar]
- Lee B.T., Seong W.C., Hyung S.K., Lee B.C., Choi I.G., Lyoo I.K., et al. (2007). The neural substrates of affective processing toward positive and negative affective pictures in patients with major depressive disorder. Progress in Neuro-Psychopharmacology & Biological Psychiatry, 31(7), 1487–92. [DOI] [PubMed] [Google Scholar]
- Lin A., Adolphs R., Rangel A. (2012). Social and monetary reward learning engage overlapping neural substrates. Social Cognitive and Affective Neuroscience, 7(3), 274–81. [DOI] [PMC free article] [PubMed] [Google Scholar]
- Lorenz J., Minoshima S., Casey K.L. (2003). Keeping pain out of mind: the role of the dorsolateral prefrontal cortex in pain modulation. Brain, 126(Pt 5), 1079–91. [DOI] [PubMed] [Google Scholar]
- Masten C.L., Eisenberger N.I., Borofsky L.A., Pfeifer J.H., McNealy K., Mazziotta J.C., et al. (2009). Neural correlates of social exclusion during adolescence: understanding the distress of peer rejection. Social Cognitive and Affective Neuroscience, 4(2), 143–57. [DOI] [PMC free article] [PubMed] [Google Scholar]
- Masten C.L., Eisenberger N.I., Borofsky L.A., McNealy K., Pfeifer J.H., Dapretto M. (2011). Subgenual anterior cingulate responses to peer rejection: a marker of adolescents’ risk for depression. Development and Psychopathology, 23(1), 283–92. [DOI] [PMC free article] [PubMed] [Google Scholar]
- Matthew B., Jean-Luc A., Romain V., Jean-Baptiste P. (2002). Region of interest analysis using the MarsBaR toolbox for SPM 99. NeuroImage, 16(2), S497. [Google Scholar]
- McCabe C., Cowen P.J., Harmer C.J. (2009). Neural representation of reward in recovered depressed patients. Psychopharmacology, 205(4), 667–77. [DOI] [PMC free article] [PubMed] [Google Scholar]
- McCabe C., Woffindale C., Harmer C.J., Cowen P.J. (2012). Neural processing of reward and punishment in young people at increased familial risk of depression. Biological Psychiatry, 72(7), 588–94. [DOI] [PubMed] [Google Scholar]
- McLaren D.G., Ries M.L., Xu G., Johnson S.C. (2012). A generalized form of context-dependent psychophysiological interactions (gPPI): a comparison to standard approaches. NeuroImage, 61(4), 1277–86. [DOI] [PMC free article] [PubMed] [Google Scholar]
- Mori A., Okamoto Y., Okada G., Takagaki K., Jinnin R., Takamura M., et al. (2016). Behavioral activation can normalize neural hypoactivation in subthreshold depression during a monetary incentive delay task. Journal of Affective Disorders, 189, 254–62. [DOI] [PubMed] [Google Scholar]
- Nitschke J.B., Sarinopoulos I., Mackiewicz K.L., Schaefer H.S., Davidson R.J. (2006). Functional neuroanatomy of aversion and its anticipation. NeuroImage, 29(1), 106–16. [DOI] [PubMed] [Google Scholar]
- Oldham S., Murawski C., Fornito A., Youssef G., Yucel M., Lorenzetti V. (2018). The anticipation and outcome phases of reward and loss processing: a neuroimaging meta-analysis of the monetary incentive delay task. Human Brain Mapping, 39(8), 3398–418. [DOI] [PMC free article] [PubMed] [Google Scholar]
- Phillips M.L., Drevets W.C., Rauch S.L., Lane R. (2003). Neurobiology of emotion perception II: implications for major psychiatric disorders. Biological Psychiatry, 54(5), 515–28. [DOI] [PubMed] [Google Scholar]
- Pizzagalli D.A. (2014). Depression, stress, and anhedonia: toward a synthesis and integrated model. Annual Review of Clinical Psychology, 10, 393–423. [DOI] [PMC free article] [PubMed] [Google Scholar]
- Pizzagalli D.A., Holmes A.J., Dillon D.G., Goetz E.L., Birk J.L., Bogdan R., et al. (2009). Reduced caudate and nucleus accumbens response to rewards in unmedicated individuals with major depressive disorder. The American Journal of Psychiatry, 166(6), 702–10. [DOI] [PMC free article] [PubMed] [Google Scholar]
- Ploghaus A., Becerra L., Borras C., Borsook D. (2003). Neural circuitry underlying pain modulation: expectation, hypnosis, placebo. Trends in Cognitive Sciences, 7(5), 197–200. [DOI] [PubMed] [Google Scholar]
- Poldrack R.A., Mumford J.A. (2009). Independence in ROI analysis: where is the voodoo? Social Cognitive and Affective Neuroscience, 4(2), 208–13. [DOI] [PMC free article] [PubMed] [Google Scholar]
- Rademacher L., Krach S., Kohls G., Irmak A., Grunder G., Spreckelmeyer K.N. (2010). Dissociation of neural networks for anticipation and consumption of monetary and social rewards. NeuroImage, 49(4), 3276–85. [DOI] [PubMed] [Google Scholar]
- Rizvi S.J., Pizzagalli D.A., Sproule B.A., Kennedy S.H. (2016). Assessing anhedonia in depression: potentials and pitfalls. Neuroscience & Biobehavioral Reviews, 65, 21–35. [DOI] [PMC free article] [PubMed] [Google Scholar]
- Rotge J.Y., Lemogne C., Hinfray S., Huguet P., Grynszpan O., Tartour E., et al. (2015). A meta-analysis of the anterior cingulate contribution to social pain. Social Cognitive and Affective Neuroscience, 10(1), 19–27. [DOI] [PMC free article] [PubMed] [Google Scholar]
- Rudolph K.D., Miernicki M.E., Troop-Gordon W., Davis M.M., Telzer E.H. (2016). Adding insult to injury: neural sensitivity to social exclusion is associated with internalizing symptoms in chronically peer-victimized girls. Social Cognitive and Affective Neuroscience, 11(5), 829–42. [DOI] [PMC free article] [PubMed] [Google Scholar]
- Schiller C.E., Minkel J., Smoski M.J., Dichter G.S. (2013). Remitted major depression is characterized by reduced prefrontal cortex reactivity to reward loss. Journal of Affective Disorders, 151(2), 756–62. [DOI] [PMC free article] [PubMed] [Google Scholar]
- Seminowicz D.A., Mayberg H.S., McIntosh A.R., Goldapple K., Kennedy S., Segal Z., et al. (2004). Limbic-frontal circuitry in major depression: a path modeling metanalysis. NeuroImage, 22(1), 409–18. [DOI] [PubMed] [Google Scholar]
- Sescousse G., Caldu X., Segura B., Dreher J.C. (2013). Processing of primary and secondary rewards: a quantitative meta-analysis and review of human functional neuroimaging studies. Neuroscience and Biobehavioral Reviews, 37(4), 681–96. [DOI] [PubMed] [Google Scholar]
- Setterfield M., Walsh M., Frey A.L., McCabe C. (2016). Increased social anhedonia and reduced helping behaviour in young people with high depressive symptomatology. Journal of Affective Disorders, 205, 372–7. [DOI] [PubMed] [Google Scholar]
- Silk J.S., Siegle G.J., Lee K.H., Nelson E.E., Stroud L.R., Dahl R.E. (2014). Increased neural response to peer rejection associated with adolescent depression and pubertal development. Social Cognitive and Affective Neuroscience, 9(11), 1798–807. [DOI] [PMC free article] [PubMed] [Google Scholar]
- Sliz D., Hayley S. (2012). Major depressive disorder and alterations in insular cortical activity: a review of current functional magnetic imaging research. Frontiers in Human Neuroscience, 6, 323. [DOI] [PMC free article] [PubMed] [Google Scholar]
- Smoski M.J., Felder J., Bizzell J., Green S.R., Ernst M., Lynch T.R., et al. (2009). fMRI of alterations in reward selection, anticipation, and feedback in major depressive disorder. Journal of Affective Disorders, 118(1–3), 69–78. [DOI] [PMC free article] [PubMed] [Google Scholar]
- Smoski M.J., Rittenberg A., Dichter G.S. (2011). Major depressive disorder is characterized by greater reward network activation to monetary than pleasant image rewards. Psychiatry Research, 194(3), 263–70. [DOI] [PMC free article] [PubMed] [Google Scholar]
- Snaith R.P., Hamilton M., Morley S., Humayan A., Hargreaves D., Trigwell P. (1995). A scale for the assessment of hedonic tone the Snaith-Hamilton pleasure scale. The British Journal of Psychiatry, 167(1), 99–103. [DOI] [PubMed] [Google Scholar]
- Spielberger C.D., Gorsuch R.L., Lushene R.E., Vagg P.R., Jacobs G.A. (1983). Manual for the State-Trait Anxiety Inventory, Palo Alto, CA: Consulting Psychologists Press. [Google Scholar]
- Spreckelmeyer K.N., Krach S., Kohls G., Rademacher L., Irmak A., Konrad K., et al. (2009). Anticipation of monetary and social reward differently activates mesolimbic brain structures in men and women. Social Cognitive and Affective Neuroscience, 4(2), 158–65. [DOI] [PMC free article] [PubMed] [Google Scholar]
- Stoodley C.J., Valera E.M., Schmahmann J.D. (2012). Functional topography of the cerebellum for motor and cognitive tasks: an fMRI study. NeuroImage, 59(2), 1560–70. [DOI] [PMC free article] [PubMed] [Google Scholar]
- Stoy M., Schlagenhauf F., Sterzer P., Bermpohl F., Hagele C., Suchotzki K., et al. (2012). Hyporeactivity of ventral striatum towards incentive stimuli in unmedicated depressed patients normalizes after treatment with escitalopram. Journal of Psychopharmacology, 26(5), 677–88. [DOI] [PubMed] [Google Scholar]
- Straube T., Schmidt S., Weiss T., Mentzel H.J., Miltner W.H. (2009). Dynamic activation of the anterior cingulate cortex during anticipatory anxiety. NeuroImage, 44(3), 975–81. [DOI] [PubMed] [Google Scholar]
- Thomas E.J., Elliott R., McKie S., Arnone D., Downey D., Juhasz G., et al. (2011). Interaction between a history of depression and rumination on neural response to emotional faces. Psychological Medicine, 41(9), 1845–55. [DOI] [PubMed] [Google Scholar]
- Torrubia R., Avila C., Molto J., Caseras X. (2001). The sensitivity to punishment and sensitivity to reward questionnaire (SPSRQ) as a measure of Gray’s anxiety and impulsivity dimensions. Personality and Individual Differences, 31(6), 837–62. [Google Scholar]
- Ubl B., Kuehner C., Kirsch P., Ruttorf M., Diener C., Flor H. (2015). Altered neural reward and loss processing and prediction error signalling in depression. Social Cognitive and Affective Neuroscience, 10(8), 1102–12. [DOI] [PMC free article] [PubMed] [Google Scholar]
- Uddin L.Q. (2015). Salience processing and insular cortical function and dysfunction. Nature Reviews Neuoscience., 16(1), 55–61. [DOI] [PubMed] [Google Scholar]
- Wang H., Braun C., Enck P. (2017). How the brain reacts to social stress (exclusion)—a scoping review. Neuroscience and Biobehavioral Reviews, 80, 80–8. [DOI] [PubMed] [Google Scholar]
- Wilson R.P., Colizzi M., Bossong M.G., Allen P., Kempton M., Bhattacharyya S. (2018). The neural substrate of reward anticipation in health: a meta-analysis of fMRI findings in the monetary incentive delay task. Neuropsychology Review, 28(4), 496–506. [DOI] [PMC free article] [PubMed] [Google Scholar]
- Xie H., Jiang D., Zhang D. (2018). Individuals with depressive tendencies experience difficulty in forgetting negative material: two mechanisms revealed by ERP data in the directed forgetting paradigm. Scientific Reports, 8(1), 1113. [DOI] [PMC free article] [PubMed] [Google Scholar]
- Zar J.H. (1996). Biostatistical Analysis, Upper Saddle River: Prentice-Hall. [Google Scholar]
- Zhang W.N., Chang S.H., Guo L.Y., Zhang K.L., Wang J. (2013). The neural correlates of reward-related processing in major depressive disorder: a meta-analysis of functional magnetic resonance imaging studies. Journal of Affective Disorders, 151(2), 531–9. [DOI] [PubMed] [Google Scholar]
- Zung W.W., Richards C.B., Short M.J. (1965). Self-rating depression scale in an outpatient clinic. Further validation of the SDS. Archives of General Psychiatry, 13(6), 508–15. [DOI] [PubMed] [Google Scholar]
Associated Data
This section collects any data citations, data availability statements, or supplementary materials included in this article.