Abstract
Plant colors such as ‘green leaf’ and ‘red apple’ are often described based on human sense, even in scientific papers. On the other hand, colors are measured based on colorimetric principles in some papers, especially in the studies of horticultural plants. The science of color measurements (‘colorimetry’) is not included in any of the popular lectures in schools and universities, thus the principles of color measurements would not be understood by most researchers. The present review will overview the principles of colorimetry, and will introduce colorimetric methods which can be used for scientific measurement of plant colors. That is to say, the reflection spectrum of visible light (380–780 nm) is measured at 5-nm intervals on the surface of leaves or petals in ‘Spectrometric Color Measurement’ (SCM). The spectral data is multiplied with RGB or XYZ color matching functions and integrated to obtain RGB or XYZ intensities. Alternatively, approximate RGB values are directly obtained in ‘Photographic Color Measurement’ (PCM). RGB/XYZ intensities are further calculated to obtain ‘hue’, ‘saturation’, and ‘lightness’, the three factors of colors. Colorimetric insights into genetic regulations (such as MYB gene) and physiological regulations (such as alexandrite effect) of plant colors are also described.
Keywords: alexandrite effect, color, dichromatism, flower, hue
We humans are sometimes unaware of the importance of things around ourselves. Researchers of plant sciences are usually aware of the importance of plant colors, but they would have not been so much interested in scientific methods or principles to measure plant colors. Whereas, considering the limitations in human sense of judging colors and variable accuracy in color measurement between different methods, we are recommended to understand the principles of color measurements, proper methods for color measurements, and various factors affecting colors, before description of plant colors in academic papers. In the present review, we will start with the nomenclature then the principles of colorimetry (color measurements and calculations), and proceed to colorimetric overview/meta-analysis of various plants and their genetic or physiological regulations. Part of the figures/tables may be printed black and white, but the readers are recommended to download color version of the present review from website (http://www.jspcmb.jp/english/sub04.html).
Nomenclature in colorimetry
‘Colorimetry’ (color measurement) is a unique field of natural science, supported by special words and phrases. It will be necessary to introduce basic words and phrases before starting the story. ‘Hue’ is the type of colors, such as red, green and blue. Hue is applicable only to ‘chromatic’ (vivid) colors. Chromatic colors are the colors except for ‘achromatic’ colors, which are white, gray, and black without vividness. The degree how the color is chromatic (vivid) is expressed by ‘saturation’ (vividness). Achromatic colors are 0% saturated (saturation level of 0%). Completely vivid colors such as pure red and pure blue are 100% saturated. Intermediately vivid colors such as pale orange and grayish green have intermediate values of saturation. ‘Lightness’ represents brightness of colors. Pure white has full (100%) lightness value, and pure black has no (0%) lightness value. The other colors have intermediate lightness values. It will be important to remember that all colors can be expressed by these three factors (hue, saturation, and lightness). Then, color measurement is the process where colors of objects are measured and calculated to obtain the values of their hue, saturation, and lightness. A line of calculations is ‘color calculations’, and a range of values related to colors is ‘color values’. Numerical relationship between specific colors, hue values, saturation values, and lightness values will be also explained later in this section.
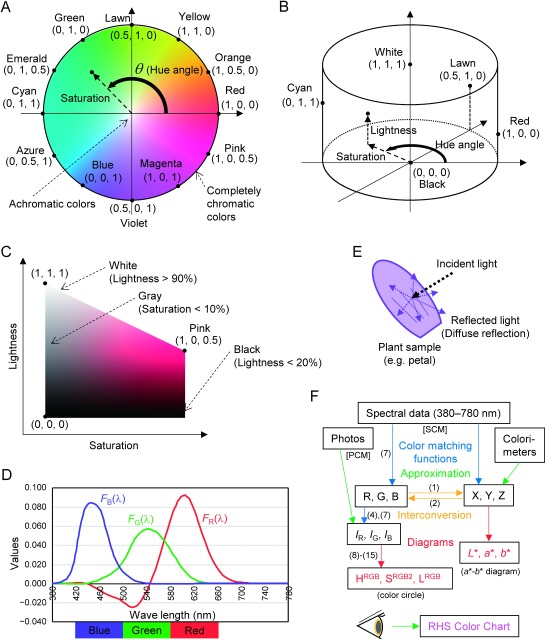
Because colors are expressed by the values of hue, saturation, and lightness, colorimetry uses mathematical expressions and calculations. In mathematics, dimensions are expressed as point (0 dimensions), line (1 dimension), plate (plain; 2 dimensions), and space (3 dimensions). Therefore, colors are plotted on ‘color plate’ when they are expressed by two values (e.g., x and y), and colors are plotted in ‘color space’ when they are expressed by three values (e.g., x, y, and z). For example, on color plate, colors are plotted within a specific area. The shape of this area is variable according to the formulae used, but the ideal shape of this area for classification of all colors should be the ‘color circle’. The color circle is illustrated in Figure 1A. Here, all colors are plotted on a circle. All achromatic colors are on the ‘origin’ (the center of the circle). Completely chromatic colors are on the edge of the circle. Chromatic colors have ‘hue angles’, which are the angles between the plus part of the x axis and the line connecting between the origin and chromatic colors. The distance between chromatic colors and the origin represents saturation. Thus, all colors are plotted on color circle according to their hue and saturation values. Hue values are always expressed by angles. Hue angles of representative 12 colors are as follows: red (0°), orange (30°), yellow (60°), lawn (90°), green (120°), emerald (150°), cyan (180°), azure (210°), blue (240°), violet (270°), magenta (300°), and pink (330°). Similar colors are collectively expressed by adding ‘ish’ on the tail of words: ‘reddish’ colors are pink, red, and orange; ‘yellowish’ colors are orange, yellow, and lawn (yellow-green); ‘cyanic’ colors are emerald, cyan, and azure; ‘greenish’, ‘bluish’, and ‘pinkish’ in the same manner. ‘Purplish’ colors are magenta and violet: ‘purple’ is reddish violet but bluer than magenta. Colors are actually calculated and plotted on ‘(color) diagram(s)’, such as ‘xy diagram’ and ‘a*–b* diagram’. True color circle cannot be derived from spectral data, but ‘round diagram’ mimics (is nearly identical to) the color circle. This is why the round diagram is also expressed as color circle. ‘Coordinates’ are ‘axes’, such as ‘xy coordinates’.
Figure 1. Schematic representation of colorimetric calculations. (A) Color circle. The 12 representative colors are evenly placed on the edge of color circle. Standardized R, G, and B values (IR, IG, and IB) in RGB color system of the 12 colors are in parentheses. Please note that the values of cyanic colors only reflect color angles: fully saturated cyanic colors have more complicated values with negative red values. (B) Color cylinder. Values of red, green, and blue of representative colors are in parentheses. (C) Cut plain of the color cylinder, at pink-hued colors. Values of red, green, and blue, of representative colors are in parentheses. (D) Standardized RGB color matching function. Approximated blue, green, and red color areas are indicated at the bottom. (E) Diffuse reflection on plant surface. (F) Flow of color calculations. Numbers in parentheses represent numbers of formulae in the text. ‘Photos’ represent color data obtained by digital camera, which is the start point of PCM. ‘Spectral data’ represent data acquired by spectrophotometer, which is the start point of SCM.
Among various colors, red, green, and blue (RGB) is the three ‘primary colors’: many parts of the colors can be regenerated by the mixture of these colors. Then, ‘RGB color’ is a kind of ‘color system’ where colors are expressed by the proportions of red, green, and blue colors. RGB colors are shown for representative colors in Figure 1A–C, for reference. In addition to RGB color system, there is also ‘XYZ color system’. ‘L*a*b* color system’ is further derived (calculated) from XYZ color system to change the shape of the area on color plate.
As you will have noticed, color plate only shows hue and saturation, and lacking the information of lightness. Instead of color plate, color space includes all information of colors. If adding lightness information to color circle, it forms a color cylinder with the z axis representing lightness (Figure 1B). Black is plotted at the bottom of the cylinder, and white is at the top. Completely vivid colors are on the side wall. As an example, the plate of pinkish colors within the color cylinder (hue angle of 330°) is shown in Figure 1C. Pure white and pure black are certainly plotted on the top or on the bottom of the left-side edge in this figure respectively. On the other hand, our sense of achromatic colors is wider. It seems reasonable to define that colors with the lightness values of more than 90% are white, and colors with the lightness values of less than 20% are black. Similarly, except for white and black, colors with the saturation values of less than 10% look gray, rather than showing distinguishable pink hue. The same classification of achromatic colors could be adopted in the other hues.
There are also other mathematical expressions. ‘Function(s)’ represents ‘formula(e)’ or ‘equation(s)’. ‘Color matching function(s)’ are used to convert spectral data of visible light to RGB or XYZ values. Values of the ‘standardized RGB color matching functions’ are shown in Figure 1D for reference. These functions show how we humans detect colors of visible lights. ‘Value(s)’ are figures or amounts or sizes. Colorimetry uses functions like ‘min()’, which represents the minimum value of all values in parentheses, and ‘Σ’, which represents summation (integration). ‘Trigonometric functions’ used are ‘sin’ (sine), ‘cos’ (cosine), and ‘arctan2’. ‘arctan2’ is a ‘reverse function’ of ‘tan’ (tangent), and the output value of angle is given by ‘degrees’ (°) instead of ‘radian’.
We will finally check the phrases related to visible light. ‘Visible light’ is ‘electromagnetic wave’ between the ‘wave lengths’ of 380 nm and 780 nm. Color is generated by visible light, then the spectrum of the visible light coming from (emitted by, transmitted by, or reflected by) the object matters. Visible light is reflected by mirrors by ‘specular reflection’, but visible light is reflected on the surface of plants by ‘diffuse reflection’. Light is randomly reflected or refracted around the surface of object, then diffuse-reflected light is visible from any direction. Diffuse reflection is illustrated in Figure 1E. ‘Reflectance’ represents the ratio of reflection. ‘Reflectance spectrum (spectra)’ can be measured by using UV/VIS ‘spectrophotometer’ such as UV-2450 (Shimadzu, Kyoto, Japan). In colorimetry, light spectrum is expressed by a unit called ‘spectral power distribution’, which represents light energy per illuminated area per wave length (W m−2 nm−1). Visible-light spectra of ‘incident light’ (light source) such as ‘sunlight’, ‘fluorescent light’, ‘incandescent light’, and ‘white LED’ (white-colored light-emitting diode) light can be readily measured by using equipment such as MS-720 spectroradiometer (EKO Instruments, Tokyo, Japan). ‘Beer-Lambert law’, ‘absorbance’, ‘transmittance’ (ratio of transmission), and ‘transmittance spectrum (spectra)’ are also related when discussing the effect of pigment concentrations on its colors.
Figure 1F illustrates the flow of color calculations. Visible light spectra are converted to RGB or XYZ values by using RGB color matching functions (r(λ), g(λ), and b(λ)) or XYZ color matching functions (x(λ), y(λ), and z(λ)), where ‘λ’ represents wave length. XYZ values were generated from RGB values (Commission Internationale de l’Éclairage 2004), as in the following formulae (1):
 |
(1) |
XYZ values can be also converted to RGB values (Kasajima 2017):
 |
(2) |
L*a*b* values are calculated from XYZ, whereas HRGB, SRGB2, and LRGB for drawing round diagram (color circle) are derived from RGB values. These calculations are performed by using several formulae respectively. ‘RHS Color Chart’ is released by ‘Royal Horticultural Society’ (RHS) of Britain. This color chart is intended to directly compare plant colors with hundreds of sample colors by human eyes: RHS Color Chart colors are not numerically linked to visible light spectra. ‘CIE’ (Commission Internationale de l’Éclairage: International commission on Illumination) has developed or edited most color systems including RGB and XYZ.
This will cover all basic part of colorimetry, but unclear points should be asked to the author.
Color spaces
Measurement of plant colors is performed in the same way as the other substances (Commission Internationale de l’Éclairage 2004; Kasajima 2018a, 2018b). ‘Color’ in the narrow sense is the same as hue. ‘Color’ in a broad sense includes additional two axes, ‘saturation’ and ‘lightness’, forming color space. Existence of many different color spaces will make colorimetry difficult (e.g., Commission Internationale de l’Éclairage 2004). Different color spaces and diagrams (or color circles) have different values of the axes. L*a*b* color space and its a*–b* diagram are often used by researchers, although the disadvantage of this diagram is that the shape of diagram is far from circle, and hue angles are not evenly distributed. We cannot even tell hue names (red, yellow, ...) from L*a*b* values. This will be a great disadvantage of a*–b* diagram (Kasajima and Fekih 2017). Thus, utilization of round diagram and its color space makes color measurement easy and understandable: round diagram is nearly identical to color circle (Kasajima 2016). We would recommend plotting colors on the round diagram (color circle) rather than on the distorted a*–b* diagram. The 12 colors of round diagram (Figure 1A) will help to describe plant colors correctly. Principles and methods of color measurement will be introduced based on round diagram in the present review. In the meantime, plant colors are often visually compared with RHS Color Chart as well. RHS Color Chart consists of 812 standard colors, forming a pseudo color space, although their colors are not linked to spectral data or hue angles. It is also questionable whether it is scientific (strict) to directly compare plant colors with color chart by human eyes. Mathematical relationship between a*–b* diagram, round diagram, and RHS Color Chart is not reported, then this should be analyzed in the future to facilitate plant colorimetry.
Visible light and color matching function
Visible light is a specific range of electromagnetic wave (380–780 nm) as already explained. Different wave lengths have different colors, but all short waves (<440 nm) are blue and all long waves (>640 nm) are red. Extremely short waves (<420 nm) and extremely long waves (>660 nm) are less visible than the intermediate waves. Then, greatly simplifying the light colors, 420–500 nm is blue, 500–580 nm is green, and 580–660 nm is red (Figure 1D; Kasajima 2016, 2018a). Color of each wave length is strictly defined by the mixture of standard red, green, and blue (RGB) lights. This relationship is summarized as RGB color matching functions (r(λ), g(λ), and b(λ); Commission Internationale de l’Éclairage 2004). RGB color matching functions have values at 5 nm intervals. They are standardized (normalized) to obtain standardized RGB color matching functions (FR(λ), FG(λ), and FB(λ)), so that each function sum to 1, when adding all values from 380 nm to 780 nm (Figure 1D; Kasajima and Sasaki 2015):
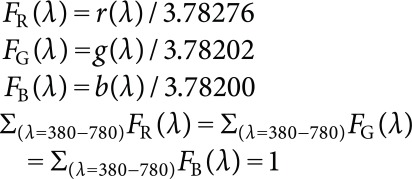 |
(3) |
This also means that standardized RGB values (IR, IG, and IB) are calculated from the original RGB values as follows:
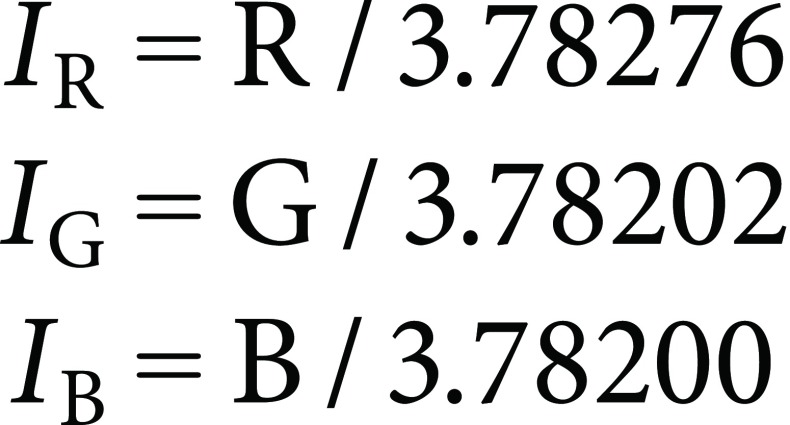 |
(4) |
Data of standardized (normalized) RGB color matching functions are available in a reference (Kasajima and Sasaki 2015). Color matching functions are also available on the web (http://kasajima.sakura.ne.jp/color-data). The XYZ color matching functions, another color system released by CIE, adopts imaginary colors (X, Y, and Z) to avoid having negative data. This system was widely accepted, but we would recommend using simpler RGB system for easier and clearer understanding of colors.
Here, the nomenclature of ‘blue’ light must be discussed. Short waves are called ‘blue’ in colorimetry, but they used to be called ‘violet’. This fact is evident because light waves shorter than visible light is named ‘ultraviolet’. The short waves are actually violet or blue-violet rather than pure blue. Any media (print or display) cannot regenerate true colors. You can see true colors by using ‘diffractive grating’ such as Simple Spectroscope MJ (Kenis, Osaka, Japan). Short waves are also named ‘blue’ in RGB color system and round diagram (color circle), but we have to remember that the ‘blue’ color in colorimetry is not the true blue.
Calculation of color values
Light spectrum (Spec(λ)) is measured as spectral power distribution in colorimetry, preferably with 5-nm intervals at 380–780 nm (values at 380 nm, 385 nm, 390 nm, ..., 780 nm). In plant colorimetry, Spec(λ) is often obtained by multiplication of incident light spectra (L(λ)) with transmittance spectra of ‘transparent’ solutions (T(λ)) or reflectance spectra of ‘opaque’ objects (R(λ)):
 |
(5) |
Transmittance spectra of pigment solutions are calculated from absorbance spectra (Abs(λ)) as follows:
 |
(6) |
Spec(λ) is integrated with standardized RGB color matching functions to obtain the intensities of red, green, and blue colors within the spectrum (IR, IG, and IB), where IR, IG, and IB values approximately ranges from 0 to 1:
 |
(7) |
Thus, intensities of red, green, and blue colors could be obtained for any plant sample.
Lightness of the round diagram (LRGB) is defined as the sum of IR, IG, and IB, which ranges from 0 to 3:
 |
(8) |
Proportions between IR, IG, and IB (ρ, γ, and β) are further calculated. Sum of ρ, γ, and β is always 1:
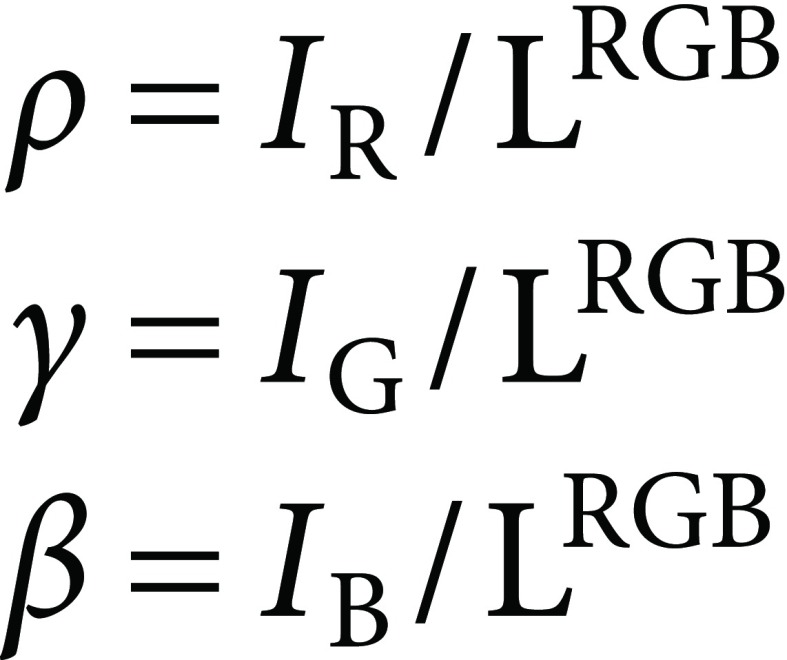 |
(9) |
 |
(10) |
These values are the sizes of the triangular coordinate of the vectors R(1, 0),  , and
, and  , representing red, green and blue colors (Kasajima 2016). Saturation of the color is represented by chromatic part of ρ, γ, and β. Red, green, and blue are mixed to form white (achromatic). The other part is chromatic. Then, chromatic portion is calculated as:
 |
Considering formula (10), roughly estimated saturation (SRGB) is:
 |
(11) |
For calculation of hue angles, coordinate of the above vector on color plate is:
 |
Hue of the round diagram (HRGB) is then calculated from this coordinate:
 |
(12) |
HRGB is given as hue angles from 0 to 360°. HRGB perfectly matches the angles of color circle, however SRGB values are quite variable within the hue angles from 120 to 240° (cyanic colors; Kasajima 2016). SRGB values are around 1 in the other hue angles, but they reach as high as 5 around 160°. Such extraordinary large SRGB values of cyanic colors are caused by round (irregular) shape of the plot area of visible light: highly saturated cyanic colors cannot be regenerated by simple mixture of blue and green. The distorted shape of SRGB spectrum is adjusted by using a ‘polynomial function’ (6th degree) of HRGB called ‘approximated saturation of saturated cyanic colors’ (ASSCC(HRGB); Kasajima 2016):
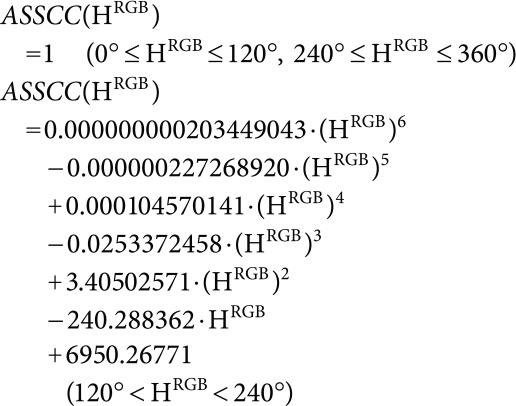 |
(13) |
ASSCC(HRGB) approximates SRGB values as the function of HRGB. Then, the corrected saturation value (SRGB2) is calculated:
 |
(14) |
SRGB2 (not SRGB) is used as the saturation value of the round diagram. SRGB2 approximately ranges from 0 to 1. Hue angle and saturation value have been calculated (see Figure 1A), then coordinates on round diagram are simply calculated as:
 |
(15) |
This (r, d) coordinate is used for the purpose of plotting calculated colors on color circle. We would like to call the above calculation system based on spectrometry as ‘Spectrometric Color Measurement’ (SCM) in the present review. Examples of SCM calculations are also in previous reports (Kasajima 2016; Kasajima and Sasaki 2015).
Alternative color measurement by photographs
SCM is the only method to measure accurate colors. On the other hand, measurement of light spectrum with spectrophotometer is not always performable. Approximate measurement of plant colors by taking photographs with digital cameras is much faster and easier without destruction of plant samples. Although colors recorded by digital cameras are not necessarily accurate, photograph-based measurement provides much information about plant colors. Then, ‘Photographic Color Measurement’ (PCM) can be performed in a similar way to SCM. IR, IG, and IB values are simply extracted from RGB colors of photographs by using graphic software in PCM. Because all hues are already normalized in photographs, the calculated SRGB value is equal to SRGB2 in PCM.
As an example of PCM, color values were calculated from plant photographs (Table 1). All these photographs were taken around the Ueda campus of Iwate University, Morioka, Japan (39°42′N, 141°9′E) before the noon in a slightly cloudy day (September 4, 2018). The spectrum of light source would be stable under such a condition, without causing colorimetric effects such as alexandrite effect (later described). In Table 1, photographs are sorted according to hue angles of plants as follows: geranium flower, withered inflorescence of sorrel, sulfur cosmos, cutleaf coneflower, yellow chrysanthemum, immature fruit of Chinese quince, leaf of Japanese mugwort, taro leaf, cyan fruit of wild grape, flower of garlic chive, Asiatic dayflower, blue fruit of wild grape, bluejacket, petunia, thistle, rose, plumed cockscomb, and pink chrysanthemum. Colors of the photographs were calculated and expressed by the 12 hue names of round diagram in Table 1.
Table 1. PCM values of plants.
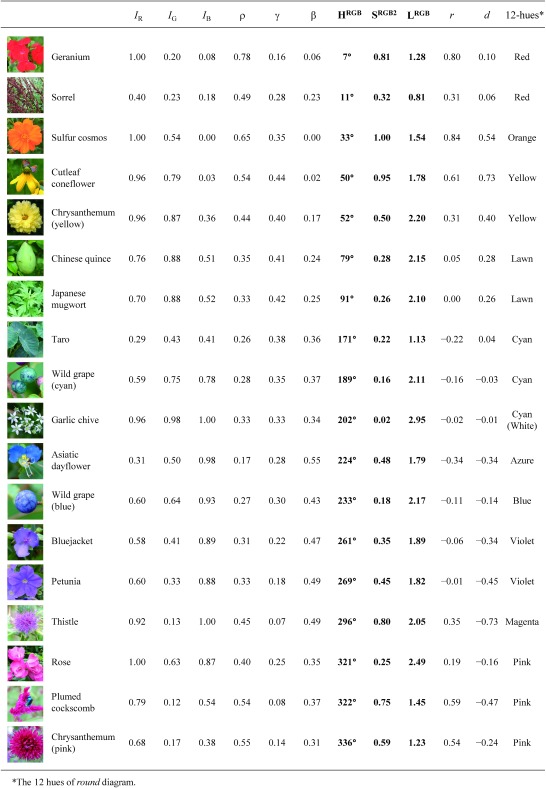 |
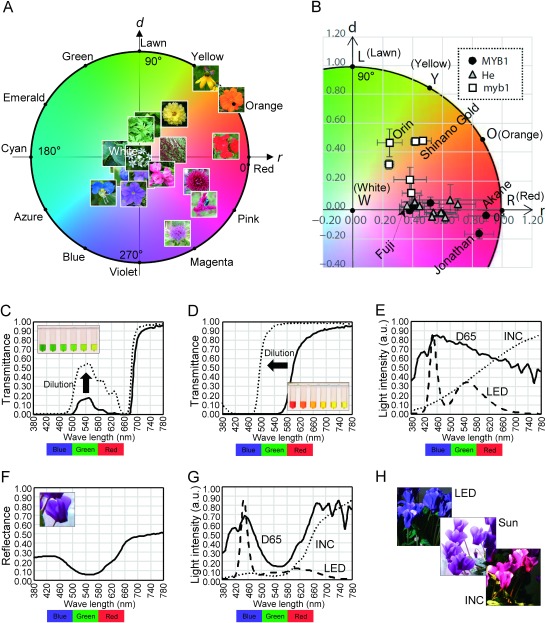
Many of the hue names will seem consistent with photographs in Table 1, but PCM more precisely classifies colors than we humans. For example, the color of sorrel is ‘brown’ to us, but its hue is red in PCM. There is also variation in the color of ‘green’ leaves, between lawn and cyan. This will be because of the ‘dichromatism’ (later described) of the mixture of chlorophylls and carotenoids (Kasajima and Sasaki 2015). Garlic chive is ‘white’, but its hue is cyan. The color of this flower will be actually white, because the lightness is quite high (2.95; 98% of the maximum value). Asiatic dayflower is azure, and blue wild grape is blue. The color of Asiatic dayflower will be a typical blue. Considering that the ‘blue’ color in colorimetry is actually blue-violet, ‘blue’ color in a general sense will be the hues between cyan and blue (180–240°). The same photographs were also plotted on color circle (Figure 2A). Yellow color of cutleaf coneflower and orange color of sulfur cosmos are nearly completely saturated. This is due to clear discrimination in absorbance of visible lights by carotenoid pigments (Kasajima and Sasaki 2015; e.g., Figure 2D). Green and blue plant colors are not so much saturated, probably because chlorophylls and bluish anthocyanins do not show strong discrimination in light absorbance (e.g., Figure 2C, 2F). Pink color of plumed cockscomb is highly saturated, indicating that betacyanin has clear discrimination of light absorbance. Saturation levels of reddish anthocyanins also look high in many cases. Brown color of withered sorrel would be caused by polyphenols. Colors of yellow betaxanthin and yellow flavonoid are not included in this figure.
Figure 2. Examples of plant colorimetry. (A) Plot of the plant colors measured in Table 1. Photographs are plotted on round diagram according to their colors. (B) Colors of apple fruits plotted on round diagram (cited from Kikuchi et al. 2017). ‘MYB1’ represents apple cultivars having wild-type MYB1 gene, ‘myb1’ represents cultivars having mutated MYB1 gene, and ‘He’ represents cultivars with heterozygous MYB1 gene. Five representative cultivars are indicated by their names such as ‘Fuji’. Cultivar ‘Jonathan’ is called ‘Kohgyoku’ (red ball) in Japan. (C) Transmittance spectra of a cherry leaf pigment, at different concentrations. Inlet, serial dilution (from left to right) of this pigment. (D) Transmittance spectra of a saffron spice (dried saffron pistil) pigment, at different concentrations. Inlet, serial dilution (from left to right) of this pigment. (E) Spectra of D65, incandescent light (INC), and white LED light (LED). ‘Light intensity’ represents spectral power distribution shown by arbitrary unit. (F) Reflectance spectrum of a purple cyclamen petal. Inlet, photograph of purple cyclamen taken in sunlight. (G) Spectra of the lights reflected on the purple cyclamen petal, under different incident lights D65, incandescent light (INC), or white LED light (LED). ‘Light intensity’ represents spectral power distribution shown by arbitrary unit. (H) The ‘purple’ cyclamen flowers photographed in while LED light (LED), midday sunlight (Sun), or incandescent light (INC).
Genetic regulation of plant colors
If plant colors can be analyzed by colorimetry, how can we describe the functions of genes on plant colors? Or inversely, what kind of genetic mutations can we deduce from changes in plant colors? Engineering of plant colors through genetic modifications and natural mutations is also an important goal of molecular breeding. Then, we summarized color data in previous reports of plant biotechnology and genetics. Colorimetric measurement enables objective description of plant colors. Interestingly, such objective colors are often different from our subjective description of plant colors. Representative genes which regulate plant colors are listed in Table 2, together with original and modified hues. In this table, colors of petals, fruits, seed coats, or sepals were measured by PCM of the photographs in reference papers. Colors with lightness values less than 20% were named black, and colors with lightness values greater than 90% were named white. The other colors were named according to the 12 hues of round diagram.
Table 2. PCM values of genetically modified or mutated plants: meta-analysis.
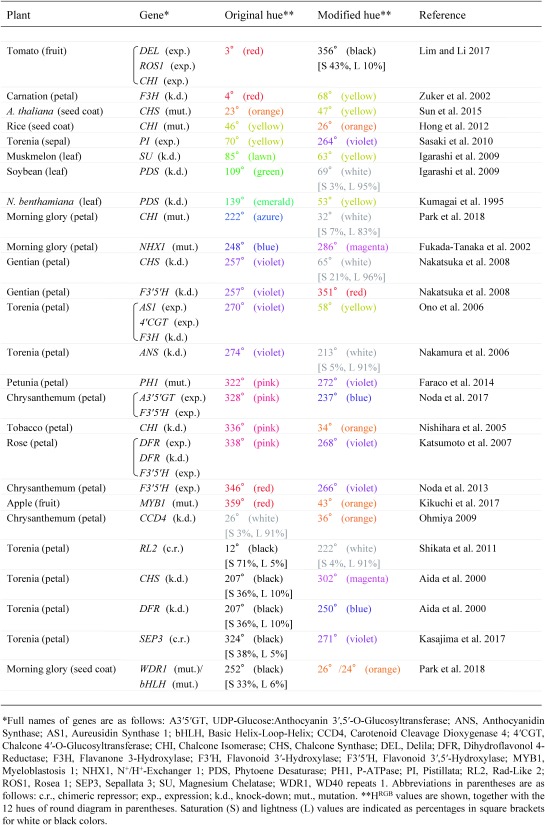 |
Many genes are reported to change reddish/purplish (red, pink, magenta, or violet) petal colors. Reddish petal colors become pale yellow or orange when anthocyanin synthesis is blocked by knocking down the expressions of the enzymes for flavonoid synthesis such as F3H and CHI (Nishihara et al. 2005; Zuker et al. 2002; Abbreviations of gene names are summarized in the footnote of Table 2). On the contrary, vivid yellow color is generated when AS1 and 4′CGT are expressed for aurone synthesis, together with suppression of F3H expression (Ono et al. 2006). Petal colors can even become white when CHS or ANS expression is suppressed (Nakamura et al. 2006; Nakatsuka et al. 2008). Skin color of apple fruit is regulated by the MYB1 gene, which is a transcription factor functioning for anthocyanin synthesis (Takos et al. 2006). Apple cultivars with wild-type MYB1 bear red fruits, whereas apple cultivars with mutated MYB1 bear yellow or orange fruits (Kikuchi et al. 2017). Skin colors measured by PCM of 21 apple cultivars are plotted on color circle in Figure 2B, for demonstration of the effect of MYB1 mutation on apple skin color. Dark orange color of the seed coat of Arabidopsis thaliana becomes light yellow upon mutation of CHS (Sun et al. 2015), and yellow color of the seed coat of rice becomes orange upon mutation of CHI (Hong et al. 2012). It will be noteworthy that the color of seed coat is related to the resistance to fungal pathogens, because part of flavonoid species acts as phytoalexin (Hasegawa et al. 2014; Ibraheem et al. 2010; Skadhauge et al. 1997).
The petal color of a model cultivar ‘Crown Violet’ of torenia is black. The hue of this flower is not clear (variable) in PCM, but the hue estimated by SCM is magenta (Kasajima et al. 2017). This cultivar generates differently colored petals according to the genes suppressed by genetic transformation. Petal color stays magenta when CHS is suppressed, but the color becomes blue when DFR is suppressed (Aida et al. 2000). This difference in hue is explained by co-pigmentation of anthocyanin with flavones. The hue becomes violet by expression of a ‘chimeric repressor’ (transcription activator protein which is artificially combined with ‘repression domain’ peptide; e.g., Jang and Li 2018; Shin et al. 2017) of SEP3 transcription factor encoding a class E MADS-box protein (Kasajima et al. 2017). This genetic modification only seems to reduce anthocyanin content in the petal, but dichromatism of purple anthocyanin makes the hue more bluish. The petal color of this cultivar also becomes white when a chimeric repressor of RL2 transcription factor is expressed (Shikata et al. 2011). What is more, the yellow sepal of this torenia becomes violet when a PI gene is expressed (Sasaki et al. 2010). This is due to partial transition of cell identity from sepal to petal through expression of this class B MADS-box protein.
Morning glory is another model system of flower genetics. Analysis of the mutants of morning glory revealed that azure or violet petals become white by mutations in any of the enzymes CHS, CHI, DFR, and ANS, along with the transcription factors WDR and bHLH (Park et al. 2018). For example, PCM hue of the petal of CHI mutant is orange (32°; Table 2). Lightness is only 83%, but this color is white (or gray) rather than orange, because the saturation is as low as 7%. In addition to petal colors, mutations in WDR1 or bHLH also changes black color of seed coat to orange. This is because these transcription factors regulate synthesis of both phytomelanin and proanthocyanidin, as well as the synthesis of anthocyanin (Park et al. 2018).
Bluish anthocyanin colors are generated by enzymatic or chemical modifications of reddish anthocyanin (Nishihara and Nakatsuka 2011). Thus, blue petal of morning glory changes to magenta when NHX1, a regulator of vacuolar pH, is disrupted (Fukada-Tanaka et al. 2000), and violet petal of gentian changes to red when F3′5′H, an enzyme for anthocyanin modification, is suppressed (Nakatsuka et al. 2008). On the contrary, pink petal of petunia becomes violet when PH1 (P-ATPase) is mutated (Faraco et al. 2014). Pink or red petals can be engineered to more bluish colors when the enzymes for anthocyanin modifications are expressed by genetic transformation. Red petal of chrysanthemum becomes violet when F3′5′H is expressed (Noda et al. 2013). Pink petal of rose was also changed to violet when F3′5′H was expressed, together with expression and suppression of specific DFR genes (Katsumoto et al. 2007). More strikingly, pink petal of chrysanthemum was changed to blue (HRGB=237°) through simultaneous expression of F3′5′H and A3′5′GT (Noda et al. 2017). Black fruit of tomato was generated from red fruit through simultaneous expression of DEL, ROS1, and CHI (Lim and Li 2017).
A unique change of plant color was observed when CCD4 was mutated in chrysanthemum (Ohmiya 2009). In this report, white petal was changed to vivid orange. This modification of flower color happens because CCD4 is involved in carotenoid degradation. Finally, changes in leaf colors are good indicators of virus-induced gene silencing (VIGS). For example, VIGS of the PDS gene changes dark-emerald color of the leaf of Nicotiana benthamiana to white (Kumagai et al. 1995), and VIGS of the SU gene makes lawn color of muskmelon leaf to yellow (Igarashi et al. 2009). Thus, time and place of VIGS within the plant body is visualized by colorimetric changes in plants. Among many virus vectors, apple latent spherical virus (ALSV) has the widest host range together with tobacco rattle virus (TRV), and has caused thorough whitening or yellowing of leaves through VIGS in N. benthamiana, N. tabacum, N. occidentalis, N. glutinosa, tomato, A. thaliana, cucumber, muskmelon, soybean, apple, pear, apricot, and strawberry (Dommes et al. 2019; Igarashi et al. 2009; Kawai et al. 2014; Li et al. 2019; Sasaki et al. 2011).
Physiological effects on plant colors
There are also physiological and colorimetric effects on plant colors. Deficiency of mineral nutrients causes different colorimetric effects on plant leaves (Jeyalakshmi and Radha 2017; McCauley et al. 2011). Nitrogen deficiency and iron deficiency both cause chlorosis, the color change from green to yellow-green or yellow. Chlorosis is also observed under sulfur deficiency, chlorine deficiency, boron deficiency, zinc deficiency, magnesium deficiency, and manganese deficiency. Chlorotic symptoms are somewhat different between nutrients. Nitrogen deficiency causes even de-coloration of leaves, whereas iron deficiency often generates stripe pattern. Phosphorus deficiency generates dark-green or purplish leaves, and potassium deficiency generates white spots. Because nitrogen is the most important (massive) nutrient for plant growth, rice leaves are widely measured by specialized colorimeters called ‘SPAD meter’ or ‘chlorophyll meter’ to measure chlorophyll concentration of leaves to estimate nitrogen content in rice plant (https://sensing.konicaminolta.asia/product/chlorophyll-meter-spad-502plus/). There is no other established colorimetric diagnosis of disorders caused by abiotic or biotic stresses, but colorimetric methods will be able to diagnose the other stresses with simple experiments.
Hyper-spectral camera will be suitable for high-throughput and accurate estimation of plant colors. Unlike usual cameras which are composed of only three color sensors, hyper-spectral camera can observe more than 100 different wave lengths of visible light. This is equivalent to SCM observation of colors at 5-nm intervals, then PCM with hyper-spectral camera may be able to estimate plant colors at the same accuracy with SCM. Hyper-spectral camera is at least capable of detecting slight color changes in leaves caused by chloroplast movement, which is not clearly distinguishable with human eyes (Matsuda et al. 2012).
The color (hue) of pigment solutions changes at different concentrations or ‘light path lengths’. This effect, called ‘dichromatism’ (Kreft and Kreft 2007), is especially evident in plant pigments. Painters unintentionally learn that plant leaves are either dark cyan, dark emerald, green, or light yellow-green (e.g., Table 1), and paint plant pictures based on this hue-lightness correlation. Scientific explanation for this hue-lightness correlation is the dichromatism of leaf pigment (mixture of chlorophylls and carotenoids): this pigment is emerald at high concentration, and gradually changes to green and lawn upon dilution in the solvent (Figure 2C). In Figure 2C, transmittance spectrum of leaf pigment has a peak at green wave lengths at high concentration. After dilution of this pigment, transmittance spectrum is composed of peaks at green and red wave lengths. This makes pigment color yellowish after dilution. A more dramatic change of hue is observed for saffron pigment, where red concentrated pigment changes to orange and yellow upon dilution (Figure 2D). Saffron extract transmits only red lights at high concentration, but it transmits both green and red lights after dilution (Figure 2D). These phenomena are clearly explained when applying Beer-Lambert law to visible light spectrum. Pigments naturally have different values of absorbance, or ‘molar attenuation coefficient’ (ε) at different wave lengths. Because ε value is curvilinearly (not linearly) correlated with light transmittance, transmittance spectra of visible light have such different shapes at different pigment concentrations (Kasajima and Sasaki 2015).
Another important factor affecting plant colors is the spectrum of light source. Light sources such as sunlight, fluorescent light, incandescent light, and white LED light have quite different spectra of visible light. Plant colors are recommended to be observed under sunlight when comparing with RHS Color Chart, but the spectrum of sunlight itself is much variable according to the weather, place, season, and time of the day. ‘D65’ is a standard but imaginary light source mimicking day light. D65 consists of a continuous and relatively flat spectrum, then an imaginary flat-spectrum light will also give similar results of colorimetric calculations. In contrast to D65, incandescent light contains more proportion of red lights, and white LED has large peaks at blue and yellow wave lengths (Figure 2E; Kasajima 2016). Such differences in the spectra of light sources more or less cause difference of plant colors. Among all plant colors, the color of purple flowers (purple anthocyanin) will be the most affected by light source. Such great change of object color under different light sources is called ‘color change’ or ‘alexandrite effect’, which was named after gemstone alexandrite. Figure 2F shows reflectance spectrum of a purple cyclamen petal (cultivar ‘Serenadia’). Cyclamen petal reflects larger portions of bluish and reddish lights, compared with greenish lights. This reflectance spectrum is multiplied with the spectra of incident lights (Figure 2E; formula (5)) to obtain the spectra of reflected lights on the surface of cyclamen petal (Figure 2G). The spectra of reflected lights have unique shapes under each incident light, due to the characteristic shape of reflectance spectrum of cyclamen petal. Thus, this cyclamen flower mainly reflects bluish lights under white LED, reddish lights under incandescent light, and both bluish and reddish lights under sunlight (D65). This means that the flower is blue under white LED, red under incandescent light, and purple under sunlight (Figure 2H; Kasajima 2016). This phenomenon is similar to alexandrite, which is reddish under incandescent light or candle light, and greenish or cyanic under sunlight. Then, the light source under which plants are observed must be described in ‘materials and methods’ for scientifically strict description of plant colors. Sunlight or D65-mimicking light are recommended for standard observation of plant colors. Meanwhile, plant colors can be ‘adjusted’ by controlling the light source. Purple flowers can be adjusted to either red, pink, magenta, violet, or blue by the mixture of incandescent light source and white LED light source.
Concluding remarks
The basic part of colorimetry was already established in 1931, by the release of RGB and XYZ color spaces by CIE. Now that colorimetry is widely accepted in the industry such as the adjustment of car body color, there is no reason why we plant researchers do not rely on strict colorimetry for accurate estimation of plant colors. Colorimetry no doubt helps interpretation of plant colors based on visible light spectra of pigment transmittance and plant reflectance, as well as estimation of light-source effects on plant colors. The accuracy of color measurements depends on the methods. Both SCM and PCM are important for measurement of plant colors. Although SCM is stricter, PCM has advantages as a protocol as already described. Again, because an imaginary D65 spectrum representing an average sunlight spectrum is the standard light source of colorimetry, and the spectra of sunlight are variable, D65-mimicking light may be the best illuminant (incident light) in PCM. Colorimeters also give rough estimation of SCM values. Only XYZ intensities are recorded in many colorimeters, but XYZ values can be transformed to RGB values by a simultaneous linear Eq. (2), for calculation of the coordinates in round diagram (Kasajima 2017). The L*a*b* values in literatures can be, in principle, transformed in this way. Digital data for colorimetric calculations (http://kasajima.sakura.ne.jp/color-data) and the template of color circle (http://kasajima.sakura.ne.jp/color-circles-PPT) are available online. Colorimetric calculations shown in the present review can be performed by spreadsheet software. Appropriate on-line colorimetric software should be also developed to promote accessibility to these complicated calculations, together with collection of wide range of plant spectra and digitalization of the colors of RHS Color Chart. We also wish that the present review could provide a good hint for further progress of plant colorimetry and molecular breeding.
Acknowledgments
We would like to appreciate all members of the Japanese Society for Plant Cell and Molecular Biology for kind invitation to contribute the present review. Part of the original studies of ourselves cited in the present review was performed by excellent collaborations of the researchers in NARO Institute of Floricultural Sciences and Iwate University.
Abbreviations
- A3′5′GT
UDP-Glucose Anthocyanin 3′,5′-O-Glucosyltransferase
- ALSV
apple latent spherical virus
- ANS
Anthocyanidin Synthase;
- AS1
Aureusidin Synthase 1
- bHLH
Basic Helix-Loop-Helix
- CCD4
Carotenoid Cleavage Dioxygenase 4
- 4′CGT
Chalcone 4′-O-Glucosyltransferase;
- CHI
Chalcone Isomerase
- CHS
Chalcone Synthase
- CIE
Commission Internationale de l’Éclairage
- DEL
Delila
- DFR
Dihydroflavonol 4-Reductase;
- F3H
Flavanone 3-Hydroxylase
- F3′H
Flavonoid 3′-Hydroxylase
- F3′5′H
Flavonoid 3′,5′-Hydroxylase
- LED
light emitting diode
- MYB1
Myeloblastosis 1
- NHX1
N+/H+-Exchanger 1
- PCM
Photographic Color Measurement
- PDS
Phytoene Desaturase
- PH1
P-ATPase
- PI
Pistillata;
- RGB
red, green, and blue
- RHS
Royal Horticultural Society
- RL2
Rad-Like 2
- ROS1
Rosea 1
- SCM
Spectrometric Color Measurement
- SEP3
Sepallata 3
- SU
Magnesium Chelatase
- VIGS
virus-induced gene silencing
- WDR1
WD40 repeats 1
References
- Aida R, Yoshida K, Kondo T, Kishimoto S, Shibata M (2000) Copigmentation gives bluer flowers on transgenic torenia plants with antisense dihydroflavonol-4-reductase gene. Plant Sci 160: 49–56 [DOI] [PubMed] [Google Scholar]
- Commission Internationale de l’Éclairage (2004) CIE Publ 15: 2004 Colorimetry, 3rd edition. Commission Internationale de l’Éclairage, Vienna
- Dommes AB, Gross T, Herbert DB, Kivivirta KI, Becker A (2019) Virus-induced gene silencing: Empowering genetics in non-model organisms. J Exp Bot 70: 757–770 [DOI] [PubMed] [Google Scholar]
- Faraco M, Spelt C, Bliek M, Verweij W, Hoshino A, Espen L, Prinsi B, Jaarsma R, Tarhan E, de Boer AH, et al. (2014) Hyperacidification of vacuoles by the combined action of two different P-ATPases in the tonoplast determines flower color. Cell Reports 6: 32–43 [DOI] [PubMed] [Google Scholar]
- Fukada-Tanaka S, Inagaki Y, Yamaguchi T, Saito N, Iida S (2000) Colour-enhancing protein in blue petals. Nature 407: 581. [DOI] [PubMed] [Google Scholar]
- Hasegawa M, Mitsuhara I, Seo S, Okada K, Yamane H, Iwai T, Ohashi Y (2014) Analysis on blast fungus-responsive characters of a flavonoid phytoalexin sakuranetin; accumulation in infected rice leaves, antifungal activity and detoxification by fungus. Molecules 19: 11404–11418 [DOI] [PMC free article] [PubMed] [Google Scholar]
- Hong L, Qian Q, Tang D, Wang K, Li M, Cheng Z (2012) A mutation in the rice chalcone isomerase gene causes the golden hull and internode 1 phenotype. Planta 236: 141–151 [DOI] [PubMed] [Google Scholar]
- Ibraheem F, Gaffoor I, Chopra S (2010) Flavonoid phytoalexin-dependent resistance to anthracnose leaf blight requires a functional yellow seed1 in Sorghum bicolor. Genetics 184: 915–926 [DOI] [PMC free article] [PubMed] [Google Scholar]
- Igarashi A, Yamagata K, Sugai T, Takahashi Y, Sugawara E, Tamura A, Yaegashi H, Yamagishi N, Takahashi T, Isogai M, et al. (2009) Apple latent spherical virus vectors for reliable and effective virus-induced gene silencing among a broad range of plants including tobacco, tomato, Arabidopsis thaliana, cucurbits, and legumes. Virology 386: 407–416 [DOI] [PubMed] [Google Scholar]
- Jang S, Li HY (2018) Overexpression of OsAP2 and OsWRKY24 in Arabidopsis results in reduction of plant size. Plant Biotechnol 35: 273–279 [DOI] [PMC free article] [PubMed] [Google Scholar]
- Jeyalakshmi S, Radha R (2017) A review on diagnosis of nutrient deficiency symptoms in plant leaf image using digital image processing. ICTACT J Image Video Processing 7: 1515–1524 [Google Scholar]
- Kasajima I (2016) Alexandrite-like effect in purple flowers analyzed with newly devised round RGB diagram. Sci Rep 6: 29630. [DOI] [PMC free article] [PubMed] [Google Scholar]
- Kasajima I (2017) Plotting colors on color circle: Interconversion between XYZ values and RGB color system. Curr Trends Anal Bioanal Chem 1: 1–8 [Google Scholar]
- Kasajima I (2018a) Plant colorimetry. Plant Technol Rep (Shokubutsu Gijutsu Kenkyu Ho) 1: 5–18 (in Japanese) [Google Scholar]
- Kasajima I (2018b) Alexandrite effect in purple flowers. Chem Biol (Kagakutoseibutsu) 56: 708–709 (in Japanese) [Google Scholar]
- Kasajima I, Fekih R (2017) Eating colors: A scientifically based perception of food colors. Jacobs J Food Nutr 4: 28
- Kasajima I, Ohtsubo N, Sasaki K (2017) Combination of Cyclamen persicum Mill. floral gene promoters and chimeric repressors for the modification of ornamental traits in Torenia fournieri Lind. Hortic Res 4: 17008. [DOI] [PMC free article] [PubMed] [Google Scholar]
- Kasajima I, Sasaki K (2015) Dichromatism causes color variations in leaves and spices. Color Res Appl 40: 605–611 [Google Scholar]
- Katsumoto Y, Fukuchi-Mizutani M, Fukui Y, Brugliera F, Holton TA, Karana M, Nakamura N, Yonekura-Sakakibara K, Togami J, Pigeaire A, et al. (2007) Engineering of the rose flavonoid biosynthetic pathway successfully generated blue-hued flowers accumulating delphinidin. Plant Cell Physiol 48: 1589–1600 [DOI] [PubMed] [Google Scholar]
- Kawai T, Gonoi A, Nitta M, Kaido M, Yamagishi N, Yoshikawa N, Tao R (2014) Virus-induced gene silencing in apricot (Prunus armeniaca L.) and Japanese apricot (P. mume Siebold & Zucc.) with the Apple latent spherical virus vector system. J Jpn Soc Hortic Sci 83: 23–31 [Google Scholar]
- Kikuchi T, Kasajima I, Morita M, Yoshikawa N (2017) Practical DNA markers to estimate apple (Malus×domestica Borkh.) skin color, ethylene production and pathogen resistance. J Hortic 4: 1000211 [Google Scholar]
- Kreft S, Kreft M (2007) Physicochemical and physiological basis of dichromatic colour. Naturwissenschaften 94: 935–939 [DOI] [PubMed] [Google Scholar]
- Kumagai MH, Donson J, Della-Cioppa G, Harvey D, Hanley K, Grill LK (1995) Cytoplasmic inhibition of carotenoid biosynthesis with virus-derived RNA. Proc Natl Acad Sci USA 92: 1679–1683 [DOI] [PMC free article] [PubMed] [Google Scholar]
- Li C, Yamagishi N, Kasajima I, Yoshikawa N (2019) Virus-induced gene silencing (VIGS) and virus-induced flowering (VIF) in strawberry (Fragaria×ananassa) using apple latent spherical virus vectors. Hortic Res 6: 18. [DOI] [PMC free article] [PubMed] [Google Scholar]
- Lim W, Li J (2017) Co-expression of onion chalcone isomerase in Del/Ros1-expressing tomato enhances anthocyanin and flavonol production. Plant Cell Tissue Organ Cult 128: 113–124 [Google Scholar]
- Matsuda O, Tanaka A, Fujita T, Iba K (2012) Hyperspectral imaging techniques for rapid identification of Arabidopsis mutants with altered leaf pigment status. Plant Cell Physiol 53: 1154–1170 [DOI] [PMC free article] [PubMed] [Google Scholar]
- McCauley A, Jones C, Jacobsen J (2011) Plant nutrient functions and deficiency and toxicity symptoms. Nutrient Management Module No.9. Montana State University, Bozeman, pp 1–16
- Nakamura N, Fukuchi-Mizutani M, Miyazaki K, Suzuki K, Tanaka Y (2006) RNAi suppression of the anthocyanidin synthase gene in Torenia hybrida yields white flowers with higher frequency and better stability than antisense and sense suppression. Plant Biotechnol 23: 13–17 [Google Scholar]
- Nakatsuka T, Mishiba K, Abe Y, Kubota A, Kakizaki Y, Yamamura S, Nishihara M (2008) Flower color modification of gentian plants by RNAi-mediated gene silencing. Plant Biotechnol 25: 61–68 [Google Scholar]
- Nishihara M, Nakatsuka T (2011) Genetic engineering of flavonoid pigments to modify flower color in floricultural plants. Biotechnol Lett 33: 433–441 [DOI] [PubMed] [Google Scholar]
- Nishihara M, Nakatsuka T, Yamamura S (2005) Flavonoid components and flower color change in transgenic tobacco plants by suppression of chalcone isomerase gene. FEBS Lett 579: 6074–6078 [DOI] [PubMed] [Google Scholar]
- Noda N, Aida R, Kishimoto S, Ishiguro K, Fukuchi-Mizutani M, Tanaka Y, Ohmiya A (2013) Genetic engineering of novel bluer-colored chrysanthemums produced by accumulation of delphinidin-based anthocyanins. Plant Cell Physiol 54: 1684–1695 [DOI] [PubMed] [Google Scholar]
- Noda N, Yoshioka S, Kishimoto S, Nakayama M, Douzono M, Tanaka Y, Aida R (2017) Generation of blue chrysanthemums by anthocyanin B-ring hydroxylation and glucosylation and its coloration mechanism. Sci Adv 3: e1602785. [DOI] [PMC free article] [PubMed] [Google Scholar]
- Ohmiya A (2009) Carotenoid cleavage dioxygenases and their apocarotenoid products in plants. Plant Biotechnol 26: 351–358 [Google Scholar]
- Ono E, Fukuchi-Mizutani M, Nakamura N, Fukui Y, Yonekura-Sakakibara K, Yamaguchi M, Nakayama T, Tanaka T, Kusumi T, Tanaka Y (2006) Yellow flowers generated by expression of the aurone biosynthetic pathway. Proc Natl Acad Sci USA 103: 11075–11080 [DOI] [PMC free article] [PubMed] [Google Scholar]
- Park KI, Nitasaka E, Hoshino A (2018) Anthocyanin mutants of Japanese and common morning glories exhibit normal proanthocyanidin accumulation in seed coats. Plant Biotechnol 35: 259–266 [DOI] [PMC free article] [PubMed] [Google Scholar]
- Sasaki K, Aida R, Yamaguchi H, Shikata M, Niki T, Nishijima T, Ohtsubo N (2010) Functional divergence within class B MADS-box genes TfGLO and TfDEF in Torenia fournieri Lind. Mol Genet Genomics 284: 399–414 [DOI] [PMC free article] [PubMed] [Google Scholar]
- Sasaki S, Yamagishi N, Yoshikawa N (2011) Efficient virus-induced gene silencing in apple, pear and Japanese pear using Apple latent spherical virus vectors. Plant Methods 7: 15. [DOI] [PMC free article] [PubMed] [Google Scholar]
- Shikata M, Narumi T, Yamaguchi H, Sasaki K, Aida R, Oshima Y, Takiguchi Y, Ohme-Takagi M, Mitsuda N, Ohtsubo N (2011) Efficient production of novel floral traits in torenia by collective transformation with chimeric repressors of Arabidopsis transcription factors. Plant Biotechnol 28: 189–199 [Google Scholar]
- Shin JM, Chung KM, Sakamoto S, Kojima S, Yeh CM, Ikeda M, Mitsuda N, Ohme-Takagi M (2017) The chimeric repressor for the GATA4 transcription factor improves tolerance to nitrogen deficiency in Arabidopsis. Plant Biotechnol 34: 151–158 [DOI] [PMC free article] [PubMed] [Google Scholar]
- Skadhauge B, Thomsen KK, von Wettstein D (1997) The role of the barley testa layer and its flavonoid content in resistance to Fusarium infections. Hereditas 126: 147–160 [Google Scholar]
- Sun W, Meng X, Liang L, Jiang W, Huang Y, He J, Hu H, Almqvist J, Gao X, Wang L (2015) Molecular and biochemical analysis of chalcone synthase from Freesia hybrid in flavonoid biosynthetic pathway. PLoS One 10: e0119054. [DOI] [PMC free article] [PubMed] [Google Scholar]
- Takos AM, Jaffé FW, Jacob SR, Bogs J, Robinson SP, Walker AR (2006) Light-induced expression of a MYB gene regulates anthocyanin biosynthesis in red apples. Plant Physiol 142: 1216–1232 [DOI] [PMC free article] [PubMed] [Google Scholar]
- Zuker A, Tzfira T, Ben-Meir H, Ovadis M, Shklarman E, Itzhaki H, Forkmann G, Martens S, Neta-Sharir I, Weiss D, et al. (2002) Modification of flower color and fragrance by antisense suppression of the flavanone 3-hydroxylase gene. Mol Breed 9: 33–41 [Google Scholar]


