

Abstract
Background
Dyslipidemia is common in kidney transplant (KT) recipients. We analyzed the ratio of triglyceride to high-density lipoprotein cholesterol (TG/HDL-C) in KT recipients to identify risk factors for major cardiovascular events (MACE).
Methods
We retrospectively included KT recipients with a lipid profile performed 1 year after transplantation. We classified patients according to the TG/HDL-C divided into quintiles. Subsequently, we analyzed the association between TG/HDL-C and MACE, defined as heart failure, coronary artery disease, and cerebrovascular disease confirmed by imaging studies.
Results
A total of 1301 KT recipients were enrolled. The median follow-up duration was 7.4 years (interquartile range 4.4–11.1 years). During the follow-up period, 80 (6.2%) patients developed MACE, which included 38 of unstable anginas, 9 of MIs, 19 of heart failures, 18 of cerebral infarcts, and 4 of cerebral hemorrhages. The fourth and fifth quintiles of TG/HDL-C showed a significantly increased risk of MACE [fourth quintile: adjusted hazard ratio (aHR), 3.38; 95% confidence interval (CI) 1.44–7.95; p = 0.005, fifth quintile: aHR, 2.67; 95% CI 1.13–6.30; p = 0.02]) compared to the second quintile of TG/HDL-C. This association is particularly evident in subgroups of non-DM, HTN, no history of CVD, and statin users.
Conclusions
Higher TG/HDL-C levels may be associated with MACE risk in KT recipients.
Keywords: Cholesterol, Cardiovascular, TG/HDL-C, Statins, Kidney transplantation
Introduction
Patients with end-stage renal disease (ESRD) have up to a 30-fold increased cardiovascular (CV) risk compared with the general population [1, 2]. In kidney transplant (KT) recipients, cardiovascular disease (CVD) mortality rates are significantly lower than that in an age-stratified dialysis population, suggesting that renal transplantation reduces CV risk in patients with ESRD [3, 4]. However, the incidence of CVD in KT recipients remains 3–5 times higher than that of the general population [3, 5]. CVD accounts for 35–50% of all-cause mortality in KT recipients and is considered the predominant cause of death [4, 6].
One of the most important CVD risk factors is dyslipidemia [7, 8]. Dyslipidemia is estimated to be present in up to 80% of KT recipients [9], which is similar to the prevalence of dyslipidemia in patients with ESRD prior to transplantation [10]. Dyslipidemia in ESRD is known to be associated with inflammation, changes in lecithin–cholesterol acyltransferase enzyme activity, and decreased insulin sensitivity [11]. After transplantation and renal function recovery, lipid disturbances typically persist, but exhibit a different profile because of the varying effects of immunosuppressive drugs [12]. Among immunosuppressive agents, corticosteroids, cyclosporine, and mammalian targets of rapamycin inhibitors are associated with elevated lipid levels [13]. The dyslipidemia-related factors in ESRD are partially, but not completely, reversible, and the use of immunosuppressive agents, diet, obesity, and genetic predisposition are all thought to contribute to the prevalence of dyslipidemia in transplant patients [13, 14]. The role of dyslipidemia in elevating CV risk in KT recipients is not clearly defined [13]. However, some studies have suggested that the treatment of dyslipidemia could decrease CV risk in KT recipients [15, 16].
Dyslipidemia is defined as an overall change in the lipid profile rather than an elevation in only the total or low-density lipoprotein cholesterol (LDL-C) levels [17]. Triglycerides (TG), LDL-C, and high-density lipoprotein cholesterol (HDL-C) are closely related molecules in terms of their metabolism and effects on multiple organs [18]. Recent studies demonstrated that the ratios of lipid components, such as total cholesterol/HDL-C and TG/HDL-C, are better indicators of CV risk than their individual levels [19-22]. Among these, the ratio of TG to HDL-C (TG/HDL-C) has been shown to be a strong predictor of myocardial infarction (MI), LDL phenotype B, and atherogenic risk [22-24]. In this study, we investigated the association between TG/HDL-C and the development of major adverse cardiovascular events (MACE) after renal transplantation.
Methods
Study design and population
The study design was approved by the Institutional Review Board of Seoul National University Hospital (no. H-1803-044-926) and complied with the Declaration of Helsinki. This retrospective, observational study included patients who underwent renal transplantation at Seoul National University Hospital between 2000 and 2017. KT recipients with serum lipid profiles performed 1 year after transplantation were enrolled. There were no age restrictions, and patients who had undergone a second renal transplantation or simultaneous transplantation of other organs were also included. The patients who underwent renal transplantation at another hospital were excluded.
Data collection and definitions
All data were obtained from the hospital’s electronic medical records. Demographic characteristics including age, sex, height, weight, and body mass index (BMI) were collected. The type of renal replacement therapy before transplantation was reviewed, and the duration of dialysis was calculated on the basis of the date of dialysis initiation. The donor type (living or deceased) was also recorded. The donor and recipient’s ABO and human leukocyte antigen (HLA) typing data were collected and compared to identify ABO incompatibility and the number of HLA mismatches. As our center utilizes a standardized, maintenance immunosuppressant regimen of steroids, mycophenolic acid, and calcineurin inhibitors with only a few exceptions, the prescription rate of steroids or mycophenolic acid was over 90% in the total cohort. However, the use of calcineurin inhibitors differed between patients; therefore, the type of calcineurin inhibitor was collected and analyzed. In addition, the use of mammalian target of rapamycin inhibitors was collected within 1 year after transplantation. The presence of comorbidities such as hypertension, diabetes mellitus (DM), and CVD before transplantation was analyzed. A history of CVD was defined as any history of heart failure, coronary artery disease, or cerebrovascular disease before transplantation. In addition, the duration of statin treatment after transplantation was reviewed. In our study, statin use was defined as the prescription of any 3-hydroxy-3-methyl-glutanyl-coenzyme A reductase inhibitor for at least 3 months during the first year after transplantation. In addition, use of fibrates and omega-3-acids has been defined as the prescription of any medication containing fibrates or omega-3-acids, respectively, for at least 3 months during the first year after transplantation. And steroid pulse therapy for rejection after transplantation was considered to be a factor affecting the lipid profile, so we reviewed the history of IV steroid pulse treatment within 1 year in study participants.
Total cholesterol, triglyceride, HDL-C, and LDL-C levels 1 year after renal transplantation were reviewed, and the TG/HDL-C ratio was calculated. In our center, patients are advised to measure the lipid profile after at least 12 h of fasting. Each lipid profile was categorized into five groups according to the values.
Outcomes
The main outcome was the association between TG/HDL-C and MACE. MACE was defined as heart failure, coronary artery disease documented by coronary angiography, and cerebrovascular disease confirmed by imaging. All patients were followed until March 2018.
The secondary outcome was the association of TG/HDL-C with both graft and patient survival. Graft failure was defined as a return to dialysis or kidney re-transplantation. Mortality data were obtained from the National Database of Statistics Korea.
Biopsy findings during the first year after transplantation were also collected from the medical records. In our center, protocol biopsies were performed at time zero (post-reperfusion), on the 10th day, and 1 year after transplantation only if the patient agreed. Additional kidney biopsies were performed if graft function deteriorated or any suspicious symptoms or signs of rejection were observed. All pathologic findings were examined by two experienced nephropathologists.
Statistical analyses
Data are expressed as mean ± standard deviation or counts with percentages. For comparisons of baseline categorical variables, the Chi-square and Fisher’s exact tests were used. Continuous variables were compared using analysis of variance. Survival analysis between TG/HDL-C and MACE, graft failure, and patient survival was assessed with univariate and multivariate Cox proportional hazard regressions. The proportional hazard assumption was checked for each multivariate Cox regression. The Stata function, mkspline, was used to create a restricted cubic spline function to describe the hazard ratio (HR) of MACE according to lipid profiles including TG/HDL-C. All statistical analyses were performed with STATA/MP version 15.1 (StataCorp, College Station, TX, USA). A p value of 0.05 was considered to indicate statistical significance in all tests.
Results
Baseline characteristics of study patients
A total of 1301 KT recipients were enrolled in the final analysis. The mean patient age was 40.9 ± 16.2 years, and men comprised 61.7% of the study population. The statin prescription rate was 30.3%. The patients showed total cholesterol level of 177.3 ± 33.2 mg/dL, TG of 128.5 ± 75.0 mg/dL, and HDL-C of 56.7 ± 16.7 mg/dL at 1 year after transplantation. LDL-C was also reviewed but only 785 of the 1301 (60.3%) patients had results, and the mean level of LDL-C was 96.4 ± 27.5 mg/dL. Table 1 reports the baseline characteristics of all patients.
Table 1.
Baseline characteristics of the patient population
| Variables | n = 1301 |
|---|---|
| Age, years | 40.9 ± 16.2 |
| Male sex, n (%) | 803 (61.7) |
| BMI, kg/m2 | 22.1 ± 3.9 |
| Donor type, n (%) | |
| Living donor | 876 (67.3) |
| Deceased donor | 425 (32.7) |
| RRT type, n (%) | |
| Pre-emptive | 207 (15.9) |
| Hemodialysis | 780 (60.0) |
| Peritoneal dialysis | 314 (24.1) |
| Duration of RRT, months | 36.6 ± 44.8 |
| ABO incompatible renal transplantation, n (%) | 75 (5.8) |
| HLA mismatch, n (%) | |
| ≤ 3 | 810 (62.3) |
| > 3 | 491 (37.7) |
| Type of calcineurin inhibitor, n (%) | |
| None | 48 (3.7) |
| Cyclosporine | 200 (15.4) |
| Tacrolimus | 1053 (80.9) |
| mTOR inhibitor in 1 year after transplant, n (%) | 58 (4.5) |
| Prior history of CVD, n (%) | 77 (5.9) |
| HTN, n (%) | 1164 (89.5) |
| DM, n (%) | 379 (29.1) |
| Use of statins, n (%) | 394 (30.3) |
| Steroid pulse for rejection within 1 year after transplant | 569 (43.7%) |
| Lipid profiles at 1 year post-transplantation | |
| Total cholesterol (mg/dL) | 177.3 ± 33.2 |
| TG (mg/dL) | 128.5 ± 75.0 |
| HDL-C (mg/dL) | 56.7 ± 16.7 |
| †LDL-C (mg/dL) | 96.4 ± 27.5 |
BMI body mass index, RRT renal replacement therapy, HLA human leukocyte antigen, mTOR mammalian target of rapamycin, CVD cardiovascular disease, HTN hypertension, DM diabetes mellitus, TG triglyceride, HDL-C high density lipoprotein cholesterol, LDL-C low density lipoprotein cholesterol
†Only available in 785 (60.3%) patients
Risk factors associated with MACE
The median follow-up duration after renal transplantation in the total study population was 7.4 years (interquartile range 4.4–11.1 years). During the follow-up period, 80 (6.2%) patients developed MACE, which included 38 of unstable anginas, 9 of MIs, 19 of heart failures, 18 of cerebral infarcts, and 4 of cerebral hemorrhages. The total number of events was 89.
Then, we explored risk factors for development of MACE after renal transplantation. In the univariate analysis, age over 60 years, male sex, BMI over 25 kg/m2, deceased donor, prior history of CVD, hemodialysis as the RRT modality before transplant, duration of RRT over 1 year, high numbers of HLA mismatch, a history of diabetes and statin usage were related to an increased HR of MACE. However, after adjustment for multiple variables including lipid profiles, aged over 60 years and a history of diabetes showed a statistically significant elevation of the HR for MACE (Table 2).
Table 2.
Univariate and multivariate cox analysis for MACE between categorical baseline characteristics and quintiles of each lipid profiles
| Variables (Quintiles) | Levels (mean ± SD) | Univariate | †Multivariate | ||||
|---|---|---|---|---|---|---|---|
| HR (95% CI) | p | HR (95% CI) | p | ||||
| Age ≥ 60 years | 3.79 (2.26–6.35) | < 0.001 | 2.36 (1.33–4.20) | 0.003 | |||
| Female | 0.58 (0.36–0.95) | 0.030 | 0.69 (0.41–1.17) | 0.168 | |||
| BMI ≥ 25 kg/m2 | 1.96 (1.20–3.21) | 0.007 | 1.19 (0.71–2.01) | 0.514 | |||
| Deceased donor | 1.62 (1.04–2.54) | 0.034 | 1.10 (0.65–1.87) | 0.713 | |||
| Prior history of CVD | 3.60 (1.98–6.54) | < 0.001 | 1.31 (0.67–2.55) | 0.432 | |||
| RRT type | |||||||
| Pre-emptive | 1 (reference) | 1 (reference) | |||||
| Hemodialysis | 2.76 (1.19–6.39) | 0.018 | 2.02 (0.81–5.08) | 0.133 | |||
| Peritoneal dialysis | 1.45 (0.56–3.77) | 0.449 | 1.18 (0.41–3.41) | 0.758 | |||
| Duration of RRT ≥ 1 year | 1.65 (1.03–2.62) | 0.036 | 1.24 (0.70–2.19) | 0.463 | |||
| ABO incompatible KT | 0.70 (0.17–2.89) | 0.626 | |||||
| HLA mismatch > 3 | 1.61 (1.04–2.50) | 0.034 | 1.26 (0.79–2.00) | 0.335 | |||
| Type of calcineurin inhibitor | |||||||
| None | 1 (reference) | ||||||
| Cyclosporine | 0.39 (0.12–1.26) | 0.115 | |||||
| Tacrolimus | 0.73 (0.26–1.99) | 0.533 | |||||
| mTOR inhibitor | 1.07 (0.34–3.40) | 0.910 | |||||
| HTN | 1.52 (0.47–4.87) | 0.485 | |||||
| DM | 3.86 (2.46–6.03) | < 0.001 | 2.96 (1.85–4.75) | < 0.001 | |||
| Use of statins | 1.71 (1.08–2.70) | 0.021 | 1.45 (0.89–2.36) | 0.137 | |||
| Steroid pulse for rejection | 1.25 (0.81–1.94) | 0.319 | |||||
| Total cholesterol | |||||||
| Q1 | 132.7 ± 14.3 | 1 (reference) | 1 (reference) | ||||
| Q2 | 159.6 ± 5.5 | 0.72 (0.36–1.45) | 0.360 | 0.82 (0.40–1.71) | 0.601 | ||
| Q3 | 176.1 ± 4.1 | 0.94 (0.49–1.82) | 0.865 | 1.04 (0.50–2.16) | 0.912 | ||
| Q4 | 191.8 ± 5.5 | 0.46 (0.21–1.03) | 0.061 | 0.43 (0.18–1.03) | 0.059 | ||
| Q5 | 225.0 ± 22.4 | 1.12 (0.60–2.10) | 0.727 | 1.07 (0.50–2.28) | 0.856 | ||
| TG | |||||||
| Q1 | 62.0 ± 9.8 | 1 (reference) | |||||
| Q2 | 87.7 ± 6.3 | 1.32 (0.63–2.78) | 0.465 | ||||
| Q3 | 111.1 ± 7.6 | 1.00 (0.46–2.15) | 0.990 | ||||
| Q4 | 143.3 ± 12.0 | 1.58 (0.78–3.20) | 0.206 | ||||
| Q5 | 236.7 ± 97.3 | 1.70 (0.85–3.41) | 0.138 | ||||
| HDL-C | |||||||
| Q1 | 36.0 ± 4.8 | 1 (reference) | 1 (reference) | ||||
| Q2 | 46.8 ± 2.3 | 0.75 (0.40–1.41) | 0.371 | 1.01 (0.50–2.03) | 0.982 | ||
| Q3 | 54.3 ± 2.2 | 0.65 (0.34–1.23) | 0.189 | 1.00 (0.47–2.16) | 0.992 | ||
| Q4 | 63.3 ± 2.9 | 0.54 (0.27–1.09) | 0.085 | 0.89 (0.35–2.26) | 0.800 | ||
| Q5 | 80.9 ± 11.9 | 0.50 (0.25–1.00) | 0.051 | 0.95 (0.32–2.83) | 0.934 | ||
| ‡LDL-C | |||||||
| Q1 | 61.9 ± 11.2 | 1 (reference) | |||||
| Q2 | 81.0 ± 3.9 | 0.66 (0.26–1.71) | 0.397 | ||||
| Q3 | 93.7 ± 3.6 | 0.79 (0.32–1.96) | 0.607 | ||||
| Q4 | 108.3 ± 4.3 | 0.86 (0.35–2.07) | 0.731 | ||||
| Q5 | 135.9 ± 20.3 | 0.77 (0.31–1.93) | 0.582 | ||||
| TG/HDL-C | |||||||
| Q1 | 0.9 ± 0.2 | 2.21 (0.90–5.42) | 0.084 | 2.49 (1.01–6.23) | 0.047 | ||
| Q2 | 1.5 ± 0.1 | 1 (reference) | 1 (reference) | ||||
| Q3 | 2.0 ± 0.2 | 1.89 (0.75–4.74) | 0.175 | 1.77 (0.71–4.45) | 0.223 | ||
| Q4 | 2.9 ± 0.3 | 3.41 (1.46–7.96) | 0.004 | 3.38 (1.44–7.95) | 0.005 | ||
| Q5 | 5.8 ± 3.9 | 3.31 (1.41–7.75) | 0.006 | 2.67 (1.13–6.30) | 0.025 | ||
HR hazard ratio, BMI body mass index, RRT renal replacement therapy, KT kidney transplantation, HLA human leukocyte antigen, mTOR mammalian target of rapamycin, CVD cardiovascular disease, HTN hypertension, DM diabetes mellitus, TG triglyceride, HDL-C high density lipoprotein cholesterol, LDL-C low density lipoprotein cholesterol, TG/HDL-C ratio of triglyceride to high density cholesterol
†Adjusted by variables which showed p value under 0.1 in univariate Cox analysis
‡For the cox regression analysis of LDL-C, only 785 patients included. And the multivariate analysis for LDL-C was performed with same adjustment variables with other multivariate analysis
For the lipid profile, cubic spline analysis was performed on the continuous variable before conducting cox regression on the categorical variable (Fig. 1). In the cubic spline analysis, among the lipid profiles, TC, TG, and HDL-C showed no significant tendency for risk of MACE according to lipid levels. Only TG/HDL-C showed significant correlation with MACE risk and a significant increase in MACE risk at high TG/HDL-C values. To perform cox regression analysis for these lipid profiles, the lipid profile was divided into five groups according to the values. The first quintile was defined as the reference group for the analysis, but in the case of TG/HDL-C, the second quintile was defined as the reference group because the spline curve showed J shape. In univariate and multivariate analyses, the fourth and fifth quintiles of TG/HDL-C showed a significant elevation of the HR compared to the reference group [fourth quintile: aHR, 3.38; 95% confidence interval (CI) 1.44–7.95; p = 0.005; fifth quintile: aHR, 2.67; 95% CI 1.13–6.30; p = 0.025]. Moreover, the first quintile showed marginal difference of MACE risk compared to the reference group (aHR, 2.49; 95% CI 1.01–6.23; p = 0.047). The cubic spline curves and results of cox regression are shown in Fig. 1 and Table 2, respectively.
Fig. 1.

The multivariate-adjusted restricted cubic spline analysis by lipid profiles on MACE risk. Total cholesterol (a), triglyceride (b), HDL-C (c), and TG/HDL-C (d) were analyzed by multivariate adjusted cox regression and plotted with spline curve. The bar plots showed the frequency of patients on each lipid profile value. The thick solid line showed hazard ratio and the dashed line represented 95% confidence interval. HDL-C high density lipoprotein cholesterol, MACE major adverse cardiovascular event, TC total cholesterol, TG triglyceride
Nelson–Aalen cumulative hazard curves for quintiles of TG/HDL-C also showed a significant difference of cumulative risk at the fourth and fifth quintiles compared to the second quintile (log rank p = 0.003 for the fourth quintile, p = 0.004 for the fifth quintile). Figure 2 shows the cumulative risk for MACE in the quintiles.
Fig. 2.
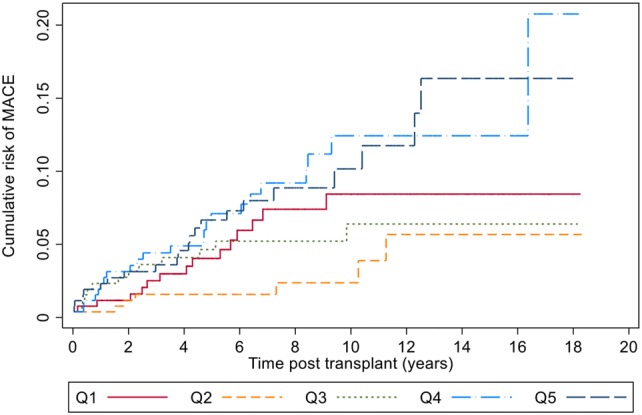
Cumulative risk for MACE in the quintiles of TG/HDL-C. The second quintile (yellow line) showed lowest risk and the fourth and fifth quintiles (light blue and blue lines) showed a significantly elevated risk compared to the second quintile of TG/HDL-C (log rank p = 0.003 for the fourth quintile, p = 0.004 for the fifth quintile). Q1-5 in the legends represent each quintile of TG/HDL-C
Subgroup analyses
When comparing the baseline characteristics of the TG/HDL-C quintiles, there were significant differences in the proportion of men, BMI, prior history of CVD and DM, and statin use. Higher TG/HDL-C quintiles had a higher ratio of men, a higher BMI, and a more frequent history of CVD and DM. Statin prescription rate was the lowest in the third quintile. Although there was no statistical significance, the statin prescription rate was higher in the fourth and fifth quintiles than in the first and second quintiles. Table 3 shows the demographic and clinical characteristics of each quintile of TG/HDL-C.
Table 3.
Comparison of baseline characteristics and MACE events by the quintiles of TG/HDL-C
| Variables | Q1 | Q2 | Q3 | Q4 | Q5 | p |
|---|---|---|---|---|---|---|
| n = 259 | n = 261 | n = 260 | n = 259 | n = 262 | ||
| Age, years | 38.8 ± 17.0 | 40.5 ± 16.2 | 43.2 ± 16.1 | 39.7 ± 16.4 | 42.5 ± 15.0 | 0.008 |
| Male sex, n (%) | 113 (43.3) | 140 (54.1) | 168 (64.6) | 185 (71.4) | 197 (75.2) | < 0.001 |
| BMI, kg/m2 | 20.7 ± 4.4 | 21.9 ± 3.2 | 22.3 ± 3.4 | 22.2 ± 4.2 | 23.3 ± 3.6 | < 0.001 |
| Donor type, n (%) | 0.504 | |||||
| Living donor | 172 (66.4) | 167 (64.0) | 173 (66.5) | 178 (68.7) | 186 (71.0) | |
| Deceased donor | 87 (33.6) | 94 (36.0) | 87 (33.5) | 81 (31.3) | 76 (29.0) | |
| RRT type, n (%) | 0.375 | |||||
| Pre-emptive | 34 (13.1) | 49 (18.8) | 39 (15.0) | 45 (17.4) | 40 (15.3) | |
| Hemodialysis | 157 (60.6) | 155 (59.4) | 157 (60.4) | 143 (55.2) | 168 (64.1) | |
| Peritoneal dialysis | 68 (26.3) | 57 (21.8) | 64 (24.6) | 71 (27.4) | 54 (20.6) | |
| Duration of RRT, months | 39.0 ± 47.3 | 40.5 ± 47.8 | 36.0 ± 42.6 | 34.9 ± 44.7 | 32.4 ± 41.2 | 0.242 |
| ABO incompatible renal transplantation, n (%) | 13 (5.0) | 17 (6.5) | 14 (5.4) | 13 (5.0) | 18 (6.9) | 0.835 |
| HLA mismatch > 3, n (%) | 78 (30.1) | 104 (39.8) | 108 (41.5) | 97 (37.5) | 104 (39.7) | 0.063 |
| Type of calcineurin inhibitor, n (%) | 0.152 | |||||
| None | 7 (2.7) | 5 (1.9) | 11 (4.2) | 13 (5.0) | 12 (4.6) | |
| Cyclosporine | 43 (16.6) | 33 (12.6) | 43 (16.5) | 34 (13.1) | 47 (17.9) | |
| Tacrolimus | 209 (80.7) | 223 (85.4) | 206 (79.2) | 212 (81.9) | 203 (77.5) | |
| mTOR inhibitor in 1 year after transplant, n (%) | 9 (3.5) | 7 (2.7) | 10 (3.8) | 15 (5.8) | 17 (6.5) | 0.174 |
| Prior history of CVD, n (%) | 7 (2.7) | 9 (3.4) | 19 (7.3) | 22 (8.5) | 20 (7.6) | 0.011 |
| HTN, n (%) | 228 (88.0) | 237 (90.8) | 231 (88.8) | 228 (88.0) | 240 (91.6) | 0.597 |
| DM, n (%) | 60 (23.2) | 67 (25.7) | 82 (31.5) | 80 (30.9) | 90 (34.4) | 0.032 |
| Use of statins, n (%) | 75 (29.0) | 76 (29.1) | 70 (26.9) | 83 (32.0) | 90 (34.4) | 0.379 |
| Steroid pulse for rejection within 1 year after transplant | 99 (38.2) | 114 (43.7) | 116 (44.6) | 115 (44.4) | 125 (47.7) | 0.287 |
| Lipid profiles at 1 year post-transplantation, mg/dL | ||||||
| Total cholesterol | 178.3 ± 29.3 | 175.0 ± 29.3 | 176.9 ± 33.6 | 174.9 ± 36.0 | 181.7 ± 36.9 | 0.114 |
| TG | 67.5 ± 15.7 | 92.2 ± 20.0 | 114.5 ± 25.4 | 142.0 ± 32.1 | 225.5 ± 104.2 | < 0.001 |
| HDL-C | 74.1 ± 16.2 | 62.8 ± 12.8 | 56.0 ± 12.1 | 49.5 ± 10.5 | 41.1 ± 9.4 | < 0.001 |
| TG/HDL-C | 0.9 ± 0.2 | 1.5 ± 0.1 | 2.0 ± 0.2 | 2.9 ± 0.3 | 5.8 ± 3.9 | < 0.001 |
| Total number of MACE events, n | 17 | 7 | 14 | 26 | 24 | 89 |
| Coronary vascular | 8 | 3 | 5 | 15 | 16 | 48 |
| Cerebrovascular | 6 | 0 | 4 | 6 | 6 | 22 |
| Heart failure | 3 | 4 | 5 | 5 | 2 | 19 |
TG triglyceride, HDL-C high-density lipoprotein cholesterol, BMI body mass index, RRT renal replacement therapy, HLA human leukocyte antigen, mTOR mammalian target of rapamycin, CVD cardiovascular disease, HTN hypertension, DM diabetes mellitus, TG triglyceride, HDL-C high density lipoprotein cholesterol
Subgroup analysis was performed to evaluate the confounding effect of multiple baseline characteristics (Fig. 3). For the subgroup analysis, we divided TG/HDL-C into two groups, the second quintile or lower and greater than the second quintile. This criterion is due to the lowest MACE risk by TG/HDL-C in the second quintile. When comparing the MACE risk between the two categories of TG/HDL-C, age, sex, and BMI showed no significant difference of risk between the subgroups. In contrast, the group with a history of diabetes showed no difference in risk according to TG/HDL-C, whereas the group with no history of diabetes showed an elevated risk of MACE. Similarly, the subgroups with a history of hypertension, no history of CVD, and statin usage were related to the risk of MACE; the counterparts of these subgroups showed no significant risk elevation.
Fig. 3.
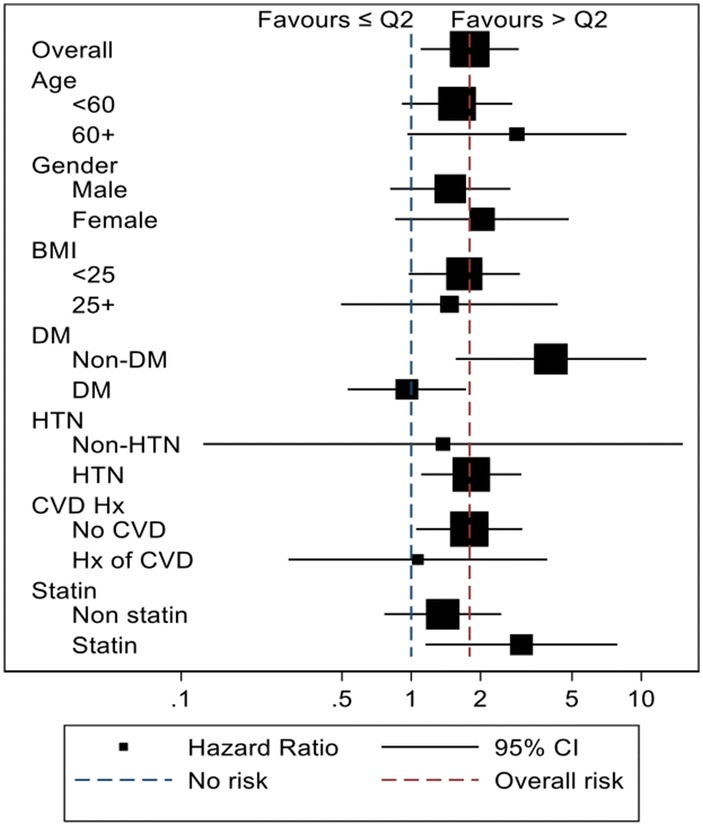
Subgroup analysis for baseline characteristics and effect of TG/HDL-C on MACE risk. Based on the blue dotted line, the left side shows an increase in MACE risk at low TG/HDL-C (less than the second quintile) and the right side shows an increase in MACE risk at high TG/HDL-C (more than the second quintile). The red dotted line shows the overall effect on MACE with TG/HDL-C
Association of TG/HDL-C with interstitial fibrosis and tubular atrophy, T-cell mediated rejection and the graft and patient survival
To determine the effect of TG/HDL-C on graft pathology, 1-year protocol biopsy results were collected. In our center, protocol biopsy was recommended to KT recipients 1 year after transplantation and performed if informed consent could be obtained. Approximately one-third of KT recipients (n = 387, 29.7%) underwent allograft biopsy 1 year after transplantation. Among these recipients, logistic analysis showed no significant relationship between TG/HDL-C and 1-year post-transplant interstitial fibrosis and tubular atrophy (IFTA) or T-cell mediated rejection (Table 4). Additionally, the cox regression analysis was performed on all study patients for graft and patient survival. We found lower risk of graft failure in the first quintile of TG/HDL-C compared to reference group with marginal significance (aHR, 0.48; 95% CI 0.22–1.03; p = 0.058, Table 4).
Table 4.
IFTA in 1 year post-transplant kidney biopsy and the graft and patient survival according to quintiles of TG/HDL-C
| TG/HDL-C | IFTA in 1 year post-transplant renal biopsy †N = 182/387 |
TCMR in 1 year post-transplant renal biopsy †N = 188/387 |
Graft failure N = 93/1301 |
Patient mortality N = 40/1301 |
||||
|---|---|---|---|---|---|---|---|---|
| Adjusted OR (95% CI) | p | Adjusted OR (95% CI) | p | aHR (95% CI) | p | aHR (95% CI) | p | |
| Q1 | 0.73 (0.37–1.43) | 0.359 | 0.62 (0.32–1.19) | 0.151 | 0.48 (0.22–1.03) | 0.058 | 0.48 (0.22–1.04) | 0.064 |
| Q2 | 1 (reference) | – | 1 (reference) | – | 1 (reference) | – | 1 (reference) | – |
| Q3 | 1.57 (0.78–3.17) | 0.210 | 0.81 (0.41–1.62) | 0.556 | 0.93 (0.49–1.75) | 0.815 | 1.02 (0.54–1.92) | 0.955 |
| Q4 | 1.35 (0.67–2.70) | 0.398 | 1.08 (0.55–2.11) | 0.828 | 1.22 (0.67–2.24) | 0.518 | 1.38 (0.76–2.50) | 0.297 |
| Q5 | 1.30 (0.69–2.45) | 0.423 | 0.99 (0.53–1.83) | 0.973 | 1.88 (0.46–1.69) | 0.698 | 0.99 (0.52–1.90) | 0.986 |
IFTA interstitial fibrosis and tubular atrophy, TCMR T-cell mediated rejection, TG triglyceride, HDL-C high-density lipoprotein cholesterol, OR odds ratio
†Only included 1-year post transplant kidney biopsy findings which is available on medical records. Only formal pathologic results by nephropathologist was included
Discussion
In this study, among the conventional lipid profiles and TG/HDL-C, TG/HDL-C was the only one that clearly correlated with MACE risk. MACE risk was significantly higher in the first, fourth and fifth quintiles of TG/HDL-C at 1 year after transplantation than the second quintile of TG/HDL-C. Subgroup analysis by baseline characteristics showed that the subgroups with non-DM, HTN, no history of CVD, and statin usage were related to elevated risk of MACE according to TG/HDL-C.
Increasing evidence has shown that small, dense LDL (sd-LDL) is the lipid most strongly linked to CVD, and its deregulation is the most frequent form of dyslipidemia in patients with premature heart disease [25]. sd-LDL easily penetrates the arterial wall, has a high affinity to the proteoglycans of the arterial wall, and has a long residence time in the subendothelial space [26]. In addition, it exhibits a low affinity for LDL receptors and is not easily removed from plasma [26]. Thus, sd-LDL particles might be a better predictor of CVD than traditional lipid profiles, including LDL-C. However, the direct measurement of sd-LDL is technically demanding and not applicable to routine biochemical screening [24]. A surrogate marker for sd-LDL is TG/HDL-C, which is increasingly being utilized because it is easy to measure. A growing body of research suggests that TG/HDL-C measurements can be used to predict CV risk [20, 23, 27]. Previous studies showed that TG/HDL-C is associated with extensive coronary disease and MI in the general population [23, 27, 28]. In the meta-analysis of Asia/Pacific region studies, total cholesterol/HDL-C and TG/HDL-C were found to be better predictors of CVD than other lipid variables [29]. In addition, TG/HDL-C is associated with CV risk in patients with chronic kidney disease and patients with obesity and type 2 DM [30, 31].
Moreover, a previous study reported disturbances in lipid metabolism associated with TG-rich lipoproteins and HDL particles in KT recipients, both of which are closely related to TG/HDL-C [32]. These changes in lipid profile indicate TG/HDL-C fluctuation and are presumed to be correlated with increased CV risk in transplant patients. However, despite this reasonable assumption, no previous studies have investigated TG/HDL-C in transplant patients.
In this study, we analyzed the MACE risk for each quintile of conventional lipid profiles, but none of the lipid profile showed significant correlation with MACE. Only the TG/HDL-C ratio, which combined TG and HDL-C, showed a significant change in MACE risk with changing quintiles. This specific significance of TG/HDL-C in MACE risk of KT recipients suggests that qualitative information including the morphological characteristics of cholesterol is more useful to predict CV risk than the quantitative amount of cholesterol.
The optimal cut-off value of TG/HDL-C remains unclear. However, a study in Iranian men indicated an increase in CV risk in the group with TG/HDL-C > 6.9 [33], and another study with a female cohort indicated an increase in CV risk in the group with TG/HDL-C > 3.66 [34]. In a study of patients with stage 1–5 chronic kidney disease, the risk of CV events was elevated when TG/HDL-C was > 3.29 [30]. In our study, the fourth and fifth quintiles that had an elevated risk of MACE showed TG/HDL-C of 2.9 ± 0.3 and 5.8 ± 3.9, respectively. According to the result of our study, the cut-off value of TG/HDL-C in KT recipients could be 2.9 or above, which is similar to those in prior studies on chronic kidney disease.
When comparing the baseline characteristics according to the quintile of TG/HDL-C, the male ratio, BMI, CV history, and DM were higher in the fourth and fifth quintiles. The differences in these baseline characteristics were thought to affect MACE risk; therefore, a stratified subgroup analysis was performed according to the baseline characteristics. In the subgroup analysis, among the characteristics that differed between quintiles, the sex and BMI subgroups showed no difference in MACE risk according to TG/HDL-C, whereas the CV history and DM subgroups showed a significant difference in MACE risk according to TG/HDL-C. The possible cause of the differing influence of TG/HDL-C between these subgroups is that patients with high risk factors such as DM and CVD history before transplant are more affected by such risk factors than TG/HDL-C alone, so that there is little difference in the risk for TG/HDL-C levels, while the patients without those risk factors can have TG/HDL-C as the significant risk factor of MACE.
We also found graft survival was marginally increased in the lowest quintile of TG/HDL-C compared to the reference group. Several previous studies showed evidence of relationship of lipid profile on graft survival. One study showed hypertriglyceridemia correlates with chronic allograft nephropathy [35], and another study showed that the combination of triglyceride and VLDL proteins correlate with graft failure [36]. Although the results of our study on graft survival did not gain statistical significance, we could suggest lipid profile ratio as well as conventional profile might affect the graft outcome in KT recipients.
The present study has several limitations. First, this was a retrospective observational study; therefore, it is difficult to prove cause and effect. Second, the TG/HDL-C index, which we used, was calculated using two lipid profiles, TG and HDL-C, and TG may have changes according to quantity of daily meal intake and measurement time after food intake. Although we used the lipid profile measured during fasting, nevertheless, it is possible that the TG/HDL-C group was misclassified in some patients due to diurnal and daily variation. Third, this study was conducted in a single country and included an exclusively Asian patient population. Other ethnic populations may exhibit differences under similar conditions. Finally, there is a possibility of selection bias, as only patients with a lipid profile at 1 year after transplantation were included in the study.
Conclusion
In this study, we found a significant association between post-transplant TG/HDL-C and the development of MACE in KT recipients. Based on our findings, maintaining adequate TG/HDL-C levels in KT recipients may help to reduce CV risk and increase long-term graft survival.
Acknowledgements
This study was supported by a grant from the Ministry of Health and Welfare (No. HI18C1604) and a grant from the Ministry of Science, ICT and Future Planning of Korea (No. 2015M3C9A2054342).
Compliance with ethical standards
Conflict of interest
The authors have no conflicts of interest to declare.
Human and animal rights
The study protocol has been approved by the research institute’s committee on human research. The requirement of informed consent was waived by the review board (no. H-1803-044-926).
Footnotes
Publisher's Note
Springer Nature remains neutral with regard to jurisdictional claims in published maps and institutional affiliations.
References
- 1.Ortiz A, Covic A, Fliser D, Fouque D, Goldsmith D, Kanbay M, et al. Epidemiology, contributors to, and clinical trials of mortality risk in chronic kidney failure. Lancet. 2014;383(9931):1831–1843. doi: 10.1016/S0140-6736(14)60384-6. [DOI] [PubMed] [Google Scholar]
- 2.Annema W, Dikkers A, de Boer JF, Dullaart RP, Sanders JS, Bakker SJ, et al. HDL cholesterol efflux predicts graft failure in renal transplant recipients. J Am Soc Nephrol. 2016;27(2):595–603. doi: 10.1681/ASN.2014090857. [DOI] [PMC free article] [PubMed] [Google Scholar]
- 3.Foley RN, Parfrey PS, Sarnak MJ. Clinical epidemiology of cardiovascular disease in chronic renal disease. Am J Kidney Dis. 1998;32(5 Suppl 3):S112–S119. doi: 10.1053/ajkd.1998.v32.pm9820470. [DOI] [PubMed] [Google Scholar]
- 4.Lindholm A, Albrechtsen D, Frodin L, Tufveson G, Persson NH, Lundgren G. Ischemic heart disease–major cause of death and graft loss after renal transplantation in Scandinavia. Transplantation. 1995;60(5):451–457. doi: 10.1097/00007890-199509000-00008. [DOI] [PubMed] [Google Scholar]
- 5.Kasiske BL. Risk factors for accelerated atherosclerosis in renal transplant recipients. Am J Med. 1988;84(6):985–992. doi: 10.1016/0002-9343(88)90302-6. [DOI] [PubMed] [Google Scholar]
- 6.Kasiske BL, Guijarro C, Massy ZA, Wiederkehr MR, Ma JZ. Cardiovascular disease after renal transplantation. J Am Soc Nephrol. 1996;7(1):158–165. doi: 10.1681/ASN.V71158. [DOI] [PubMed] [Google Scholar]
- 7.Emerging Risk Factors C. Di Angelantonio E, Sarwar N, Perry P, Kaptoge S, Ray KK, et al. Major lipids, apolipoproteins, and risk of vascular disease. JAMA. 2009;302(18):1993–2000. doi: 10.1001/jama.2009.1619. [DOI] [PMC free article] [PubMed] [Google Scholar]
- 8.Tanne D, Koren-Morag N, Graff E, Goldbourt U. Blood lipids and first-ever ischemic stroke/transient ischemic attack in the Bezafibrate Infarction Prevention (BIP) Registry: high triglycerides constitute an independent risk factor. Circulation. 2001;104(24):2892–2897. doi: 10.1161/hc4901.100384. [DOI] [PubMed] [Google Scholar]
- 9.Gonyea JE, Anderson CF. Weight change and serum lipoproteins in recipients of renal allografts. Mayo Clin Proc. 1992;67(7):653–657. doi: 10.1016/S0025-6196(12)60720-4. [DOI] [PubMed] [Google Scholar]
- 10.Burmeister JE, Mosmann CB, Costa VB, Saraiva RT, Grandi RR, Bastos JP, et al. Prevalence of cardiovascular risk factors in hemodialysis patients—the CORDIAL study. Arq Bras Cardiol. 2014;102(5):473–480. doi: 10.5935/abc.20140048. [DOI] [PMC free article] [PubMed] [Google Scholar]
- 11.Kaysen GA. Dyslipidemia in chronic kidney disease: causes and consequences. Kidney Int. 2006;70:S55–S58. doi: 10.1038/sj.ki.5001979. [DOI] [Google Scholar]
- 12.Badiou S, Cristol JP, Mourad G. Dyslipidemia following kidney transplantation: diagnosis and treatment. Curr Diabetes Rep. 2009;9(4):305–311. doi: 10.1007/s11892-009-0047-0. [DOI] [PubMed] [Google Scholar]
- 13.Agarwal A, Prasad GV. Post-transplant dyslipidemia: mechanisms, diagnosis and management. World J Transpl. 2016;6(1):125–134. doi: 10.5500/wjt.v6.i1.125. [DOI] [PMC free article] [PubMed] [Google Scholar]
- 14.Riella LV, Gabardi S, Chandraker A. Dyslipidemia and its therapeutic challenges in renal transplantation. Am J Transpl. 2012;12(8):1975–1982. doi: 10.1111/j.1600-6143.2012.04084.x. [DOI] [PubMed] [Google Scholar]
- 15.Holdaas H, Fellstrom B, Cole E, Nyberg G, Olsson AG, Pedersen TR, et al. Long-term cardiac outcomes in renal transplant recipients receiving fluvastatin: the ALERT extension study. Am J Transpl. 2005;5(12):2929–2936. doi: 10.1111/j.1600-6143.2005.01105.x. [DOI] [PubMed] [Google Scholar]
- 16.Holdaas H, Fellstrom B, Jardine AG, Holme I, Nyberg G, Fauchald P, et al. Effect of fluvastatin on cardiac outcomes in renal transplant recipients: a multicentre, randomised, placebo-controlled trial. Lancet. 2003;361(9374):2024–2031. doi: 10.1016/S0140-6736(03)13638-0. [DOI] [PubMed] [Google Scholar]
- 17.Jellinger PS, Handelsman Y, Rosenblit PD, Bloomgarden ZT, Fonseca VA, Garber AJ, et al. American Association of Clinical Endocrinologists and American College of Endocrinology Guidelines for Management of Dyslipidemia and Prevention of Cardiovascular Disease—executive Summary Complete Appendix to Guidelines available at http://journals.aace.com. Endocr Pract. 2017;23(4):479–497. doi: 10.4158/EP171764.GL. [DOI] [PubMed] [Google Scholar]
- 18.Pizzini A, Lunger L, Demetz E, Hilbe R, Weiss G, Ebenbichler C, et al. The role of omega-3 fatty acids in reverse cholesterol transport: a review. Nutrients. 2017 doi: 10.3390/nu9101099. [DOI] [PMC free article] [PubMed] [Google Scholar]
- 19.Anderson KM, Wilson PW, Odell PM, Kannel WB. An updated coronary risk profile. A statement for health professionals. Circulation. 1991;83(1):356–362. doi: 10.1161/01.CIR.83.1.356. [DOI] [PubMed] [Google Scholar]
- 20.Castelli WP, Garrison RJ, Wilson PW, Abbott RD, Kalousdian S, Kannel WB. Incidence of coronary heart disease and lipoprotein cholesterol levels. The Framingham study. JAMA. 1986;256(20):2835–2838. doi: 10.1001/jama.1986.03380200073024. [DOI] [PubMed] [Google Scholar]
- 21.Grover SA, Palmer CS, Coupal L. Serum lipid screening to identify high-risk individuals for coronary death. The results of the lipid research clinics prevalence cohort. Arch Intern Med. 1994;154(6):679–684. doi: 10.1001/archinte.1994.00420060113012. [DOI] [PubMed] [Google Scholar]
- 22.Millan J, Pinto X, Munoz A, Zuniga M, Rubies-Prat J, Pallardo LF, et al. Lipoprotein ratios: Physiological significance and clinical usefulness in cardiovascular prevention. Vasc Health Risk Manag. 2009;5:757–765. [PMC free article] [PubMed] [Google Scholar]
- 23.Gaziano JM, Hennekens CH, O'Donnell CJ, Breslow JL, Buring JE. Fasting triglycerides, high-density lipoprotein, and risk of myocardial infarction. Circulation. 1997;96(8):2520–2525. doi: 10.1161/01.CIR.96.8.2520. [DOI] [PubMed] [Google Scholar]
- 24.Hanak V, Munoz J, Teague J, Stanley A, Jr, Bittner V. Accuracy of the triglyceride to high-density lipoprotein cholesterol ratio for prediction of the low-density lipoprotein phenotype B. Am J Cardiol. 2004;94(2):219–222. doi: 10.1016/j.amjcard.2004.03.069. [DOI] [PubMed] [Google Scholar]
- 25.Kwiterovich PO., Jr Clinical relevance of the biochemical, metabolic, and genetic factors that influence low-density lipoprotein heterogeneity. Am J Cardiol. 2002;90(8A):30i–47i. doi: 10.1016/S0002-9149(02)02749-2. [DOI] [PubMed] [Google Scholar]
- 26.Hirayama S, Miida T. Small dense LDL: an emerging risk factor for cardiovascular disease. Clin Chim Acta. 2012;414:215–224. doi: 10.1016/j.cca.2012.09.010. [DOI] [PubMed] [Google Scholar]
- 27.da Luz PL, Favarato D, Faria-Neto JR, Jr, Lemos P, Chagas AC. High ratio of triglycerides to HDL-cholesterol predicts extensive coronary disease. Clinics (Sao Paulo) 2008;63(4):427–432. doi: 10.1590/S1807-59322008000400003. [DOI] [PMC free article] [PubMed] [Google Scholar]
- 28.McLaughlin T, Reaven G, Abbasi F, Lamendola C, Saad M, Waters D, et al. Is there a simple way to identify insulin-resistant individuals at increased risk of cardiovascular disease? Am J Cardiol. 2005;96(3):399–404. doi: 10.1016/j.amjcard.2005.03.085. [DOI] [PubMed] [Google Scholar]
- 29.Barzi F, Patel A, Woodward M, Lawes CM, Ohkubo T, Gu D, et al. A comparison of lipid variables as predictors of cardiovascular disease in the Asia Pacific region. Ann Epidemiol. 2005;15(5):405–413. doi: 10.1016/j.annepidem.2005.01.005. [DOI] [PubMed] [Google Scholar]
- 30.Sonmez A, Yilmaz MI, Saglam M, Unal HU, Gok M, Cetinkaya H, et al. The role of plasma triglyceride/high-density lipoprotein cholesterol ratio to predict cardiovascular outcomes in chronic kidney disease. Lipids Health Dis. 2015;14:29. doi: 10.1186/s12944-015-0031-4. [DOI] [PMC free article] [PubMed] [Google Scholar]
- 31.Quispe R, Martin SS, Jones SR. Triglycerides to high-density lipoprotein-cholesterol ratio, glycemic control and cardiovascular risk in obese patients with type 2 diabetes. Curr Opin Endocrinol Diabetes Obes. 2016;23(2):150–156. doi: 10.1097/MED.0000000000000241. [DOI] [PubMed] [Google Scholar]
- 32.Kimak E, Halabis M, Baranowicz-Gaszczyk I. Relationships between serum lipid, lipoprotein, triglyceride-rich lipoprotein, and high-density lipoprotein particle concentrations in post-renal transplant patients. J Zhejiang Univ Sci B. 2010;11(4):249–257. doi: 10.1631/jzus.B1000012. [DOI] [PMC free article] [PubMed] [Google Scholar]
- 33.Hadaegh F, Khalili D, Ghasemi A, Tohidi M, Sheikholeslami F, Azizi F. Triglyceride/HDL-cholesterol ratio is an independent predictor for coronary heart disease in a population of Iranian men. Nutr Metab Cardiovasc Dis. 2009;19(6):401–408. doi: 10.1016/j.numecd.2008.09.003. [DOI] [PubMed] [Google Scholar]
- 34.Merz CN, Kelsey SF, Pepine CJ, Reichek N, Reis SE, Rogers WJ, et al. The Women's Ischemia Syndrome Evaluation (WISE) study: protocol design, methodology and feasibility report. J Am Coll Cardiol. 1999;33(6):1453–1461. doi: 10.1016/S0735-1097(99)00082-0. [DOI] [PubMed] [Google Scholar]
- 35.Guijarro C, Massy ZA, Kasiske BL. Clinical correlation between renal allograft failure and hyperlipidemia. Kidney Int Suppl. 1995;52:S56–S59. [PubMed] [Google Scholar]
- 36.Isoniemi H, Nurminen M, Tikkanen MJ, von Willebrand E, Krogerus L, Ahonen J, et al. Risk factors predicting chronic rejection of renal allografts. Transplantation. 1994;57(1):68–72. doi: 10.1097/00007890-199401000-00013. [DOI] [PubMed] [Google Scholar]