Abstract
The aim of the study is to determine the prevalence, outcomes, and survival (among live births [LB]), in pregnancies diagnosed with trisomy 13 (T13) and 18 (T18), by con-genital anomaly register and region. Twenty-four population- and hospital-based birth defects surveillance registers from 18 countries, contributed data on T13 and T18 between 1974 and 2014 using a common data-reporting protocol. The mean total birth prevalence (i.e., LB, stillbirths, and elective termination of pregnancy for fetal anomalies [ETOPFA]) in the registers with ETOPFA (n = 15) for T13 was 1.68 (95% CI1.3–2.06), and for T18 was 4.08 (95% CI 3.01–5.15), per 10,000 births. The prevalence varied among the various registers. The mean prevalence among LB in all registers for T13 was 0.55 (95%CI 0.38–0.72), and for T18 was 1.07 (95% CI 0.77–1.38), per 10,000 births. The median mortality in the first week of life was 48% for T13 and 42% for T18, across all registers, half of which occurred on the first day of life. Across 16 registers with complete 1-year follow-up, mortality in first year of life was 87% for T13 and 88% for T18. This study provides an international perspective on prevalence and mortality of T13 and T18. Overall outcomes and survival among LB were poor with about half of live born infants not surviving first week of life; nevertheless about 10% survived the first year of life. Prevalence and outcomes varied by country and termination policies. The study highlights the variation in screening, data collection, and reporting practices for these conditions.
Keywords: congenital anomaly register, Edwards syndrome, Patau syndrome, trisomies, trisomy 13, trisomy 18
1 |. INTRODUCTION
Trisomy 18 (T18) and trisomy 13 (T13) are the second and third most common autosomal trisomies in live births (LB) after trisomy 21. Previous population prevalence (i.e., total of LB, stillbirths [SB], and termination of pregnancies) estimates for T13 range from 1.9 to 2.8 and for T18 from 4.8 to 7 per 10,000 births, from studies in United Kingdom and Europe in the last two decades (Loane et al., 2013; Springett et al., 2015; Springett & Morris, 2014; Tonks, Gornall, Larkins, & Gardosi, 2013). The reported live birth prevalence for T13 is 0.43–0.54 and for T18 is 0.96–1.12 per 10,000 births (Loane et al., 2013). The prevalence is increasing, partly due to increasing maternal age (Loane et al., 2013; Nair, Tucker, Hughes, Greenacre, & Morgan, 2015; Savva, Walker, & Morris, 2010).
Both T13 and T18, also known as Patau and Edwards syndrome, respectively, are associated with a wide range of congenital anomalies, such as cardiac anomalies, orofacial clefts, abdominal wall anomalies, tracheoesophageal anomalies, genitourinary anomalies, limb and nervous system anomalies (Pont et al., 2006; Springett et al., 2015). This enables many cases to be detected by antenatal ultrasound. A diagnosis can be confirmed with cytogenetic analysis. Many cases are detected during antenatal screening for down syndrome and through free fetal DNA tests.
T13 and T18 are associated with a poor pregnancy outcome and most live born infants die within the first few days or weeks of life (Loane et al., 2013; Meyer et al., 2016; Springett et al., 2015; Springett & Morris, 2014; Tonks et al., 2013; Wu, Springett, & Morris, 2013). The median survival of live born cases of T13/T18 is reported as 10–14 days with 1-year survival around 8–10% (Rasmussen, Wong, Yang, May, & Friedman, 2003; Wu et al., 2013). There is limited comparative population prevalence and survival data for T13/T18 on an international basis.
2 |. AIM
The aim of this study was to evaluate the prevalence, natural course, and mortality among cases with a diagnosis of T13 or T18, across time-periods and different countries. This study compares infant mortality by congenital anomaly register, region, elective termination of pregnancy for fetal anomalies (ETOPFA) policy and trends in prevalence over time.
3 |. METHODS
3.1 |. Study design and setting
This study was undertaken as a part of an International Clearinghouse for Birth Defects Surveillance and Research (ICBDSR) project to evaluate mortality of significant congenital anomalies. The ICBDSR was established in 1974 and is a voluntary nonprofit organization affiliated to the World Health Organization (http://www.icbdsr.org/). As a consortium of birth defects surveillance programs (hereafter referred to as “registers”) from around the world, ICBDSR aims to investigate and collaborate in the prevention of birth defects. As of 2019, there are 42 member registers that conduct birth defects surveillance, either population-based or hospital-based. Of these, 27 contribute, on an annual basis, aggregated data to ICBDSR for surveillance purposes on children and fetuses affected with 1 of 39 different birth defects (ICBDSR, 2014). Each register collects, along with selected birth defects, data on the total annual number of LB and SB for each of the surveillance years to aid in estimation of their prevalence.
For the current analysis, the study period included the time between the year a surveillance program was initiated until 2014. Data were requested from the ICBDSR member registries on the total births per year and the number of T13 and T18 cases per birth year according to:
Pregnancy outcome: LB, SB, and ETOPFA.
Mortality in LB: Survival at age of 1 day, 1 week, 1 month, 1 year, and more than 1 year.
Clinical presentation: isolated or multiple (two or more) major con-genital anomalies.
3.2 |. Data quality of registers and statistical methods
Questionnaires were sent to individual registers to ascertain the type of register (hospital or population-based), ascertainment period, extent of prenatal screening, duration of monitoring, areas covered, ETOPFA policies, and follow-up methods for children with birth defects.
The prevalence of T13 and T18 were not calculated for registers that did not report SB (Leoncini et al., 2010), as these estimates were likely to be under-estimates of the true prevalence. Total prevalence estimates were calculated separately for registers with information on LB, SB, and ETOPFA and for registers with information on LB and SB only. The reason for exclusion of ETOPFA will influence the accuracy of the total prevalence, as some registers do not include ETOPFA, because terminations are not legally allowed in their regions, whereas others just do not record terminations.
Both total prevalence (i.e., including LB, SB, and ETOPFA) rates per 10,000 total births and live birth prevalence rates per 10,000 total births were calculated for T13 and T18, with corresponding 95% confidence intervals (95% CI). In registers with information on LB, SB, and ETOPFA, 3-year rolling averages were calculated for prevalence of T13 and T18, respectively.
Details about how the registries obtained follow-up information on the survival of LB with trisomy 13 and trisomy 18, was used to determine if the registry had complete follow-up. Registries with incomplete follow-up of LB were excluded from the survival analysis. Among LB, age-specific mortality was calculated as the number of deaths among live born cases divided by the total number of infants with T13 and T18, known to be alive at different time-periods (day of birth, Day 2–6, Day 7–27, Day 28–1 year and 1–4 years) after birth. Survival probability was calculated using the Kaplan–Meier method.
4 |. RESULTS
International Clearinghouse for Birth Defects Surveillance and Research member registries representing 18 countries in Europe, North America, South America, and Asia contributed data on cases with T13 (n = 23 registers) and T18 (n = 24 registers), born between 1974 and 2014 (varying per register). Most registers included all or part of surveillance years 2001–2014 in their data; 80% of the registers reported data for 2001, 87% for 2009, and 96% included data from 2011 to 2013.
Table 1 provides details of the 24 individual registers. Eight registers were hospital-based, whereas 16 were population-based (regional or national). All the registers had a method to screen and follow-up children with birth defects, whether by clinicians or registry staff, at discharge from hospital or by linkage to administrative databases such as death records or other health care databases. Some registers had a combination of these methods. Of the 24 registers, 15 registers had information on LB, SB, and ETOPFA and 9 had information on LB and SB but not on ETOPFA. Three registers (Iran, Israel, and Nuevo Leon) provided no information on either SB or ETOPFA, thus were excluded from the calculation of total prevalence rates. Data on mosaicism were not available in individual cases for this study. Table 2 provides details on the type and duration of follow-up of the surviving LB in the individual registers.
TABLE 1.
Trisomy 13 and 18 mortality surveillance period by continent, country, and register (ICBDSR 1974–2015)
| Continent | Country | Register | Type of program | Maximum age at diagnosis | ETOPFAreported/allowed | Period of study | Total years | Trisomy 13 n | Trisomy 18 n |
|---|---|---|---|---|---|---|---|---|---|
| S. America | Argentina | RENAC | Hospital-based | Hospital discharge | Not allowed | 2009–2014 | 6 | 42 | 119 |
| Colombia | Bogota | Hospital-based | Hospital discharge | Not reported~ | 2001–2014 | 14 | 24 | 28 | |
| Cali | Hospital-based | Hospital discharge | Not reported~ | 2011–2014 | 4 | - | 7 | ||
| S. America | ECLAMC | Hospital-based | Hospital discharge | Not allowed | 1995–2014 | 20 | 237 | 538 | |
| Europe | Czech rep | NR | Population-based | Upto 15 years | Yes | 1994–2014 | 21 | 150 | 469 |
| France | Paris | Population-based | 28 days | Yes | 1981–2014 | 34 | 251 | 736 | |
| Germany | Saxony-Anhalt | Population-based | 1 year | Yes | 1980–2014 | 35 | 43 | 125 | |
| Italy | Lombardy | Population-based | 6 years | Yes | 2003–2012 | 10 | 17 | 58 | |
| Tuscany | Population-based | 1 year | Yes | 1992–2014 | 23 | 88 | 252 | ||
| Malta | MCAR | Population-based | 1 year | Not allowed | 1995–2013 | 19 | 6 | 29 | |
| Netherlands | North | Population-based | 10 years | Yes | 1991–2014 | 34 | 78 | 239 | |
| Slovakia | STIC | Population-based | 1 year | Yes | 2001–2013 | 13 | 30 | 51 | |
| Spain-ECEMC | With TOPFA | Hospital-based | 3 days | Since 1985 and reported** | 1995–2013 | 19 | 93 | 238 | |
| No TOPFA | Hospital-based | 3 days | Since 1985 and not reported | 1986–2013 | 28 | 91 | 150 | ||
| Sweden | No TOPFA | Population-based | 28 days*** | Not allowed | 1974–1998 | 25 | 154 | 133 | |
| With TOPFA | Population-based | 1 year | Since 1999 | 1999–2014 | 16 | 485 | 1,202 | ||
| Ukraine* | OMNI-net | Population-based | 1 year | Yes | 2000–2013 | 14 | 25 | 27 | |
| UK | Wales CARIS | Population-based | Upto 18 years | Yes | 1998–2014 | 17 | 117 | 310 | |
| N. America | Mexico | Nuevo Leon | Population-based | 6 days | Not allowed | 2011–2015 | 5 | 22 | 61 |
| RYVEMCE | Hospital-based | 3 days | Not allowed | 1979–2013 | 36 | 37 | 58 | ||
| USA | Arkansas | Population-based | 2 years | Yes | 1993–2012 | 20 | 81 | 167 | |
| Atlanta | Population-based | 6 years | Yes | 1974–2008 | 35 | 213 | 415 | ||
| Texas | Population-based | 1 year | Yes | 1996–2012 | 17 | 716 | 1,517 | ||
| Utah | Population-based | 2 years | Yes | 1994–2012 | 19 | 150 | 316 | ||
| Asia | Iran | TROCA | Hospital-based | 1 year | Not reported | 2008–2012 | 5 | 6 | 7 |
| Israel | IBDSP | Hospital-based | Hospital discharge | Not reported | 2000–2014 | 15 | 14 | 11 |
Note: ETOPFA, elective termination of pregnancies for fetal anomalies; n, number of cases reported;
Data only available from 1995 onwards;
After 1987 till 1 year;
ETOPFA legal since 2006;
Name of Register: RENAC, National Network of Congenital Anomalies of Argentina; ECLAMC, Latin American Collaborative Study of Congenital Malformations; NR, National Register; MCAR, Malta Congenital Anomalies Registry; STIC, Slovak Teratology Information Center; ECEMC, Spanish Collaborative Study of Congenital Malformations;
OMNI-Net = Ukraine Birth Defects Prevention Program (Rivne [for T13 and T18] and Volyn [for T18 only] Provinces); CARIS, Congenital Anomaly Register & Information Systems for Wales, UK; RYVEMCE, Mexican Registry and Epidemiological Surveillance of External Congenital Malformations; TROCA, Tabriz Registry of Congenital Anomalies; IBDSP, Israel birth defect surveillance and research program; UK, United Kingdom; USA, United States of America.
TABLE 2.
Description of follow-up methods for live births from registers contributing to the ICBDSR
| Country-register | Follow-up until discharge from the maternity hospital | Follow-up by a clinician or registry staff | Linkage with death certificates | Maximum follow-up period reported in study |
|---|---|---|---|---|
| Argentina-RENAC | Yes | Yes | No | 1–6 days |
| Colombia-Bogotá | Yes | Yes | No | 1 day |
| Colombia-Cali | Yes | Yes | No | No mortality reported for live births |
| South America—ECLAMC | Yes | Yes | No | 28 days-11 months |
| Czech Republic—NR | No | No | Yes | ≥5 years |
| France-Paris | Yes | Yes | No | 7–27 days |
| Germany-Saxony-Anhalt | Yes | Yesa | No | 1–5 years |
| Italy-Lombardy | No | No | Yes, 2003 up to 2015 | 1–4 years |
| Italy-T uscany | No | No | Yes, 1992 up to 2015 | 28 days-11 months |
| Malta-MCAR | Yesb | Yes | Yesc | 1–4 years |
| Netherlands-northern | Yes | Yes | No | ≥5 years |
| Slovak Republic—STIC | Yes | No | No | 1–6 days |
| Spain-ECEMC | Yes | No | No | 1–6 days |
| Sweden | No | No | Yes, 1974 up to April 2016 | ≥5 years |
| UK-Wales—CARIS | Yes | No | Yes, to GP system, till 18 years | ≥5 years |
| Ukraine-OMNI-Net* | Yes | Yes | No | 1–5 years |
| Mexico-Nuevo León | Yes | No | No | 1 year |
| Mexico-RYVEMCE | Yes | No | No | 1–6 days |
| USA-Arkansas | Yes | No | Yes, 1993 up to 2015 | ≥5 years |
| USA-Atlanta | Yes | No | Yes, 1979 up to 2008 | ≥5 years |
| USA-Texas | Yes | No | Yes, 1996 up to 2013 | ≥5 years |
| USA-Utah | Yes | No | Yes, until age 2 | ≥5 years |
| Iran-TROCA | Yes | Yesd | No | 1–6 days |
| Israel-IBDSP | Yes | No | Yes, 2000 up to 2014 | 1–4 years |
Note: Name of Register: RENAC, National Network of Congenital Anomalies of Argentina; ECLAMC, Latin American Collaborative Study of Congenital Malformations; NR, National Register; MCAR, Malta Congenital Anomalies Registry; STIC, Slovak Teratology Information Center; ECEMC, Spanish Collaborative Study of Congenital Malformations;
OMNI-Net, Ukraine Birth Defects Prevention Program (Rivne [for T13 and T18] and Volyn [for T18 only] Provinces); CARIS, Congenital Anomaly Register and Information Systems for Wales, UK; RYVEMCE, Mexican Registry and Epidemiological Surveillance of External Congenital Malformations; TROCA, Tabriz Registry of Congenital Anomalies; IBDSP, Israel birth defect surveillance and research program; UK, United Kingdom; USA, United States of America.
Until 18 years.
Babies are followed up until discharge and their hospital files are again seen at 1 year of age, linkage with mortality data continues indefinitely.
Continuous linkage with mortality register.
Children in university hospital(s).
4.1 |. Trisomy 13
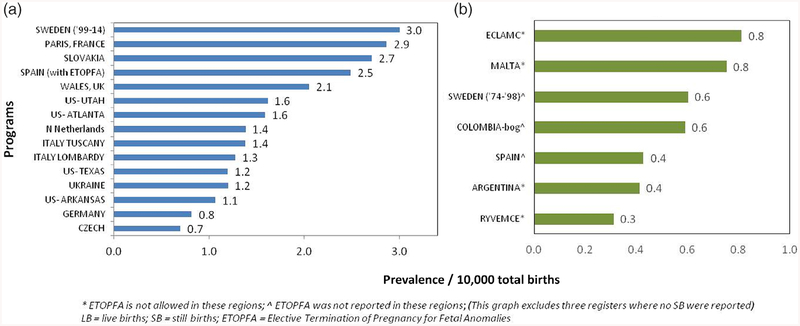
Among the 20 registers with information on T13 cases and LB and SB, there were 27,128,565 births and 3,128 T13 cases, resulting in a total prevalence of 1.15 per 10,000 total births. After limiting analysis to the 15 registers with information on LB, SB, and ETOPFA (16,793,914 births and 2,537 cases of T13), the mean total prevalence was 1.68 per 10,000 births (95% CI 1.3–2.06). This ranged from the highest reported prevalence of 3.0 from the Swedish register (1999–2014) to the lowest prevalence of 0.7 and 0.8 per 10,000 total births, from Czech and German registers, respectively (Figure 1a). Figure 1b shows the prevalence rates of less than 1/10,000 with a mean of 0.56 (95% CI ± 0.17) per 10,000 births, from the seven registers where only LB and SB were reported.
FIGURE 1.
Total prevalence data for Trisomy 13 (1974–2015) from all registers (a) with complete data on LB, SB, and ETOPFA; (b) with data only on LB and SB. ETOPFA, elective termination of pregnancy for fetal anomalies; LB, live births; SB, stillbirths
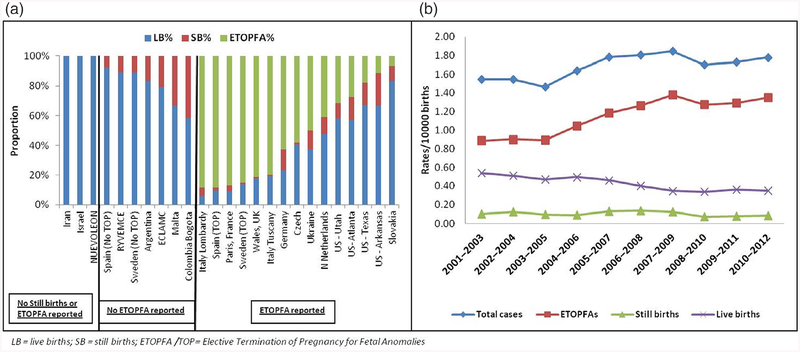
Figure 2a shows T13 pregnancies outcomes (LB, SB, or ETOPFA), across all registers. The proportion of ETOPFA performed was observed to be highest in the European registries. In countries where ETOPFA is not allowed, the proportion of LB was high, as would be expected. Data were most complete from 2001 to 2012, so this period was used to calculate prevalence rates. Three-year rolling averages in registers where complete information on LB, SB, and ETOPFA was available from 2001 to 2012 are shown in Figure 2b.
FIGURE 2.
(a) Pregnancy outcomes in all registers in Trisomy 13 between 1974 and 2015; (b) Three-year rolling averages for prevalence of Trisomy 13 in registers where ETOPFA is reported (2001–2012). ETOPFA, elective termination of pregnancy for fetal anomalies
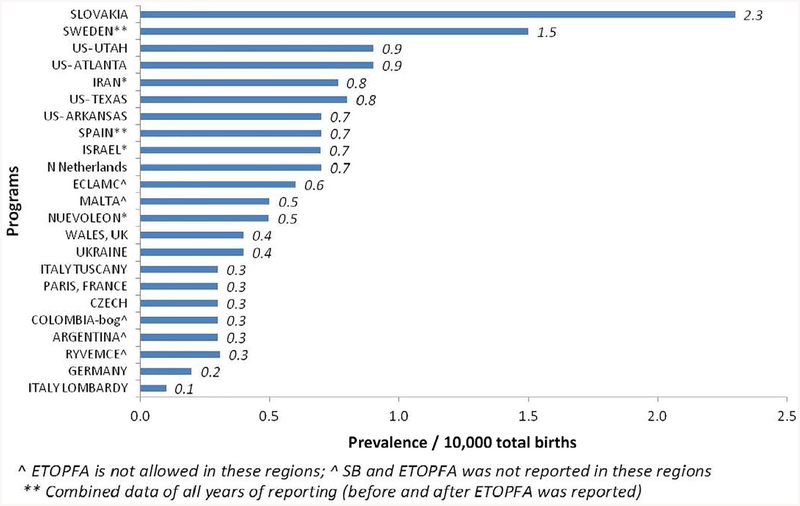
Figure 3 shows the countries and registers arranged in order of decreasing LB prevalence per 10,000 total births (range 0.1–2.3). The mean LB prevalence was 0.55 per 10,000 total births (95% CI 0.38–0.72), with a range from 0.1 (from Italy-Lombardy) to 2.3 (from Slovakia).
FIGURE 3.
Live birth prevalence in all registers in Trisomy 13 (1974–2015)
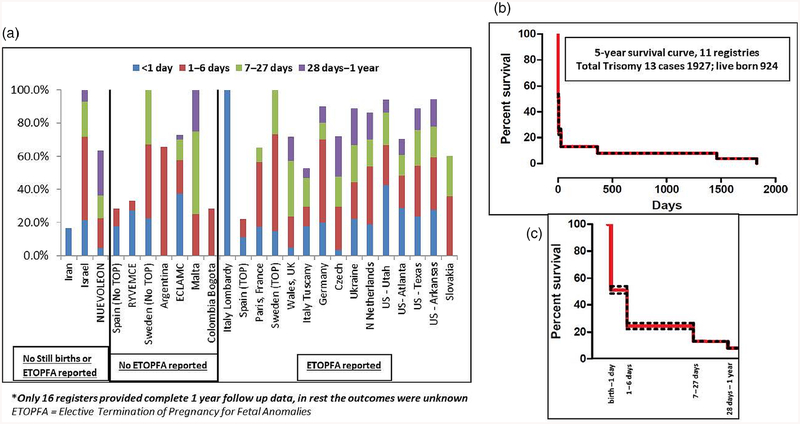
Figure 4a shows the spectrum of first year mortality among LB for the entire surveillance period for all registers. The median first week mortality was 48% across all registers; first week mortality was highest in Israel (71%), Germany (70%), and USA-Utah (67%). Overall, nearly half of the first week mortality occurred on the first day. The median first year mortality in LB was 87% across 16 registers where complete 1-year follow-up data were available—it was highest (94–100%) in Israel, Sweden, Malta, USA-Arkansas, and USA-Utah. Eleven registers had 5-year follow-up data, as shown in Figure 4b,c. The cumulative 5-year survival for these registers was about 7% (95% CI 0.02–10.02%).
FIGURE 4.
Mortality in live births (Trisomy 13). (a) One-year follow-up data in all registers*; (b) Five-year follow-up in registers where outcomes were known; (c) First year mortality from (b) shown in further detail (dotted line represent 95% CI)
Available data from 15 registers (data not shown) reported that cases associated with major birth defects in addition to T13 resulted in a higher proportion of SB than those without any major birth defects (6.7% vs. 4.2%, p = 0.03). Ten registers reported ETOPFA and data on associated major birth defects. Of these, 48.9% T13 cases with birth defects underwent terminations; in comparison, 79.9% T13 cases without any major birth defects were terminated.
4.2 |. Trisomy 18
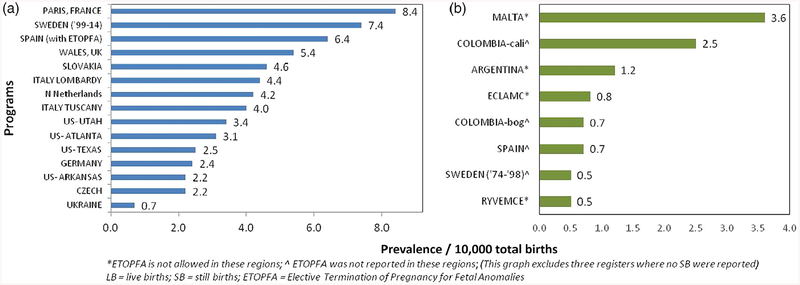
Among the 21 registers with information on T18 cases and LB and SB, there were 27,344,386 births and 7,184 T18 cases, resulting in a total prevalence of 2.63 per 10,000 total births. After limiting analysis to the 15 registers with information on LB, SB, and ETOPFA (16,982,171 births and 6,122 cases of T18), the mean total prevalence was 4.08 per 10,000 births (95% CI 3.01–5.15). This ranged from the highest reported prevalence of 8.4 from the Paris register and to the lowest prevalence of 0.7 per 10,000 total births from Ukraine register (Figure 5a). Figure 5b shows the prevalence rates of mean of 1.31 (95% CI ± 0.94) per 10,000 births, from the eight registers where ETOPFA were not reported.
FIGURE 5.
Total prevalence data for Trisomy 18 (1974–2015) from all registers (a) with complete data on LB, SB, and ETOPFA; (b) with data only on LB and SB. ETOPFA, elective termination of pregnancy for fetal anomalies; LB, live births; SB, stillbirths
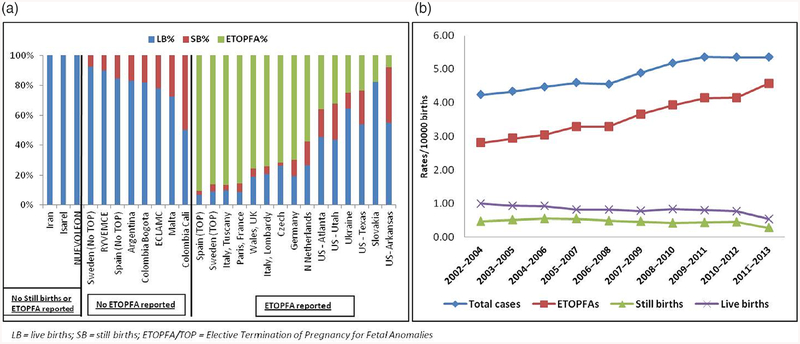
Figure 6a shows T18 pregnancies outcomes (LB, SB, or ETOPFA), across all registers. The proportion of ETOPFA performed was observed to be highest in the European registries. In countries where ETOPFA is not allowed, the proportion of LB was understandably high. Data were the most complete from 2002 to 2013, so this time-period was used to calculate prevalence rates. Three-year rolling averages in registers where complete information on LB, SB, and ETOPFA was available from 2002 to 2013 are shown in Figure 6b.
FIGURE 6.
(a) Pregnancy outcomes in all registers in Trisomy 18 between 1974 and 2015; (b) Three-year rolling averages for prevalence of Trisomy 18 in registers where ETOPFA is reported (2002–2013). ETOPFA, elective termination of pregnancy for fetal anomalies
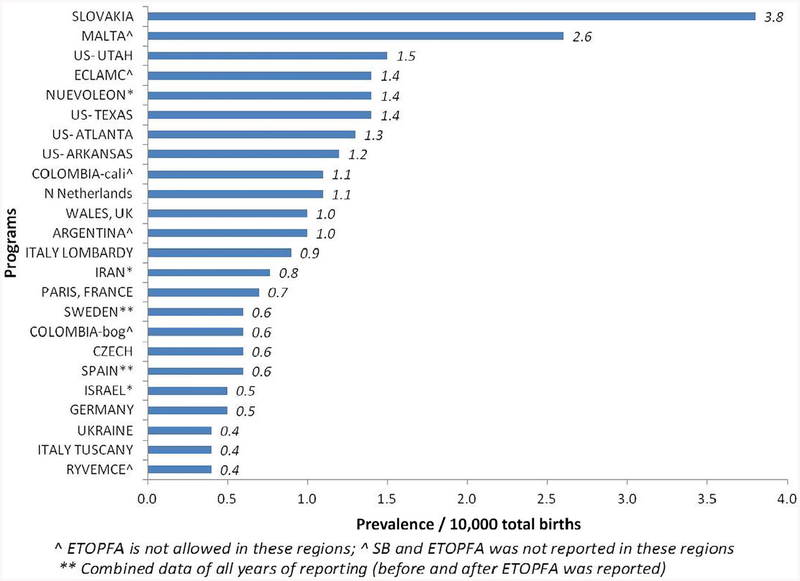
Figure 7 shows the countries and registers arranged in order of decreasing LB prevalence per 10,000 total births (range 0.4–3.8). The mean LB prevalence was 1.07 per 10,000 total births (95% CI 0.77–1.38), with a range from 0.4 (from Mexico-RYVEMCE) to 3.8 (from Slovakia).
FIGURE 7.
Live birth prevalence in all registers in Trisomy 18 (1974–2015)
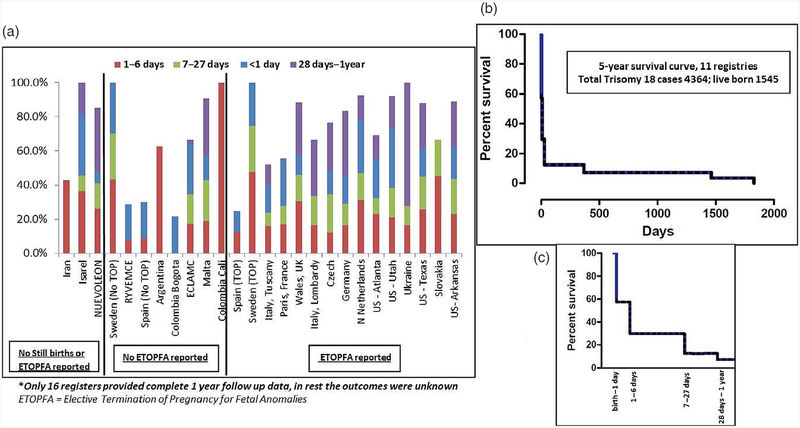
Figure 8a shows the spectrum of first year mortality among LB for the entire surveillance period for all registers. The median first week mortality was 42% across all registers—it was highest in Sweden (73%), Israel (73%), and Argentina (63%). Nearly half of the first week mortality occurred on the first day. The median first year mortality in LB was 88% across 16 registers where complete 1-year follow-up data were available—it was 100% in Israel, Sweden, Colombia-Cali, and Ukraine. Eleven registers had 5-year follow-up data, as shown in Figure 8b,c. The cumulative 5-year survival for these registers was7.7% (95% CI 3.97–14.21%).
FIGURE 8.
Mortality in live births (Trisomy 18). (a) One-year follow-up data in all registers*; (b) Five-year follow-up in registers where outcomes were known; (c) First year mortality from (b) shown in further detail (dotted line represent 95% CI)
Available data from 15 registers (data not shown) reported that cases associated with major birth defects in addition to T18 resulted in a higher proportion of SB than those without any major birth defects (12.6% vs. 6.5%, p < .0001). Ten registers reported ETOPFA and data on associated major birth defects. Of these, 56.3% T18 cases with birth defects underwent terminations; in comparison, 84% T18 cases without any major birth defects were terminated.
5 |. DISCUSSION
This study assessed prevalence in total births, pregnancy outcomes, and mortality among LB, in T13 and T18 cases, across 24 registers and 18 countries using a standardized protocol. The quality of data reported varied as three registers only reported LB, while nine did not have information on ETOPFA. Although the data from some registers goes back as far as 1974, most of the data were consistently provided between years 2001 and 2014.
The total prevalence of T13 was 1.15 in the 20 registers and T18 was 2.63 in the 21 registers, per 10,000 total births that included LB and SB (with or without ETOPFA). Total prevalence was 1.68 and 4.08 per 10,000 total births, respectively, in the 15 registers that also report ETOPFA. This is slightly less than the previously reported prevalence estimates of 1.9–2.8 and 4.8–7 per 10,000 births, respectively, from United Kingdom and Europe (Loane et al., 2013; Springett et al., 2015; Springett & Morris, 2014; Tonks et al., 2013). Our estimates may reflect the regional variation due to the differences in maternal age, but is more likely to reflect differences in reporting. Registers that did not report SB and/or ETOPFA had the lowest prevalence, which is expected as the cases ending in a SB or ETOPFA were excluded. This may also reflect the overall quality of reporting, as including spontaneous fetal losses improves the quality of data in congenital anomaly reporting (Leoncini et al., 2010).
In this study, the live birth prevalence of T13 was 0.55 and of T18 was 1.07 per 10,000 births including data from all registers. This is similar to that reported in other studies (Loane et al., 2013). As expected, in the countries/regions where ETOPFA is not allowed, the LB prevalence was higher.
Three-year rolling averages, obtained from the registers reporting all pregnancy outcomes, showed a gradual rise in total prevalence of cases along with a corresponding rise in ETOPFA, a decrease in LB, and a similar number of SB. These findings may be attributed to increasing maternal age (Loane et al., 2013; Nair et al., 2015), improved reporting, earlier detection with prenatal screening programs, and parents opting for elective termination of pregnancy.
Almost half of the mortality in LB occurred within the first week and 87–88% by the first year in both T13 and T18. However, 1 out of 10 cases of T13 and T18 did survive the first year. This is in agreement with the survival rates reported in other studies (Meyer et al., 2016; Wu et al., 2013). Earlier studies reported lower 1-year survival rates of under 10% (Brewer, 2002; Irving, Richmond, Wren, Longster, & Embleton, 2010; Rasmussen et al., 2003). Data on mosaicism in individual cases were not available, which may have accounted for some of the survivors. The cumulative 5-year survival rate of around 7% for T13 and 7.7% for T18 was slightly lower than that recently reported (Meyer et al., 2016 Nelson, Rosella, Mahant, & Guttmann, 2016), however the confidence intervals were very wide.
The registers provided data on the presence of major birth defects associated with the prenatal diagnosis of T13 and T18. As expected, pregnancies with major birth defects in addition to T13 or T18 resulted in more SB. Interestingly, in cases with isolated diagnosis of T13 or T18; more terminations were reported than in those with associated birth defects. This has been reported previously (Springett et al., 2015) and it may be a result of under-reporting of anomalies in cases where terminations were performed before diagnoses of major anomalies were made and no pathology was undertaken.
Despite the poor prognosis for T13 and T18, there have been recent reports of long-term survival of more than 5 years age (Janvier, Farlow, & Barrington, 2016; Janvier, Farlow, & Wilfond, 2012; Meyer et al., 2016; Wu et al., 2013). Growing evidence has shown that medical and surgical interventions can prolong survival (Domingo, Carey, Eckhauser, Wilkes, & Menon, 2018; Josephsen, Armbrecht, Braddock, & Cibulskis, 2016; Kaneko et al., 2008; Kosho, Kuniba, Tanikawa, Hashimoto, & Sakurai, 2013; Nelson et al., 2016; Nelson, Hexem, & Feudtner, 2012; Tsukada, Imataka, Suzumura, & Arisaka, 2012). Regional variations in screening and care for infants with T13 or T18 and differences in public, parental, or professional perceptions pose ethical challenges for parents and professionals when encountering a prenatal diagnosis. Cases of longer-term survival, reports of increased median survival times associated with more interventions, and readily accessible online patient support groups have influenced attitudes (Janvier et al., 2012, 2016; Kosho et al., 2013).
This study has limitations concerning heterogeneity and completeness of the data received from various registers. Information was received from hospital and population-based registers, the former representing a selected population, whereas the latter represents the whole region. Another limitation is the possible inclusion of some probable cases not confirmed by karyotype. This number is expected to be small and has decreased markedly in recent years with the advent of fetal anomaly ultrasound screening and increased access to a karyotyping service. There was no information on mosaicism, which could have effect on survival figures, as individuals with mosaicism of T13 and T18 have better survival chances (Wu et al., 2013). Despite these limitations, this study provides an invaluable global perspective over the years on the prevalence, pregnancy outcomes, and survival of live born infants with T13 and T18. The prevalence and outcome results highlight the variation in data collection and management practices in this condition across different regions.
ACKNOWLEDGMENTS
Results from Slovakia originated in cooperation with National Health Information Center in Bratislava. The work conducted at the ECEMC group was supported by the Instituto de Salud Carlos III (ISCIII, Ministry of Science, Innovation and Universities) of Spain, and the Fundación 1000 sobre Defectos Congénitos of Spain. Components of ECEMC’s Peripheral Group are gratefully acknowledged.
Footnotes
CONFLICT OF INTEREST
The authors declare no potential conflict of interest.
Publisher's Disclaimer: DISCLAIMER
The findings and conclusions in this report are those of the authors and do not necessarily represent the official position of the Centers for Disease Control and Prevention. This analysis has been replicated by Joan K. Morris. We can declare that Dr. Saeed Dastgiri is the Programme Director of TROCA, a hospital-based register (a member of ICBDSR and EUROCAT), sole purpose of which is medical research and to collect data on birth defects. Dr. Dastgiri is not acting as an official representative or on behalf of the Government.
DATA AVAILABILITY STATEMENT
The data that support the findings of this study are available from the corresponding author upon reasonable request, with the permission of the ICBDSR group.
REFERENCES
- Brewer CM (2002). Survival in trisomy 13 and trisomy 18 cases ascertained from population based registers. Journal of Medical Genetics, 39(9), 54e–554e. 10.1136/jmg.39.9.e54 [DOI] [PMC free article] [PubMed] [Google Scholar]
- Domingo L, Carey JC, Eckhauser A, Wilkes J, & Menon SC (2018). Mortality and resource use following cardiac interventions in children with trisomy 13 and trisomy 18 and congenital heart disease. Pediatric Cardiology, 40, 349–356. 10.1007/s00246-018-2001-x [DOI] [PubMed] [Google Scholar]
- ICBDSR. (2014). Annual report. Retrieved from http://www.icbdsr.org/wpcontent/annual_report/Report2014.pdf.
- Irving C, Richmond S, Wren C, Longster C, & Embleton ND (2010). Changes in fetal prevalence and outcome for trisomies 13 and 18: A population-based study over 23 years. The Journal of Maternal-Fetal & Neonatal Medicine, 24(1), 137–141. 10.3109/14767051003758879 [DOI] [PubMed] [Google Scholar]
- Janvier A, Farlow B, & Barrington KJ (2016). Parental hopes, interventions, and survival of neonates with trisomy 13 and trisomy 18. American Journal of Medical Genetics. Part C, Seminars in Medical Genetics, 172(3), 279–287. 10.1002/ajmg.c.31526 [DOI] [PubMed] [Google Scholar]
- Janvier A, Farlow B, & Wilfond BS (2012). The experience of families with children with trisomy 13 and 18 in social networks. Pediatrics, 130(2), 293–298. 10.1542/peds.2012-0151 [DOI] [PubMed] [Google Scholar]
- Josephsen JB, Armbrecht ES, Braddock SR, & Cibulskis CC (2016). Procedures in the 1st year of life for children with trisomy 13 and trisomy 18, a 25-year, single-center review. American Journal of Medical Genetics. Part C, Seminars in Medical Genetics, 172(3), 264–271. 10.1002/ajmg.c.31525 [DOI] [PubMed] [Google Scholar]
- Kaneko Y, Kobayashi J, Yamamoto Y, Yoda H, Kanetaka Y, Nakajima Y, … Kawakami T (2008, June 1). Intensive cardiac management in patients with trisomy 13 or trisomy 18. American Journal of Medical Genetics Part A, 146A(11), 1372–1380. [DOI] [PubMed] [Google Scholar]
- Kosho T, Kuniba H, Tanikawa Y, Hashimoto Y, & Sakurai H (2013). Natural history and parental experience of children with trisomy 18 based on a questionnaire given to a Japanese trisomy 18 parental support group. American Journal of Medical Genetics. Part A, 161A(7), 1531–1542. 10.1002/ajmg.a.35990 [DOI] [PubMed] [Google Scholar]
- Leoncini E, Botto LD, Cocchi G, Anneren G, Bower C, Halliday J, … Mastroiacovo P (2010). How valid are the rates of down syndrome internationally? Findings from the international clearinghouse for birth defects surveillance and research. American Journal of Medical Genetics. Part A, 152A(7), 1670–1680. 10.1002/ajmg.a.33493 [DOI] [PubMed] [Google Scholar]
- Loane M, Morris JK, Addor MC, Arriola L, Budd J, Doray B, … Dolk H (2013). Twenty-year trends in the prevalence of down syndrome and other trisomies in Europe: Impact of maternal age and prenatal screening. European Journal of Human Genetics, 21(1), 27–33. 10.1038/ejhg.2012.94 [DOI] [PMC free article] [PubMed] [Google Scholar]
- Meyer RE, Liu G, Gilboa SM, Ethen MK, Aylsworth AS, Powell CM, … National Birth Defects Prevention, N. (2016). Survival of children with trisomy 13 and trisomy 18: A multi-state population-based study. American Journal of Medical Genetics. Part A, 170A(4), 825–837. 10.1002/ajmg.a.37495 [DOI] [PMC free article] [PubMed] [Google Scholar]
- Nair DB, Tucker D, Hughes R, Greenacre J, & Morgan M (2015). Unusual trend in the prevalence of trisomy 13 in mothers aged 35 and older: A population based study of national congenital anomaly data. Birth Defects Research. Part A, Clinical and Molecular Teratology, 103(7), 610–616. 10.1002/bdra.23336 [DOI] [PubMed] [Google Scholar]
- Nelson KE, Hexem KR, & Feudtner C (2012). Inpatient hospital care of children with trisomy 13 and trisomy 18 in the United States. Pediatrics, 129(5), 869–876. 10.1542/peds.2011-2139 [DOI] [PubMed] [Google Scholar]
- Nelson KE, Rosella LC, Mahant S, & Guttmann A (2016). Survival and surgical interventions for children with trisomy 13 and 18. JAMA, 316(4), 420–428. 10.1001/jama.2016.9819 [DOI] [PubMed] [Google Scholar]
- Pont SJ, Robbins JM, Bird TM, Gibson JB, Cleves MA, Tilford JM, & Aitken ME (2006). Congenital malformations among liveborn infants with trisomies 18 and 13. American Journal of Medical Genetics. Part A, 140(16), 1749–1756. 10.1002/ajmg.a.31382 [DOI] [PubMed] [Google Scholar]
- Rasmussen SA, Wong LY, Yang Q, May KM, & Friedman JM (2003). Population-based analyses of mortality in trisomy 13 and trisomy 18. Pediatrics, 111(4 Pt 1), 777–784. [DOI] [PubMed] [Google Scholar]
- Savva GM, Walker K, & Morris JK (2010). The maternal age-specific live birth prevalence of trisomies 13 and 18 compared to trisomy 21 (down syndrome). Prenatal Diagnosis, 30(1), 57–64. 10.1002/pd.2403 [DOI] [PubMed] [Google Scholar]
- Springett A, Wellesley D, Greenlees R, Loane M, Addor MC, Arriola L, … Morris JK (2015). Congenital anomalies associated with trisomy 18 or trisomy 13: A registry-based study in 16 European countries, 2000–2011. American Journal of Medical Genetics Part A, 167A(12), 3062–3069. 10.1002/ajmg.a.37355 [DOI] [PubMed] [Google Scholar]
- Springett AL, & Morris JK (2014). Antenatal detection of Edwards (trisomy18) and Patau (trisomy 13) syndrome: England and Wales 2005–2012. Journal of Medical Screening, 21(3), 113–119. 10.1177/0969141314543128 [DOI] [PubMed] [Google Scholar]
- Tonks AM, Gornall AS, Larkins SA, & Gardosi JO (2013). Trisomies 18 and 13: Trends in prevalence and prenatal diagnosis—Population based study. Prenatal Diagnosis, 33(8), 742–750. 10.1002/pd.4117 [DOI] [PubMed] [Google Scholar]
- Tsukada K, Imataka G, Suzumura H, & Arisaka O (2012). Better prognosis in newborns with trisomy 13 who received intensive treatments: A retrospective study of 16 patients. Cell Biochemistry and Biophysics, 63(3), 191–198. 10.1007/s12013-012-9355-0 [DOI] [PMC free article] [PubMed] [Google Scholar]
- Wu J, Springett A, & Morris JK (2013). Survival of trisomy 18 (Edwards syndrome) and trisomy 13 (Patau syndrome) in England and Wales: 2004–2011. American Journal of Medical Genetics Part A, 161A(10), 2512–2518. 10.1002/ajmg.a.36127 [DOI] [PubMed] [Google Scholar]


