Abstract
Proteolytic enzymes are often strongly affected by redox reactions, free radicals, oxidation, or oxidative stress. The 20S Proteasome and the Immuno-Proteasome are examples of major intracellular proteases whose concentration, transcription, translation, and proteolytic activity are all subject to redox regulation. Proteasomes are essential in maintaining overall protein homeostasis (or proteostasis), and their dysregulation results in detrimental phenotypes associated with various pathologies, including several common age-related diseases. Many studies have used Western blots to assess redox changes in Proteasome protein levels or RT-PCR to study RNA transcript levels, but actual measurements of proteolytic activity are far less common. Since each intact protein substrate exhibits a different proteolytic profile when incubated with proteasome or Immuno-Proteasome [± activators such as 19S or 11S (also called PA28)] and these proteolytic profiles are drastically altered if the protein substrate is denatured, for example by oxidation, heat, acetylation, or methylation. In an attempt to standardize proteasomal activity measurements small fluorogenic protein/peptide substrates were developed to test the three proteolytically active sites of the Proteasome and Immuno-Proteasome: trypsin-like, chymotrypsin-like, and caspase-like activities. Despite extensive use of fluorogenic peptide substrates to measure proteasome activity, there is an absence of a standardized set of best practices. In this study we analyze different parameters, such as sample concentration, AMC conjugated substrate concentration, duration of assay, and frequency of measurements, and examine how they impact the determination of Proteasome and Immuno-Proteasome activities using fluorogenic peptide substrates.
Keywords: Proteasome, Immuno-Proteasome, Redox Regulation, Fluoropeptides, Proteolytic Activity, Proteostasis, Methods
Graphical Abstract
Introduction
Changes in proteolytic enzymes frequently accompany exposure to various forms of oxidative stress, or adaptation to free radicals, oxidants, or redox fluctuation. Such changes are often assessed by increases or decreases in the levels of protease protein, typically by Western blot, or by increases or decreases in the levels of protease gene RNA transcripts [1–3]. Although such measures are important, they do not necessarily accurately reflect actual proteolytic activity. Alterations in the capacity to degrade an oxidized versus a natural form of a particular protein typically involve protein purification and labeling techniques that can provide very valuable data [4–6], but are typically more detailed and specific than most investigations require. The solution for many laboratories, that may be studying multiple effects of free radicals, oxidative stress, or other cellular perturbations, is to measure changes in the degradation of labeled peptides that have been designed as specific or selective substrates for individual proteolytic enzymes, or classes of proteases. In particular, the use of so called, ‘fluorogenic peptides’ has become widespread [7–11]
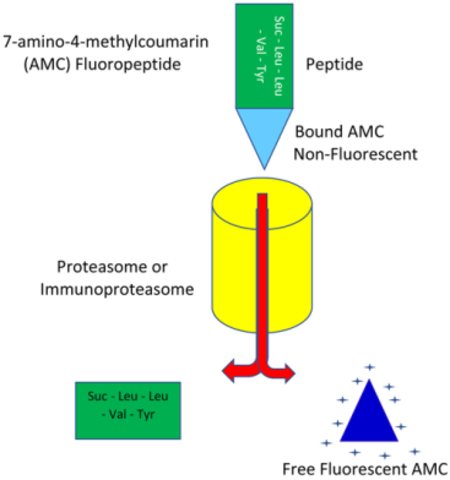
In the 1970’s Zimmerman et al established the fluorogenic substrate 7-amino-4-methylcoumarin (AMC) covalently linked by a peptide bond to small peptide as a new method to measure proteolytic activity [12, 13]. These studies illustrated that AMC conjugated substrates were a more accurate and sensitive method to measure proteolytic activity than the then widely used nitroanilides. Since their original development, AMC conjugated substrates have been adopted as the standard measure of proteolytic activity [7–11, 14–17]. AMC conjugated substrates are comprised of a specific short amino acid sequence linked by a peptide bond to an AMC fluorophore. While attached the fluorophore remains inactive, but once proteolytically cleaved, the fluorophore emits a measurable fluorescent signal given the appropriate excitation wavelength. By specifying the amino acid sequence conjugated to AMC, specific proteases can be measured based on their preferred cleavage sites. The AMC fluorophore is also highly stable and resistant to changes in oxidative stress, pH, temperature and reducing agents [5], which allows reliable measurements even under stress conditions.
Although appropriately designed fluorogenic peptides can be used to measure the activity of any proteolytic enzyme, the Proteasome is certainly one of the most studied and perhaps one of the most affected by redox fluctuations involving free radicals, oxidants, or oxidative stress ([18–22]. The Proteasome is a multi-subunit complex with several conformations, each with distinct proteolytic activities. The simplest or core form of proteasome is an approximately 750 kDa cylindrical structure, composed of four protein rings. This core proteasome which is known as the 20S proteasome, contains two α rings and two β rings in the order: αββα. The two α rings each contain seven distinct α proteins (with MWs of 21–32 kD. Each encoded by a different gene) and the two β rings each contain seven distinct β proteins (again with MWs of 21–32 kD. each encoded by a different gene). The well-known 26S (approximately 2,000kDa) proteasome is formed by combining a 19S (PA700) activator at each end of the 20S proteasome cylinder. The 26S Proteasome, is the only variant which selectively degrades ubiquitinylated proteins in an ATP-dependent manner [18]. In contrast, the 20S Proteasome (± 11S or PA28 activators) is responsible for degrading oxidatively damaged proteins, fundamental for maintaining proper proteostasis and normal cellular function [23]. Another Proteasome conformation is the Immuno-Proteasome, which was originally identified for its role in generating peptides for antigen presentation during an immune response [24, 25]. However, recently the Immuno-Proteasome (± 11S or PA28 activators) has also been further characterized as a highly inducible proteasome conformation associated with selectively degrading oxidatively damaged proteins [26].
Together, the various Proteasome conformations play critical roles in maintaining proteostasis. The ability to maintain proteolytic activity is central to many biological processes, and dysregulation of this activity results in pathologies associated with aging, cancers, and neurological diseases [27–30]. As a result, the ability to accurately measure Proteasome activity with a standardized protocol that can facilitate crossstudy comparisons is key to assessing the efficacy of core biological processes.
There is however, a lack of consensus regarding how to analyze and measure Proteasome activity. Many studies follow a uniform protocol, outlined by reagent suppliers. The ubiquitous use of AMC-conjugated substrates has resulted in the assumption that simply applying a standard cookbook approach is sufficient for an appropriate measurement. Therefore, many studies omit critical details in their methods such as AMC substrate concentration, concentration of sample protein loaded, or even the duration of the fluorogenic assay employed. Some studies measure Proteasome activity as only an endpoint value, which can lead to inappropriate assumptions about proteolytic capacity, particularly when the rate of reaction may vary significantly throughout the course of an experiment.
Even when substrate and sample concentrations, reaction times, and other variables follow a standard protocol, calculating and interpreting the data varies widely across different studies. Often, these values are represented in arbitrary units, which makes cross study comparisons difficult. Standardizing proteolytic values to easily convertible units would facilitate the comparison of results across studies and sample types.
Previously, Lima and Rattan put forth a very useful protocol on standard practices to measure Proteasome activity [31] and we certainly endorse their approach. Our study aims to build on these guidelines and to incorporate several other key factors that can greatly augment the existing framework to form a protocol of best practices. These include optimization of protein loading concentrations, AMC substrate concentrations, and the duration of measurements.
Materials and Methods
Cells
Murine embryonic fibroblast cells (MEFs) (Sigma-Aldrich), Wi38 lung fibroblast cells (ATCC) and small airway epithelial cells (SAECs) (Lifeline Cell Technology) were used. MEFs were grown in DMEM 4.5 g/L glucose (Corning cellgro) supplemented with Fetal Bovine Serum (FBS) at 10%. Wi38 lung fibroblasts were grown with EMEM (ATCC) with L-glutamine supplemented with FBS at 15%, and SAECs were grown in Bronchialife complete medium (Lifeline Cell Technology). An antibiotic-antimycotic cocktail (Corning) was added to all mediums at a final volume of 1%. All three cell lines were cultured at 37°C, 21% O2 and 5% CO2.
Cells were grown to 80–90% confluence and then collected. Cells were then scraped using ice-cold phosphate buffered saline (PBS) and centrifuged for 5 minutes at 5,000 rfc. The resulting pellets were resuspended in proteolysis buffer, (50 mM Tris HCl, 25 mM KCl, 10 mM NaCl, 1 mM MgCl2, 0.1 mM 1,4-Dithiothreitol) and subjected 3 times to a 5-min-freeze/5-min-thaw cycle. The freeze/thaw was performed repeatedly by alternately placing samples in dry ice, then in a room-temperature water bath 3 times. The samples were then centrifuged for 10 minutes at 10,000 rcf to pellet debris and the supernatant was collected for protein quantification. Protein concentrations were determined by BCA assay (Thermo Scientific).
AMC-conjugated substrates
AMC substrates used to measure the Proteasome included Z-LLE-AMC to measure caspase-like activity exhibited by the β1 and subunits (Enzo Life Sciencies), Boc-LRRAMC to measure trypsin-like activity exhibited by the β2 subunits (Enzo Life Sciences), and Suc-LLVY-AMC to measure chymotrypsin-like activity exhibited by the β5 subunits (Calbiochem).
To measure Immuno-Proteasome activity Ac-PAL-AMC (Boston Biochem) was used to measure caspase-like activity exhibited by β1i and Ac-ANW-AMC (Boston Biochem) was used to measure chymotrypsin-like activity exhibited by β5i.
Proteolysis assays using AMC-conjugated substrates
Different amounts of cell protein from the samples were loaded into 96 wells black plates, with proteolysis buffer and AMC-substrate, to a final volume of 100 μL per well. Each sample was run in triplicate. The protein concentration, AMC-substrate concentration, and incubation time were varied according to the experimental design. Wavelengths used in the fluorimeter were λexcitation=355 nm and λemission=444 nm.
Proteolysis assays using radiolabeled hemoglobin
Samples of both control and oxidized radiolabeled hemoglobin were tested for proteolytic susceptibility with cell extracts and purified 20S proteasome as previously described (1–3). Tritium-labeled hemoglobin ([3H]Hb) was generated in vitro with [3H]formaldehyde and sodium cyanoborohydride and then extensively dialyzed. Aliquots of [3H]Hb were oxidatively modified by exposure to 1.0 mM H2O2 for 1 h to generate oxidized hemoglobin, [3H]HbOX. Both [3H]Hb and [3H]HbOX were separately incubated with cell lysates to measure proteolysis. Percentage of protein degraded for both [3H]Hb and [3H]HbOX was calculated by release of acid-soluble (supernatant) counts, by liquid scintillation after addition of 20% TCA (trichloroacetic acid] and 3% BSA (as carrier) to precipitate remaining intact protein, according to the formula, % degradation = 100 × (acid-soluble counts−background counts)/total counts.
Adaptation to hydrogen peroxide
MEF cells were grown to 10% confluence (~250,000 cells/ml) then pretreated with 10μM H2O2 (Sigma catalog number H1009), for 1 h at 37 °C under 5% CO2 to induce adaptation to oxidative stress, Cells were then washed once with phosphate-buffered saline (PBS), which was finally replaced with fresh complete medium.
Statistics
Linear regression was the statistical tool we used to predict the relationship between fluorescence intensity and peptide bond cleavage (as represented by release of the AMC fluorophore from AMC-labeled peptides), according to the equation y = xβ + ε, being. In this paper, y was fluorescence, x the AMC concentration, β the increment in fluorescence for a given increment in AMC concentration, and ε the error attributable to factors other than the independent variable. Various concentrations of an unbound AMC standard (Calbiochem) were used to generate a standard curve of AMC fluorescence from which quantitative measures of peptide bond cleavage (proteolysis) could readily be calculated.
Results
Sample protein concentrations
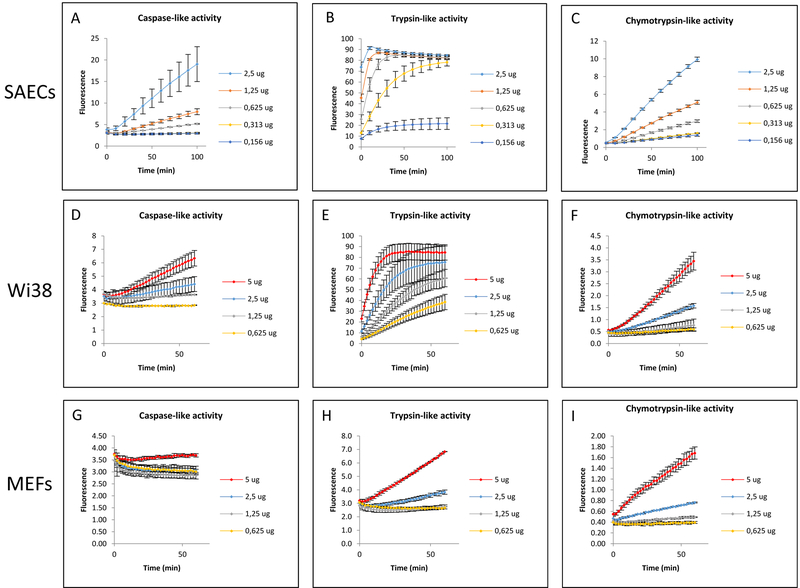
Enzymatic kinetics show that the duration and frequency of measurements as well as amount of cell protein sample loaded all play significant roles in the precision of measurements. As expected, as the amount of cell protein used increased, the rate of AMC conjugated substrate cleavage also increased in all cell types (figure 1). However, there were significant differences in the overall rates between the cell types and across the three proteasome activities measured.
Figure 1. Effect of Varying Cell Protein Sample and Measurement Time on Apparent Proteasomal Proteolysis.
Different amounts of cell protein were loaded in order to test the proteolytic response of the Proteasome over time in each cell type (A, B, C, SAECs; D, E, F, Wi38; G, H, J, MEFs). Different amounts of cell protein resulted in different apparent Proteasomal activities. Kinetic curves provided a range in which to find a linear response (i.e. when the rate of reaction was constant). The results shown here are the mean ± SD of at least 3 independent trials.
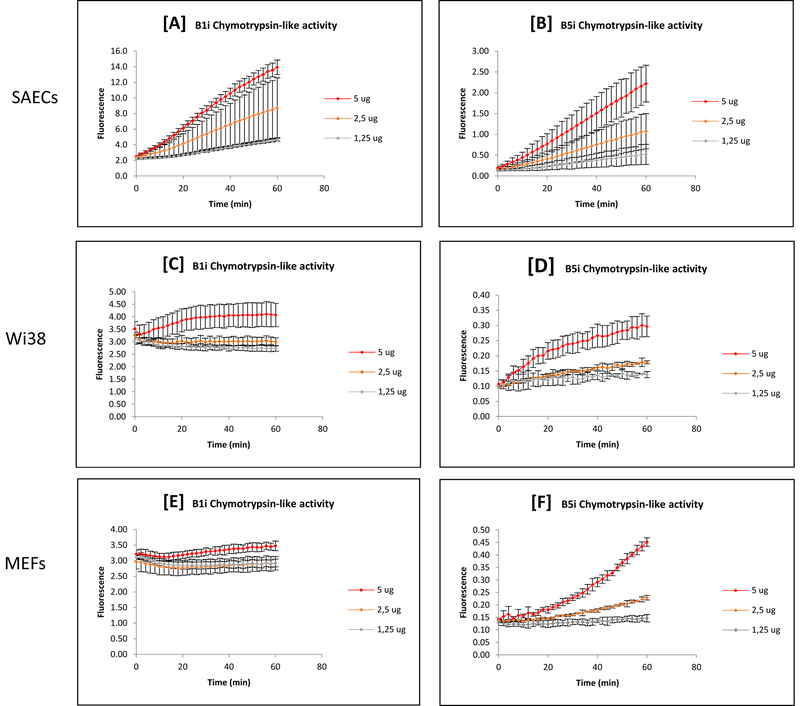
The pattern of activity was similar for the proteasome (figure 1) and Immuno-Proteasome (figure 2) both of which exhibited greater proteolysis with increasing experiment duration or cell protein loaded. However, the capacity varied widely between the three cell types.
Figure 2: Effect of Varying Cell Protein Sample and Measurement Time on Apparent Immuno-Proteasomal Proteolysis.
Different amounts of cell protein were loaded in order to test the proteolytic response of the Immuno-Proteasome over time in each cell type (A, B, C, SAECs; D, E, F, Wi38; G, H, J, MEFs). Different amounts of cell protein resulted in different apparent Immuno-Proteasomal activities. Kinetic curves provided a range in which to find a linear response (i.e. when the rate of reaction was constant). The results shown here are the mean ± SD of at least 3 independent trials.
Duration of assays
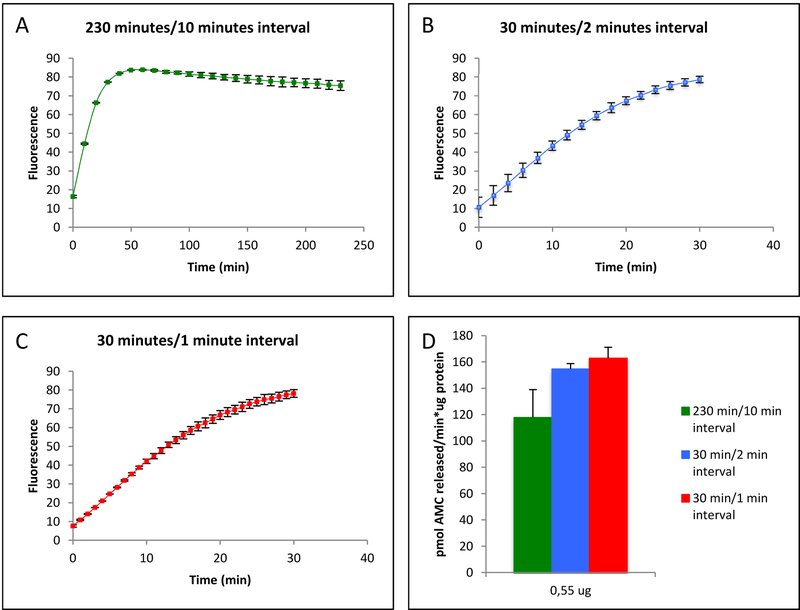
As already apparent from the results of figures 1 and 2, the duration of an enzymatic assay can affect fluorescence measurements. To investigate this more carefully, the Trypsin-like activity of the Proteasome was measured during two commonly employed measurement periods, 30 mins and 4 hours, as well as at different frequencies of sampling measurements (1 min, 2 min, and 10 min intervals) within the 30min or 4hr windows (figure 3). Our results show that Trypsin-like activity plateaued within the first hour of a 4 hour measurement period (figure 3A) whereas activity appeared relatively constant for at least the first 20 mins of 30 min measurements (Figures 3B and 3C). There were also differences in derived proteolytic rates depending on the measurement frequency, such that 10 min intervals were clearly too sparse but measuring at either 1 or 2 min intervals yielded consistent results (figure 3D).
Figure 3: The Impact of Assay Duration and Sampling Frequency on Apparent Trypsin-like Activity of the Proteasome in SAEC cells.
A: An extended assay with infrequent measurement intervals results in an imprecise linear range that leads to a miscalculation of the specific activity. B & C: A shorter duration of the assay with increased frequency of measurement intervals result in more precise determination of specific activity. D: Specific activity calculated from assays of different duration and, with different frequencies of measurement. The results are the mean ± SD of at least 3 independent trials.
AMC concentrations
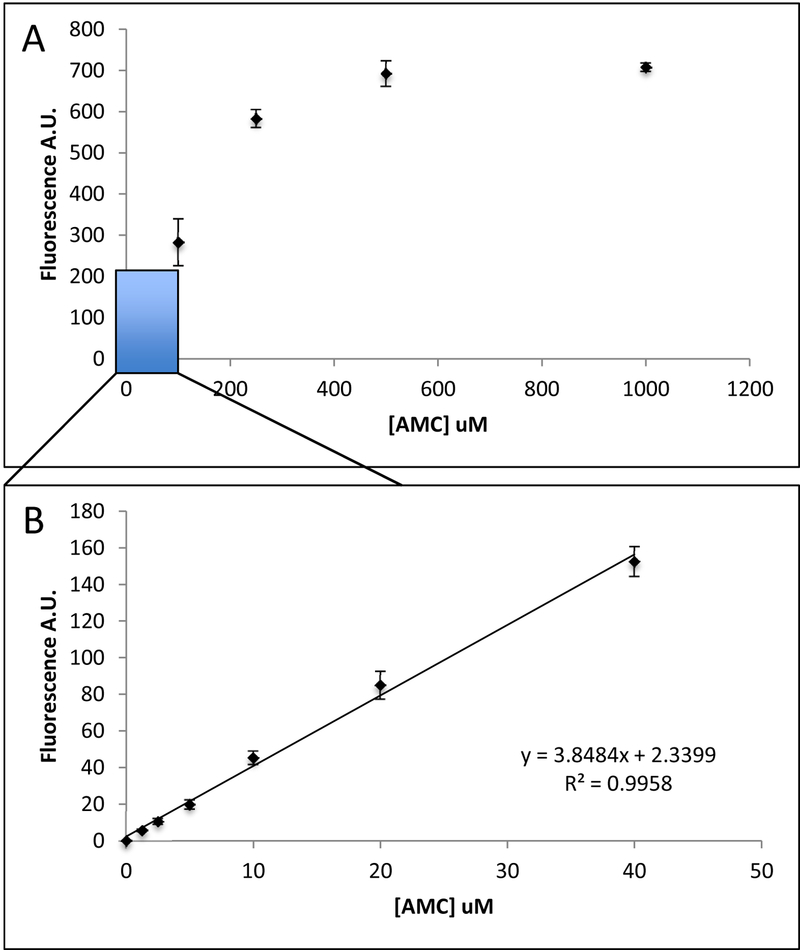
The AMC standard curve exhibits a logarithmic distribution (figure 4). There is saturation of fluorescence at the higher concentrations of AMC (200uM – 1000uM). Whereas at lower concentrations, <40 uM AMC the standard curve is linear.
Figure 4: Creating an AMC Standard Curve Against which to Calibrate Rates of Proteolysis.
A: The AMC standard curve has a logarithmic distribution with saturation at high concentrations. B: Low AMC concentrations provide a linear curve well suited for correlating fluorescence to units of AMC, which can then be used to determine proteolytic activity from free AMC. The results showed here are the mean ± SD of at least 5 independent replicates.
Apparent Proteolytic Rates Across Varying Concentrations of AMC-conjugated Substrate and Cell Sample Protein.
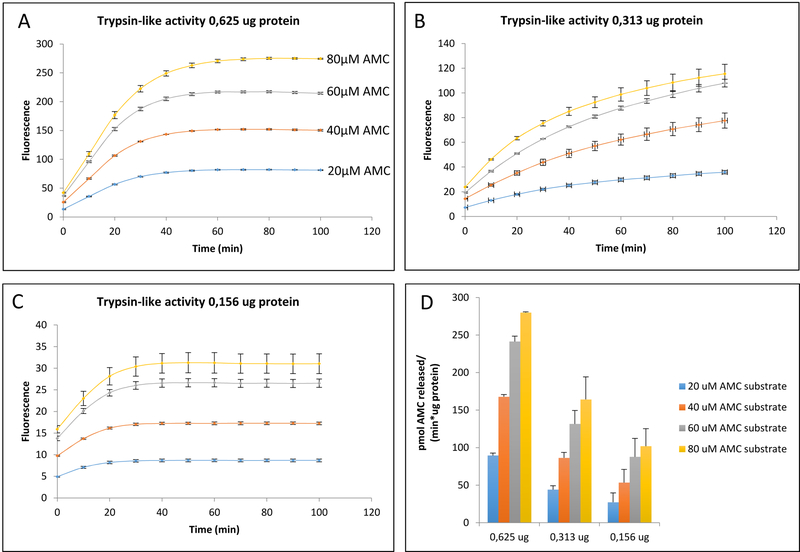
It should be noted that changes in AMC-substrate concentration are not proportional to changes in fluorescence (figure 5). At higher AMC-substrate concentrations, the signal becomes saturated and fluorescence no longer increases proportionally with AMC-substrate concentration.
Figure 5: Testing Apparent Proteolytic Rates Across Varying Concentrations of AMC-conjugated Substrate and Cell Sample Protein.
A, B, C: proteolytic activity corresponding to different amounts of cell protein, each one tested against a variety of Boc-LRR-AMC (Proteasomal Trypsin-like) substrate concentrations. Proteasomal Trypsin-like apparent activity (fluorescence emission) initially increased with increasing concentrations of AMC-substrate, but the relationship was not linear. As AMC-conjugated substrate concentration was increased in increments of 20 uM, there was a gradual loss of consistent increases in fluorescence, with saturation at the higher concentrations that would negatively affect the accuracy of specific activity calculations. D: Specific activity corresponding to A, B, C. The apparent specific activity does not increase proportionally with increasing concentrations of AMC substrate. The results showed here are the mean ± SD of at least 3 independent trials.
Calculating specific activity
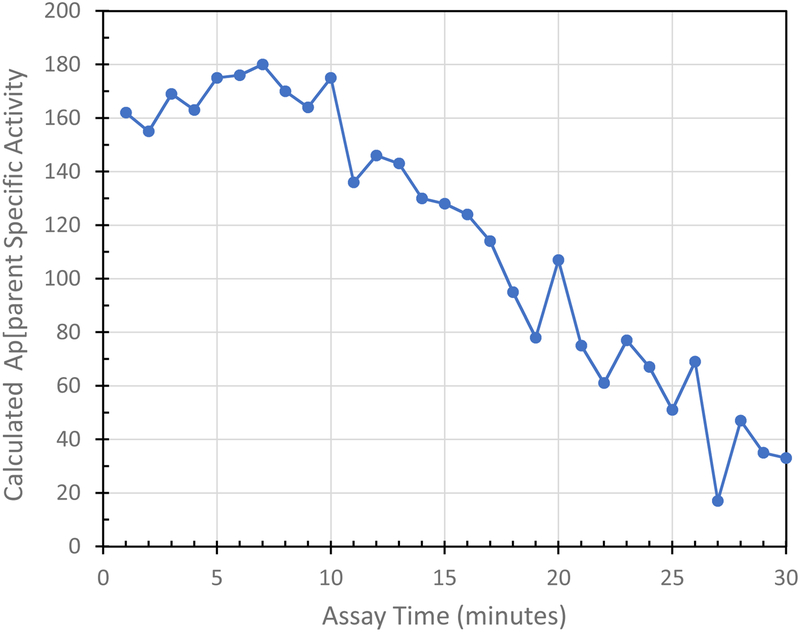
Table 1 and Figure 6 show data used to calculate proteolytic specific activity using Proteasomal Trypsin-like activity as an example. In the legend to table 1, it can be seen that the calculated Proteasomal Trypsin-like Specific Activity derived from just the 1 minute Δ AMC value would be 162 pmol AMC released × min−1 × ug protein−1.
Table 1: Sample Calculation of Proteolytic Specific Activity. Proteasomal Trypsin-like activity was determined in SAECs over a period of 30 min, with measurements each minute starting at time “0.”.
Δ AMC: AMC released from one point to the next one, subtracting the previous value at one point from the next one.
So the calculated Specific Activity from just the 1 minute reading in Table 1 = 162 pmol AMC released × min−1 × ug protein−1
Specific activities for each time point shown in Table 1 were calculated exactly as described for the example of the 1 min sampling time point above.
| Sampling Time Point (min) | Fluorescence | [AMC] (uM) | AMC (pmol) | Δ AMC | Specific Activity Calculation pmol/(min*ug protein) |
|---|---|---|---|---|---|
| 0 | 7 | 1,25 | 125 | - | - |
| 1 | 11 | 2,14 | 214 | 89 | 162 |
| 2 | 14 | 2,99 | 299 | 85 | 155 |
| 3 | 17 | 3,92 | 392 | 93 | 169 |
| 4 | 21 | 4,82 | 482 | 90 | 163 |
| 5 | 25 | 5,78 | 578 | 96 | 175 |
| 6 | 28 | 6,75 | 675 | 97 | 176 |
| 7 | 32 | 7,74 | 774 | 99 | 180 |
| 8 | 36 | 8,68 | 868 | 93 | 170 |
| 9 | 39 | 9,58 | 958 | 90 | 164 |
| 10 | 43 | 10,54 | 1054 | 96 | 175 |
| 11 | 46 | 11,29 | 1129 | 75 | 136 |
| 12 | 49 | 12,09 | 1209 | 80 | 146 |
| 13 | 52 | 12,87 | 1287 | 78 | 143 |
| 14 | 55 | 13,59 | 1359 | 72 | 130 |
| 15 | 57 | 14,29 | 1429 | 71 | 128 |
| 16 | 60 | 14,98 | 1498 | 68 | 124 |
| 17 | 62 | 15,60 | 1560 | 63 | 114 |
| 18 | 64 | 16,13 | 1613 | 52 | 95 |
| 19 | 66 | 16,56 | 1656 | 43 | 78 |
| 20 | 68 | 17,15 | 1715 | 59 | 107 |
| 21 | 70 | 17,56 | 1756 | 41 | 75 |
| 22 | 71 | 17,90 | 1790 | 33 | 61 |
| 23 | 73 | 18,32 | 1832 | 42 | 77 |
| 24 | 74 | 18,69 | 1869 | 37 | 67 |
| 25 | 75 | 18,97 | 1897 | 28 | 51 |
| 26 | 77 | 19,35 | 1935 | 38 | 69 |
| 27 | 77 | 19,44 | 1944 | 9 | 17 |
| 28 | 78 | 19,70 | 1970 | 26 | 47 |
| 29 | 79 | 19,89 | 1989 | 19 | 35 |
| 30 | 80 | 20,08 | 2008 | 18 | 33 |
Figure 6: Apparent Proteasomal Trypsin-like Specific Activity was Determined in SAECs Over a 30 Minute Period, with Measurements Each Minute.
The data for this figure were the Specific Activity calculations from Table 1. All experimental details and Specific Activity calculations were made exactly as described in the legend to Table 1.
However, as made abundantly clear by plotting the data of table 1 in Figure 6, the minute-by-minute values for Δ AMC remained remarkably constant for the first 10 measurements, i.e. for measurements made at each minute over a 10 minute total period (Figure 6). After the first 10 minutes, however, there was a steep drop-off in measured Δ AMC values, indicating that calculations of specific activity made after this period would not be valid.
Therefore, we suggest that researchers should test the linearity of their measurements over a suitable time period and ensure that they do not exceed timespans for which fluorescence changes are relatively constant. We further suggest that a suitable range of measurements could be averaged to obtain a more reliable final specific activity result. For example, using the data of Table 1 and Figure 6, where apparent specific activity was relatively constant for the first 10 minutes, we suggest taking the final value for the specific activity as the average of the specific activities at times between 1 and 10 mins ± the standard deviation. For the data of Table1/Figure 6 the specific activity would, thus, be reported as 169 ± 8 pmol × min−1 × μg protein−1.
The following points should be noted:
Fluorometer: Fluorescent units are obtained using a fluorimeter. There can be significant variation in fluorescence values based on the type and age of the fluorimeter. An AMC standard curve must be used to correlate fluorescence to units of AMC, allowing standardization across different experiments.
AMC fluorescence: AMC Fluorescence exhibits a logarithmic curve with increasing AMC concentration (figure 4A), so measurements should be made in the linear range where rate of AMC release is constant (figure 4B).
Experimental Sample Volume: It is absolutely essential that sample volume be standardized for all experiments.
Specific Activities: As shown in Table 1, the linearity of calculated specific activities is maintained for only a short period – just 10 minutes in Table 1 and Figure 6. After this period there is a clear decrease in the release of AMC from the peptide to which it is bound (i.e. less peptide-bond cleavage or proteolysis). A final value for specific activity should, therefore be the average of the specific activities at times within the constant maximal range of results (i.e. between 1 and 10 mins in Table 1) ± the standard deviation.
Fluorescent peptide use in studies of oxidation and oxidative stress
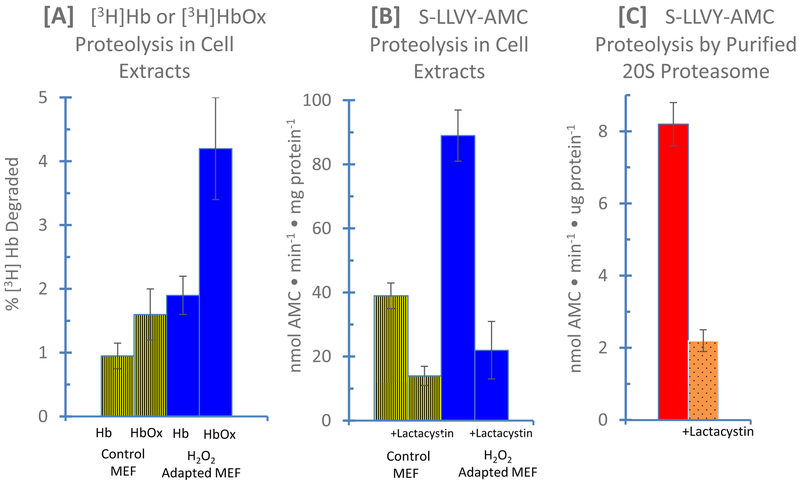
To demonstrate the usefulness and efficacy of fluorescent peptides in studies of protein oxidation or adaptation to oxidative stress, we first tested whether MEF cells could adapt to a non-damaging, signaling concentration of H2O2: an example of adaptive homeostasis. First, we tested the degradation radiolabeled hemoglobin and oxidized radiolabeled hemoglobibn [3H]Hb and [3H]HbOX since these substrates provide a physical and definitive measure of actual proteolysis. Clearly, both control and H2O2 adapted MEF’s were better-able to degrade [3H]HbOX than [3H]Hb however, the H2O2 adapted MEF’s degraded [3H]HbOX at 2.5 times the rate of control cells figure 6A). We next used samples of the same control and H2O2 adapted MEF’s to test whether the chymotrypsin-like fluoropeptide substrate S-LLVY-AMC would also report the increase in proteolytic capacity reported in H2O2 adapted cells in figure 7A. As shown in figure 6B, S-LLVY-AMC proteolysis increased by 2.4 fold in the H2O2 adapted cells, in excellent agreement with the results of figure 7A. Moreover, the proteasomal chymotrypsin-like inhibitor lactacystin prevented some 80% of the S-LLVY-AMC proteolysis, demonstrating the major role of proteasome in the process (figure 7B). Finally, we tested the proteolysis of S-LLVY-AMC with purified 20S proteasome ± lactacystin and again found about an 80% inhibition by the proteasomal chymotrypsin-like inhibitor (figure 7C).
Figure 7: Comparison of Radiolabeled Proteins and Fluoropeptides as Substrates for Proteolysis in Lysates from Control and H2O2 Adapted MEF Cells, and by Purified 20S Proteasomes.
In Panel A, the degradation of [3H]Hb and [3H]HbOX was tested in extracts of control and H2O2 adapted MEF’s, as described in Materials & Methods. In Panel B, samples of the same control and H2O2 adapted MEF’s were used to measure proteolysis of the chymotrypsin-like fluoropeptide substrate S-LLVY-AMC, in the presence and absence of the proteasomal chymotrypsin-like inhibitor lactacystin (20μM), as described in Materials & Methods. In Panel C the proteolysis of S-LLVY-AMC by purified 20S proteasomes was measured in the presence and absence of 20 μM lactacystin. Purified 20S proteasome (catalog # PW8720) was purchased from Enzo Life sciences (Plymouth Meeting, PA, USA).
Discussion
Both Proteasome and Immuno-Proteasome activities have been shown to be highly inducible during adaptation to oxidative stress and/or various redox challenges [1, 26, 32]. Increased activity is partly explained by rapid (within minutes) disassociation of the 26S (ATP- and Ubiquitin-dependent) Proteasome to generate more free 20S Proteasomes, many of which bind to 11S (PA28) regulators that increase their ability to selectively degrade oxidized cellular proteins [22, 32, 33]. Meanwhile the 19S regulators released from 26S Proteasome complexes are bound to and protected by HSP70 chaperone proteins for 3 – 5 hours, after which the 26S Proteasomes are reformed [33]. As adaptation continues over an 18 hour period, de novo synthesis of Proteasomes, Immuno-Proteasomes, and 11S (PA28) regulators occurs via both increased transcription and translation. Much of the increased Proteasome transcription is controlled by the Nrf2 signal transduction pathway, whereas Immuno-Proteasome appears to be under the control of the 1RF-1 signaling pathway [1, 34–36].
In addition to being temporarily disassembled and from 26S Proteasomes during some redox challenges, the 19S proteasomal regulator has also been shown to be highly sensitive to direct oxidative inactivation. In fact, several key sulfhydryl groups on various subunits of the 19S regulator appear to be particularly prone to oxidative modification that can inactivate ATP/Ubiquitin-dependent proteolysis for hours [37, 38].
Since it is clear that intracellular proteostasis can be strongly affected by redox perturbations, it is important that we employ best practices to maximize reproducibility and facilitate cross study comparisons of Proteasome and Immuno-Proteasome activities. By modifying several inputs based on the sample type and experimental question, proteolytic assays can have increased sensitivity and accuracy down to the pmol level. These results illustrate that different cell types from different species have significantly different levels of Proteasome activity (figure 1), which reinforces the need to optimize protocols according to specific experimental conditions. These optimization steps include determining the appropriate sample concentration to load so that there is enough sample to provide a sufficient signal, while ensuring the most effective use of the sample, which is particularly important for valuable specimens that are difficult to generate or collect.
Similarly, kinetic measurements should be performed within the linear range of activity, where enzymatic rates are constant and at their highest value, so that proteolytic capacity is accurately assessed. Measures of Immuno-Proteasome activity follow a similar pattern to that seen with the Proteasome with the exception that Immuno-Proteasome exhibits lower overall basal activity. The highly inducible nature of the Immuno-Proteasome likely explains this observation. Only baseline activity was measured in these experiments, whereas the physiological relevance of the Immuno-Proteasome may be only evident when it is induced in cells through an oxidant-signaling dose or a stress challenge [1, 26].
One important element to consider when attempting to measure activity within the linear range is the duration of the enzymatic assay. When the duration of measurements is extended (e.g. 4 hours vs. 30 mins), there can be several pitfalls. These include measurements made after the kinetic curve plateaus that result in a lower apparent specific activity than if the measurements were made in the linear fluorescence phase (figure 3). Thus, we recommend making measurements in the relatively short linear phase of AMC-peptide bond cleavage. However, if only a few data points are measured in the linear range this can result in higher variation that may erode the overall accuracy of the assessment. As a result, highly active cell types of Proteasome activities, such as the Trypsin-like activity of the |32 subunit, should have a higher frequency of measurements within a shorter period.
There are concerns about the use and application of AMC-labeled substrates [39, 40]. The main issue is the inability of these AMC-conjugated substrates to differentiate between different Proteasome conformations. Since the different Proteasome complexes, 20S and 26S share a base complex, there is a concern regarding potential overlap in their activity. However, extensive work has been done to elucidate and differentiate the physiological role of each of these conformations (Raynes et al., 2016). For instance, the 26S Proteasome is ATP dependent, so that samples can be depleted of ATP to provide greater confidence that the proteolytic activity being measured is that of the 20S Proteasome.
A related serious concern is the probable competing effects of other proteases and/or peptidases that one may expect to be present in biological samples. One way to deal with this problem is to make measurements with and without Proteasome inhibitors. Agents such as lactacystin, epoxomicin, and MG-132 all inhibit the Proteasome and Immuno-Proteasome [41]. Unfortunately, the inhibition is selective, not specific in all cases. In addition, the Proteasome/Immuno-Proteasome inhibitors may also at least partially inhibit other cellular proteases and peptidases. One may also use a parallel approach of intentionally trying to inhibit cellular proteases and peptidases other than the Proteasome/Immuno-Proteasome but, again, partial Proteasome inhibition may also occur. An alternate approach is to measure Proteasome/Immuno-Proteasome activity in a tissue sample, then immunoprecipitate Proteasomes and/or Immuno-Proteasomes out of the sample, and then re-measure Proteasome or Immuno-Proteasome; of course these measurements can be made in parallel samples instead. Broad spectrum polyclonal antibodies are best for this kind of approach, rather than more specific monoclonals.
AMC standards exhibit fluorescence saturation at high concentrations. Our results suggest that standards can be accurately used up to 40 μM (figure 4B) to stay within the linear range of fluorescence values. This is also illustrated in assays comparing different protein concentrations and different amounts of AMC-substrate concentrations. Activity curves of higher concentrations of protein and/or AMC-substrate lacked the proportionate increase in activity seen in experiments employing lower concentrations (figure 5). For example, trypsin activity measured between substrate concentrations of 20, 40 and 60 (μM Boc-LRR-AMC exhibited a relatively consistent increase, but between 60 and 80 μM of Boc-LRR-AMC substrate the increase in fluorescence was greatly abrogated and not at all equivalent to the changes in fluorescence values seen at the lower Boc-LRR-AMC concentrations. This is likely due to AMC saturation, so that experiments should be designed to stay within the linear range of AMC standards to accurately translate fluorescence emission to activity.
In the present study we have reported results for all three proteolytic activities of the Proteasome (figure 1) and for two of the Immuno-Proteasome’s activities (figure 2). In the remainder of this work we have concentrated on the Proteasome’s Trypsin-like activity in order to generate more specific and detailed results. It should be noted, however, that the bulk of experimental results reported in figures 3,4,5,6, and Table 1 have also been seen with Proteasome chymotrypsin-like and caspase-like activities, and with Immuno-Proteasome chymotrypsin-like and caspase-like activities (data not shown). Thus, we have confidence that the methods and approaches presented in this paper are relevant to all Proteasome and Immuno-Proteasome activity measurements with fluoropeptides.
Our studies comparing degradation of [3H]Hb and [3H]HbOX with the fluoropeptide SLLVY-AMC in MEF extracts and with purified 20S proteasomes provide compelling evidence that fluoropeptides can accurately reflect proteolytic responses in cells adapted to oxidative stress, without the need for radioactive labeling. Thus, fluoropeptide proteolytic substrates can provide another useful tool for researchers studying cellular redox regulation, adaptation, and oxidative stress.
The results of our experiments lead us to suggest several recommendations for how future researchers can obtain greater sensitivity, specificity, and accuracy when measuring proteolytic activities with fluorescent probes. (1) All proteolytic measurements should be made within the linear range of AMC-peptide bond cleavage in order to ensure accurate assessment of proteolytic rate. (2) The concentration of protein and AMC-substrate utilized should be below the threshold at which a disproportionate relationship between fluorescence and proteolytic activity is observed (3) The number of measurements and their periodicity must be adjusted depending on the activity of the cell type and Proteasome subunit in order to obtain the most accurate measurements.
Highlights.
Proteases like Proteasome & Immunoproteasome minimize accumulation of oxidized proteins
Proteases like Proteasome and Immunoproteasome are subject to redox regulation
Proteasome & Immunoproteasome activities can be measured with fluorogenic peptides
Fluoropeptide concentration, assay duration, and measurement frequency must be optimized
Specific activities should be averaged during constant maximal fluorescence plateau
Acknowledgments
The authors were supported by grant # ES003598 from the National Institute of Environmental Health Sciences, of the US National Institutes of Health, to KJAD. Additional support to PYS and KJAD came from grant # AG052374 from the National Institute on Aging of the US National Institutes of Health.
Footnotes
Publisher's Disclaimer: This is a PDF file of an unedited manuscript that has been accepted for publication. As a service to our customers we are providing this early version of the manuscript. The manuscript will undergo copyediting, typesetting, and review of the resulting proof before it is published in its final citable form. Please note that during the production process errors may be discovered which could affect the content, and all legal disclaimers that apply to the journal pertain.
References
- 1.Pickering AM, et al. , Nrf2-dependent induction of proteasome and Pa28αβ regulator are required for adaptation to oxidative stress. J Biol Chem, 2012. 287(13): p. 10021–31. [DOI] [PMC free article] [PubMed] [Google Scholar]
- 2.Pickering AM, et al. , A conserved role for the 20S proteasome and Nrf2 transcription factor in oxidative stress adaptation in mammals, Caenorhabditis elegans and Drosophila melanogaster.J Exp Biol, 2013. 216(Pt 4): p. 543–53. [DOI] [PMC free article] [PubMed] [Google Scholar]
- 3.Pickering AM, et al. , Oxidative stress adaptation with acute, chronic, and repeated stress. Free Radic Biol Med, 2013. 55: p. 109–18. [DOI] [PMC free article] [PubMed] [Google Scholar]
- 4.Ullrich O, et al. , Poly-ADP ribose polymerase activates nuclear proteasome to degrade oxidatively damaged histones. Proc Natl Acad Sci U S A, 1999. 96(11): p. 6223–8. [DOI] [PMC free article] [PubMed] [Google Scholar]
- 5.Pickering AM and Davies KJ, A simple fluorescence labeling method for studies of protein oxidation, protein modification, and proteolysis. Free Radic Biol Med, 2012. 52(2): p. 239–46. [DOI] [PMC free article] [PubMed] [Google Scholar]
- 6.Poppek D, et al. , Phosphorylation inhibits turnover of the tau protein by the proteasome: influence of RCAN1 and oxidative stress. Biochem J, 2006. 400(3): p. 511–20. [DOI] [PMC free article] [PubMed] [Google Scholar]
- 7.Reeg S, et al. , The molecular chaperone Hsp70 promotes the proteolytic removal of oxidatively damaged proteins by the proteasome. Free Radic Biol Med, 2016. 99: p. 153–166. [DOI] [PMC free article] [PubMed] [Google Scholar]
- 8.Olayanju A, et al. , Brusatol provokes a rapid and transient inhibition of Nrf2 signaling and sensitizes mammalian cells to chemical toxicity-implications for therapeutic targeting of Nrf2. Free Radic Biol Med, 2015. 78: p. 202–12. [DOI] [PMC free article] [PubMed] [Google Scholar]
- 9.Rodgers KJ and Dean RT, Assessment of proteasome activity in cell lysates and tissue homogenates using peptide substrates. Int J Biochem Cell Biol, 2003. 35(5): p. 716–27. [DOI] [PubMed] [Google Scholar]
- 10.Strauss AW, et al. , Characterization of an endopeptidase involved in pre-protein processing. Proc Natl Acad Sci U S A, 1979. 76(9): p. 4225–9. [DOI] [PMC free article] [PubMed] [Google Scholar]
- 11.Harris JL, et al. , Rapid and general profiling of protease specificity by using combinatorial fluorogenic substrate libraries. Proc Natl Acad Sci U S A, 2000. 97(14): p. 7754–9. [DOI] [PMC free article] [PubMed] [Google Scholar]
- 12.Zimmerman M, et al. , Sensitive assays for trypsin, elastase, and chymotrypsin using new fluorogenic substrates. Anal Biochem, 1977. 78(1): p. 47–51. [DOI] [PubMed] [Google Scholar]
- 13.Zimmerman M, Yurewicz E, and Patel G, A new fluorogenic substrate for chymotrypsin. Anal Biochem, 1976. 70(1): p. 258–62. [DOI] [PubMed] [Google Scholar]
- 14.Fenteany G, et al. , Inhibition of proteasome activities and subunit-specific amino-terminal threonine modification by lactacystin. Science, 1995. 268(5211): p. 726–31. [DOI] [PubMed] [Google Scholar]
- 15.Dammer EB, et al. , Polyubiquitin linkage profiles in three models of proteolytic stress suggest the etiology of Alzheimer disease. J Biol Chem, 2011. 286(12): p. 10457–65. [DOI] [PMC free article] [PubMed] [Google Scholar]
- 16.Milan E, et al. , A plastic SQSTM1/p62-dependent autophagic reserve maintains proteostasis and determines proteasome inhibitor susceptibility in multiple myeloma cells. Autophagy, 2015. 11(7): p. 1161–78. [DOI] [PMC free article] [PubMed] [Google Scholar]
- 17.Shashova EE, et al. , Proteasome functioning in breast cancer: connection with clinical-pathological factors. PLoS One, 2014. 9(10): p. e109933. [DOI] [PMC free article] [PubMed] [Google Scholar]
- 18.Raynes R, Pomatto LC, and Davies KJ, Degradation of oxidized proteins by the proteasome: Distinguishing between the 20S, 26S, and immunoproteasome proteolytic pathways. Mol Aspects Med, 2016. 50: p. 41–55. [DOI] [PMC free article] [PubMed] [Google Scholar]
- 19.Pomatto LCD and Davies KJA, The role of declining adaptive homeostasis in ageing. J Physiol, 2017. 595(24): p. 7275–7309. [DOI] [PMC free article] [PubMed] [Google Scholar]
- 20.Grune T, et al. , Selective degradation of oxidatively modified protein substrates by the proteasome. Biochem Biophys Res Commun, 2003. 305(3): p. 709–18. [DOI] [PubMed] [Google Scholar]
- 21.Friguet B, Stadtman ER, and Szweda LI, Modification of glucose-6-phosphate dehydrogenase by 4-hydroxy-2-nonenal. Formation of cross-linked protein that inhibits the multicatalytic protease. J Biol Chem, 1994. 269(34): p. 21639–43. [PubMed] [Google Scholar]
- 22.Wang X, et al. , Regulation of the 26S proteasome complex during oxidative stress. Sci Signal, 2010. 3(151): p. ra88. [DOI] [PMC free article] [PubMed] [Google Scholar]
- 23.Davies KJ, Degradation of oxidized proteins by the 20S proteasome. Biochimie, 2001. 83(3–4): p. 301–10. [DOI] [PubMed] [Google Scholar]
- 24.Kloetzel PM and Ossendorp F, Proteasome and peptidase function in MHC-class-I-mediated antigen presentation. Curr Opin Immunol, 2004. 16(1): p. 76–81. [DOI] [PubMed] [Google Scholar]
- 25.Teoh CY and Davies KJ, Potential roles of protein oxidation and the immunoproteasome in MHC class I antigen presentation: the ‘PrOxl’ hypothesis. Arch Biochem Biophys, 2004423(1): p. 88–96. [DOI] [PubMed] [Google Scholar]
- 26.Pickering AM, et al. , The immunoproteasome, the 20S proteasome and the PA28alphabeta proteasome regulator are oxidative-stress-adaptive proteolytic complexes. Biochem J, 2010. 432(3): p. 585–94. [DOI] [PMC free article] [PubMed] [Google Scholar]
- 27.Bonet-Costa V, Pomatto LC, and Davies KJ, The Proteasome and Oxidative Stress in Alzheimer’s Disease. Antioxid Redox Signal, 2016. 25(16): p. 886–901. [DOI] [PMC free article] [PubMed] [Google Scholar]
- 28.Gruba N, et al. , Bladder cancer detection using a peptide substrate of the 20S proteasome. FEBS J, 2016. 283(15): p. 2929–48. [DOI] [PubMed] [Google Scholar]
- 29.Souza Lda C, et al. , Effects of an anticarcinogenic Bowman-Birk protease inhibitor on purified 20S proteasome and MCF-7 breast cancer cells. PLoS One, 2014. 9(1): p. e86600. [DOI] [PMC free article] [PubMed] [Google Scholar]
- 30.Chang TL and Wang CH, Combination of quercetin and tannic acid in inhibiting 26S proteasome affects S5a and 20S expression, and accumulation of ubiquitin resulted in apoptosis in cancer chemoprevention. Biol Chem, 2013. 394(4): p. 561–75. [DOI] [PubMed] [Google Scholar]
- 31.Lima CF and Rattan SI, Determination of proteasomal activities. Methods Mol Biol, 2010. 648: p. 183–92. [DOI] [PubMed] [Google Scholar]
- 32.Pickering AM and Davies KJ, Differential roles of proteasome and immunoproteasome regulators Pa28αβ Pa28γ and Pa200 in the degradation of oxidized proteins. Arch Biochem Biophys, 2012. 523(2): p. 181–90. [DOI] [PMC free article] [PubMed] [Google Scholar]
- 33.Grune T, et al. , HSP70 mediates dissociation and reassociation of the 26S proteasome during adaptation to oxidative stress. Free Radic Biol Med, 2011. 51(7): p. 1355–64. [DOI] [PMC free article] [PubMed] [Google Scholar]
- 34.Johnston-Carey HK, Pomatto LC, and Davies KJ, The Immunoproteasome in oxidative stress, aging, and disease. Crit Rev Biochem Mol Biol, 2015. 51(4): p. 268–81. [DOI] [PMC free article] [PubMed] [Google Scholar]
- 35.Raynes R, et al. , Aging and SKN-1-dependent Loss of 20S Proteasome Adaptation to Oxidative Stress in C. elegans. J Gerontol A Biol Sci Med Sci, 2017. 72(2): p. 143–151. [DOI] [PMC free article] [PubMed] [Google Scholar]
- 36.Pomatto LCD, et al. , The age- and sex-specific decline of the 20s proteasome and the Nrf2/CncC signal transduction pathway in adaption and resistance to oxidative stress in Drosophila melanogaster. Aging (Albany NY), 2017. 9(4): p. 1153–1185. [DOI] [PMC free article] [PubMed] [Google Scholar]
- 37.Shang F and Taylor A, Ubiquitin-proteasome pathway and cellular responses to oxidative stress. Free Radic Biol Med, 2011. 51(1): p. 5–16. [DOI] [PMC free article] [PubMed] [Google Scholar]
- 38.Zhang X, et al. , The proteasome: a target of oxidative damage in cultured human retina pigment epithelial cells. Invest Ophthalmol Vis Sci, 2008. 49(8): p. 3622–30. [DOI] [PMC free article] [PubMed] [Google Scholar]
- 39.Rivett AJ, et al. , Assays of proteasome activity in relation to aging. Exp Gerontol, 2002. 37(10–11): p. 1217–22. [DOI] [PubMed] [Google Scholar]
- 40.Liggett A, et al. , Methods for measuring proteasome activity: current limitations and future developments. Leuk Res, 2010. 34(11): p. 1403–9. [DOI] [PubMed] [Google Scholar]
- 41.Kisselev AF and Goldberg AL, Proteasome inhibitors: from research tools to drug candidates. Chem Biol, 2001. 8(8): p. 739–58. [DOI] [PubMed] [Google Scholar]


