Abstract
Parkinson disease (PD) is the second most common neurodegenerative disease associated with aging. Dopaminergic neuronal degeneration and α-synuclein aggregation are commonly found in PD brain. Oxidative damage and inflammation often are considered as etiological factors of PD, although the detailed mechanisms still remain unknown. Gender and aging are two important risk factors to PD, and gene mutations and certain environmental factors have been implicated in this disease. The current study employed PTEN-induced putative kinase −1 (PINK1) knockout (KO) rats, since mutations in PINK-1 lead to familial PD. We evaluated the oxidative damage in the brain of PINK1 KO rats, and we used MRI and MRS to measure the ventricle sizes and neurochemical metabolite profiles in these rats as a function of age and gender. Distinct gender-and age-related alterations were found. The results are discussed with respect to the suitabililty of this unique rat as a faithful model of known characteristics of PD.
Keywords: Parkinson disease, Pink1 KO rats, oxidative damage, MRS, striatum, ventricular system, edema, gender differences
Graphical Abstract
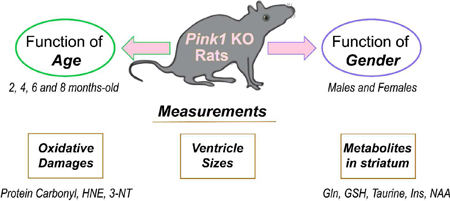
PINK1 is a mitochondrial surveillance kinase that contributes to the processes involved in ridding the cell of damaged mitochondria. Mutations in the pink1 gene lead to inherited Parkinson disease (PD). This study examined the effects of age and gender on the PINK1 knockout rat to determine its fidelity to certain biochemical and clinical characteristics of PD.
Introduction
The second most common age-related neurodegenerative disease is Parkinson disease (PD), with about 10 million people in the world diagnosed with this disorder [1]. Clinically, PD is characterized by motor dysfunction, including unstable postures, rigidity, bradykinesia, and resting tremors, and non-motor symptoms, including hallucination and anosmia, among others, and, in late-stage of PD, cognitive deficits are observed [2]. Anosmia often happens many years prior to the appearance of motor symptoms appear. Pathologically, degeneration of dopaminergic neurons (DA) in the substantia nigra pars compacta and aggregation of phosphorylated α-synuclein in Lewy bodies are observed in PD brain that eventually lead to less dopamine in the striatum. The mechanisms of the pathology of PD still are not fully defined. However, gene mutation, exposure to halocarbons and/ or some metal ions and metalloids in the environment are suspected to play a role in the development of PD. Oxidative damage, inflammation, dysfunction of brain mitochondria, and altered proteostasis also are thought to be associated with the pathophysiology and progression of PD [3].
Mitochondrial dysfunction and DNA abnormalities have been complicatedly associated with PD [4,5]. Mutations of PTEN-induced putative kinase-1 (PINK1) has been identified as a common genetic cause of familial PD. The protein PINK1 is a kinase maintaining the dynamics and integrity of mitochondria and providing neuroprotection to the brain. In addition, PINK1 is important for long term survival of human dopaminergic neurons [6]. Abnormal and dysfunctional mitochondria accumulate when PINK1 is absent, although in the mouse model of PD with knockout of the PINK1 gene, deposition of α-synuclein and degeneration of DA neurons were not found [7–9].
Aside from aging, it has been reported that men have a higher risk, earlier onset and faster progression of PD than women [1]. The PINK1 and α-synuclein genes were reported to be upregulated in males compared to females [10]. Dopaminergic neurons may have different metabolic properties in the substantia nigra of human males and females, leading the male gender to be a high risk to develop PD [10].
Up to now, the consensus is that a good mouse model to mimic all human PD characteristics does not exist [11]. A genetic rat model could have some advantages as a rodent model of PD, a bigger brain size compared to a knockout mouse model. In this current study, we measured brain oxidative damage by the slot-blot technique and the levels of metabolites in the striatum by MRS, and we determined the ventricular size by MRI, all to characterize whether the PINK1 KO rat model we used is a suitable animal model that fulfills the criteria and manifests the characteristics of PD. We used wild-type (WT) 2 months-old rats as the control group and studied the PINK1 knockout rat groups (hereafter, PINK1 knockout is represented by KO) at 2, 4, 6, and 8 months of age separated into male and female groups. To our knowledge, the current research is the first study on oxidative damage and striatum neurochemical profiles, as well as ventricular size, with the KO rats as a function of age and gender variables that provide insights into mechanisms of the pathobiology of familial PD.
Materials and methods
Chemicals
All chemicals used in this study were purchased from Sigma-Aldrich (St. Louis, MO, USA) unless otherwise noted. Pierce BCA protein assay reagents A & B were purchased from Thermo Scientific (Waltham, MA, USA). Criterion precast polyacrylamide gels, TGS electrophoresis running buffers, Precision Plus Protein All Blue and unstained Standards, and nitrocellulose membranes were purchased from Bio-Rad (Hercules, CA, USA). Amersham ECL IgG horseradish peroxidase-linked secondary antibodies and ECL Plus Western blotting detection reagents were procured from GE Healthcare (Pittsburgh, PA, USA). Protein carbonyl detection kits were purchased from Millipore (Billerica, MA, USA). Anti-HNE and anti-nitrotyrosine primary antibodies were purchased from Alpha Diagnostic International Inc (San Antonio, TX, USA) and Sigma-Aldrich, respectively.
Animals
All animal studies were approved by the University of Kentucky Institutional Animal Care and Use Committee and followed NIH Guidelines for the Care and Use of Laboratory Animals. Both male and female, WT and KO rats were purchased from the Sage Research Labs (Horizon, Inc.) at 2 months old. All rats were kept under standard conditions housed in the University of Kentucky Animal Facility. Rats were sacrificed at 2 months, 4 months, 6 months and 8 months, respectively, after MRS was performed following methods described below. Rats were anesthetized using CO2 before sacrificing. All methods provide a surgical plan of anesthesia prior to tissue harvest or exsanguination. The whole brain was excised immediately and frozen in liquid nitrogen for molecular and biochemical studies.
Sample preparation
Wheaton glass homogenizer with ice-cold isolation buffer [0.32 M sucrose, 2 mM EDTA, 2 mM EGTA, 20 mM HEPES, 0.2 µg/mL PMSF, 5 µg/mL aprotinin, 4 µg/mL leupeptin, 4 µg/mL pepstatin, and 10 µg/mL phosphatase inhibitor cocktail 2] were used to homogenize the brains of rats. The homogenates were then sonicated on ice for 10 seconds, two times with 10 seconds rest in between. Protein concentrations of homogenates were determined by the Pierce BCA method (Rockford, IL, USA) after sonication.
Slot blot assay
Protein carbonyls (PC) and protein-bound 4-hydroxy-2-trans-nonenal (HNE) were detected by slot blot assay [12,13]. For determination of PC, samples were derivatized with 2,4-dinitrophenylhydrazine (DNPH) in advance. For determination of HNE and 3-NT, brain homogenates were prepared with Laemmli buffer. Protein (250 ng) from each sample were loaded onto a nitrocellulose membrane in separate wells in a slot-blot apparatus (Bio-Rad, Hercules, CA, USA) under vacuum formed by a water suction system. Membranes were blocked in 5% bovine serum albumin (BSA) in TBS-Tween20 (0.2% v/v) for 1.5 h and followed with incubation in primary antibody (anti-dinitrophenylhydrazone primary, anti-protein-bound HNE or anti 3-NT, respectively, each produced in rabbit, Sigma-Aldrich) for 2 h, washed three times in TBS-T and then incubated for 1 h with secondary antibody (goat anti-rabbit secondary linked to alkaline phosphatase). Membranes were developed for alkaline phosphatase activity (ALP) buffer containing 5-bromo-4-chloro-3-indolyl-phosphate (BCIP) dipotassium and nitro blue tetrazolium (NBT) chloride, and then dried overnight, followed with image scanning for analysis performed using Scion Image (Scion Corporation, Frederick, MD).
Hydrogen magnetic resonance spectroscopy
H1-MRS (hydrogen magnetic resonance spectroscopy) was used to quantify neurochemical changes in the rat striatum. MRS data were acquired on a 7T BrukerClinscan horizontal bore system (7.0T, 30cm, 300Hz) equipped with a triple-axis gradient system (630 mT/m and 6300 T/m/s). A standard 2×2 array surface coil was used. Isoflurane (1.3%) was used to anesthetize rats before scanning in MRI compatible equipment (CWE Inc.). Rats were placed on a Bruker scanning bed with a tooth bar, ear bars and tape. Body temperature and respiration rate were monitored using equipment from SA Instruments Inc.
The water heating system for the scanning bed maintained rat body temperature at 37°C. T2 weighted turbo spin echo sequences (TE 40ms, TR 2890ms, Turbo 7, FOV 20mm, 0.156 × 0.156 × 5.0 mm3) were acquired and used for the placement of the spectroscopy voxel. The scanning procedure took 40 min. A 2×5.5×3mm3 PRESS spectroscopic voxels (TE 135ms, TR 1500ms, 400avg, CHESS water suppression) was placed to cover both striata. 1H-MRS spectra were processed and the concentrations of the metabolites were derived using LCModel on a Linux operating system. LCModel uses a linear combination of model spectra of metabolite solutions in vitro to analyze the major resonances of in vivo spectra [14]. The area of the creatine peaks (Cr+PCr) was used to normalize the area of peaks of all other metabolites.
Measuring Ventricle sizes of rat’s brain on the MRI imaging
The ventricle size of these rats were analyzed using the FSL software, including two lateral ventricles, 3rd ventricle and 4th ventricle. Ventricle size was accessed using a T2 MRI scan, which resulted in the CSF within the ventricles showing up as a light gray to white color in the images. Imaging dimensions of voxels was increased by a factor of ten to compensate for the difference between human and rat brain size because of FSL is designed for human brains. BET was run to remove everything including skull and neck on the MRS images except for the brain [15]. After running BET, the program FAST was run [16]. The restore output gave a bias field corrected brain to view. Waxholm Rat was then used to scalable brain atlas and determine the ventricular system and entire brain by measuring the areas in voxels on each slice of the MRI imaging and then add the values of each slice together, for the ventricular system and entire brain, respectively. Normalization of the dimension of the ventricular system was acquired by the ratio of the voxels of all ventricles divided by the voxels of the entire brain consisting of the parenchyma and the ventricular system.
Results
Age and gender both affect the oxidative damage in the rat brains.
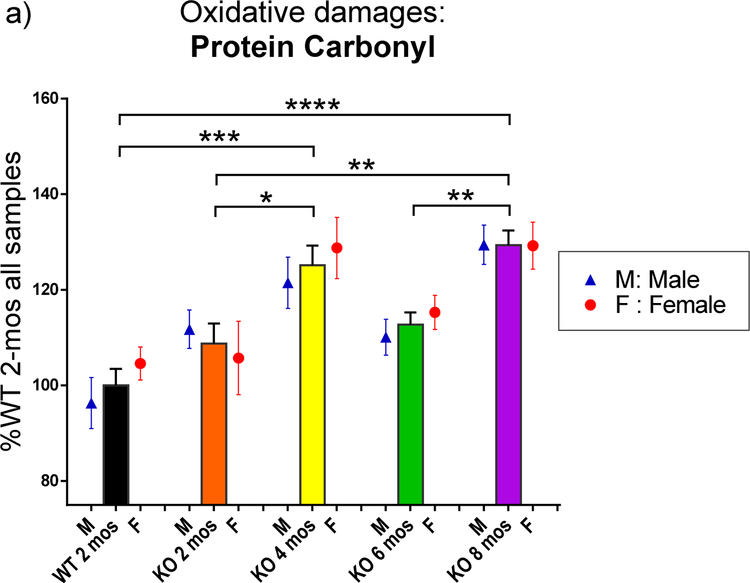
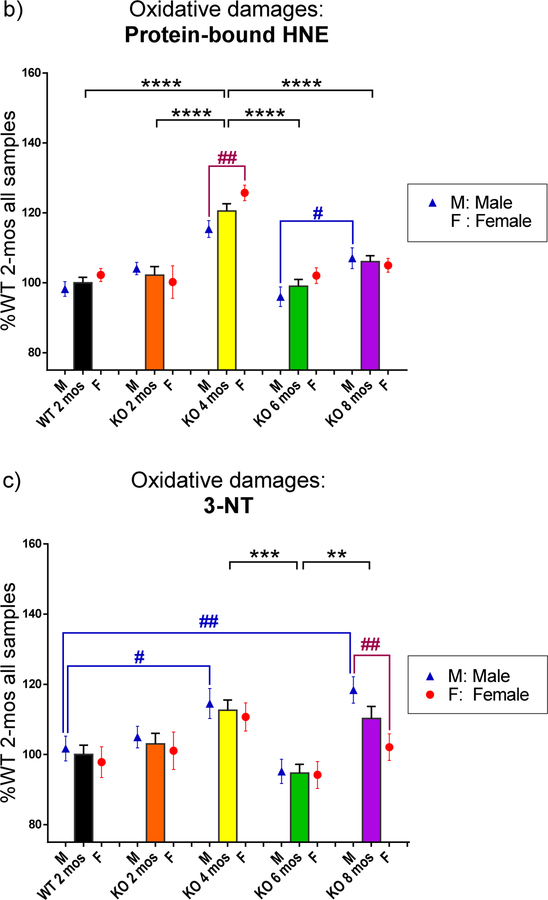
The rats were sacrificed at different ages (2 months, 4 months, 6 months and 8 months). Homogenates of rats brains were analyzed by the slot blot assay to measure the level of oxidative damage, including PC, HNE and 3-NT in the whole brain of WT and KO rats, male and female, by reading the intensity of bands for each sample. All intensities were normalized to the average of all samples of 2-mos WT group for each oxidative damage biomarker, respectively. The data are shown in percentage of 2 mos-old WT rats ( including both male and female). Data were analyzed by GraphPad Prism 6 with one-way ANOVA analysis followed with Tukey post-hoc correction for the function of age and multiple t-tests for the function of gender instead of two-way ANOVA analysis due to the uneven sample numbers for each group. PC, HNE and 3-NT levels are presented in Fig. 1–a, 1–b and 1–c, respectively. The bars represent oxidative damage levels in the brains of all rats, including both male and female at each genotype and age groups. The blue triangle and red circle symbols represent only male and female at different ages, respectively. In Fig. 1–a, 2 mos-old KO rats showed a trend of higher but not significant increased PC levels in the whole brain compared to WT rats at the same age (2 mos). Then, as the age increased, PC level increased at 4 mos in KO rats, significantly different from 2 mos-old WT rats (p<0.05). However, PC levels were reduced at the age of 6 mos in KO rat brain, and then significantly increased at 8 mos (p<0.01). PC levels of 8 mos-old KO rats also are significantly higher than both WT rats and KO rats both at 2 mos-old age (p<0.0001, p<0.01, respectively). Similar trends were observed after separation by gender. No significant differences between male and female in each group at the same age were observed.
Fig. 1.
The levels of the biomarker of oxidative damage: protein carbonyl, protein-bound HNE, and 3-NT in the brain of WT and PINK1 KO rats at different ages and genders. The oxidative damage levels were revealed by the intensity on slot blot of each brain sample and normalized the KO groups to the percentage of 2 mos-old WT level for each biomarker. Black stars (*) and significant lines marked the significant changes between different age and genotype groups, consisting of both male and female. Purple # and purple significant lines (in 1-b and 1-c) marked the significant changes between male and female at same age and genotype group. The levels of oxidative damage were affected more in the PINK1 KO rats. Blue # and blue significant lines (in 1-b and 1-c) were used to show significant changes among different age groups for only male rats when the male rats have additional significant changes compared to total sample groups. (a) The protein carbonyl (PC) levels change as age increased with all samples, including both male and female. Both genders follow a similar trend: KO rats reaching a high level at 4 mos of age, decreased at 6 mos, and increased again at 8 mos. WT 2-mos vs. KO 4-mos (***, p<0.001); WT 2-mos vs. KO 8-mos (****, p<0.0001); KO 2-mos vs. KO 4-mos (*, p<0.05); KO 2-mos vs. KO 8-mos (**, p<0.01); KO 6-mos vs. KO 8-mos (**, p<0.01). No significant differences between male and female were found at each age group. (b) The protein-bound HNE (shorted to HNE) levels changed as age increased with all samples, including both male and female. KO 4-mos rats showed a significantly higher level compared to all other groups. KO 4-mos vs. WT 2-mos (****, p<0.0001); KO 4-mos vs. KO 2-mos (****, p<0.0001); KO 4-mos vs. KO 6-mos (****, p<0.0001); KO 4-mos vs. KO 8-mos (****, p<0.0001). All female rat groups followed a similar pattern as the total sample groups with all four significant differences (significant lines were not shown; p<0.0001). However, significant increased HNE levels in KO male brain were observed from the 6 mos-old group to 8 mos-old group (blue #, p<0.05), instead of a significant difference between KO 4-mos group and KO 8-mos group of only males. At the age of 4 mos, a significant gender difference also was observed (purple ##, p<0.01). At this age, female KO rats are more affected by HNE damage than were male rats. (c) The 3-NT levels change as age increased with all samples, including both male and female. Both KO 4-mos group and KO 8-mos group showed significantly higher levels of 3-NT than the KO 6-mos group. KO 4-mos vs. KO 6-mos (***, p<0.001); KO 8-mos vs. KO 6-mos (**, p<0.01). Female rats groups followed a similar pattern as the total sample groups as age increased, but only one significant decreased level of 3-NT was observed in only female rats with increasing age, which is KO 4-mos female vs. KO 6-mos female (significant line was not shown, p<0.05). KO male rats demonstrated more changes in brain 3-NT levels compared to female rats. In addition to KO 6-mos male vs. KO 4-mos male (significant line was not shown, p<0.01) and KO 6-mos male vs. KO 8-mos male (significant line was not shown, p<0.01), significantly increased 3-NT levels also were observed when WT 2-mos male vs. KO 4-mos male (blue ##, p<0.01), and WT 2-mos male vs. KO 8-mos male (blue #, p<0.05). At age of 8 mos, a significant gender difference also was observed (purple ##, p<0.01). At this age, male KO rats were more affected by 3-NT damages than were female rats.
For all data in Figure 1, the numbers of individual rats were: (female WT, N=4; male WT, N=5; for the 2, 4, 6, and 8 mos-old male/ female KO, N= 6,8,8, and 7, respectively).
Fig. 1–b showed the HNE levels in the brains of rats. The trends as age increased show that HNE levels in the brain of KO rats at 4 mos were significantly higher than all other groups (p<0.0001) when analyzing all rats with both genders and also in analyzing only females (p<0.0001). The 4 mos-old male rats show significant increased HNE levels compared to 2 mos-old WT, 2 mos-old KO and 6 mos-old male KO rats (p<0.001, p<0.05, p<0.0001, respectively). The lower HNE levels at 6 mos of KO male rats were significantly elevated at 8 mos (p<0.05), which is similar to the trend of PC levels of 6 mos-old KO rats in Fig. 1–a. At the age of 4 mos-old, male KO rats have less HNE levels in the brains than the KO females.
Fig. 1–c shows the 3-NT levels in the brains of rats. The KO rats group at 6 mos of age showed a significant decreased 3-NT level in the brain compared to 4 and 8 mos-old KO rats in Fig. 1–c (p<0.001, p<0.01, respectively). Male KO rats have more significant changes than female KO rats as age increased. The 3-NT levels were significantly higher at 4 mos and 8 mos of age for KO male rats brain compared to 2 mos-old WT rat (p<0.05, p<0.01, respectively). A significant decrease of the level of 3-NT in the brain from 4 mos-old male KO rats also was observed at the age of 6 mos (p<0.01), which increased again at the age of 8 mos (p<0.001). Significant changes in female rats were less than those in male rats. The decreased level of 3-NT in the brains of KO female rats at the age of 6 mos is observed again (p<0.05). At the age of 8 mos-old, male KO rats have more 3-NT levels in the brains compared to female KO rats (p<0.01).
PINK1 KO male rats have larger ventricle size than female PINK1 KO rats at the same age, suggesting more edema occurs in male PINK1 KO rats.
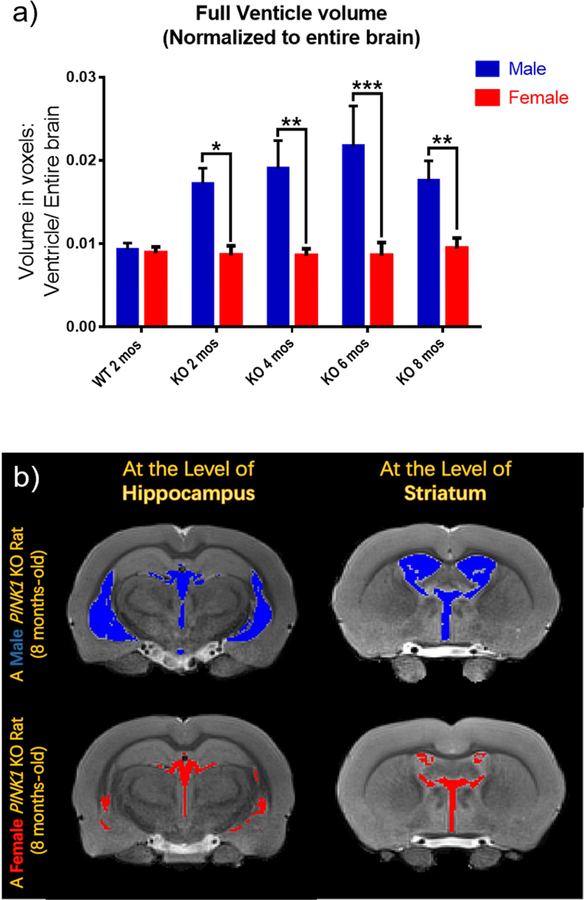
Ventricle sizes were normalized to the entire brain size and then were assessed for significance using multiple t-tests (Fig. 2–a). Male KO rats always showed significantly increased ventricle size compared to female KO rats at each age (p<0.05, p<0.01, p<0.001, p<0.01, respectively), consistent with the notion that more edema occurred in the brains of KO male rats. Fig. 2–b presents representive brain images with on MRI at the levels of both hippocampus and striatum. The brain images on the first row are from one male KO rat at 8 mos-old, in which the ventricles are marked with blue color, while the brain images on the second row are from one female KO rat at 8 mos-old, in which the ventricles are marked in red. The KO rats at 2, 4, and 6 mos old show the same pattern: ventricle sizes of male KO rats are larger than the ventricle sizes of female KO rats at the same age (images not shown). WT rats do not show this pattern.
Fig. 2.
The ventricle sizes were measured from MRI images. The dimensions of the entire brain and all ventricles including two lateral ventricles, 3rd ventricle, and 4th ventricle were measured using the Waxholm Rat program after adjusting all the factors. The dimensions were acquired in voxels for each individual slice image of each brain. The values of each slice were added together to obtain the size of ventricles or the entire brain. The size of the ventricular system was normalized to the size of the entire brain. a) In the PINK1 KO rats, the male rats showed significantly larger sizes of ventricles in brain compared to those of females at the same ages. No differences were observed between males and females in the WT group. b) Representive images of brains from one male and one female from the group of KO rats at 8 mos-old. Brain images are presented at levels of both hippocampus and striatum. Ventricles of the male KO rat are marked in blue, while those of the female KO rat are marked in red. The images support the data showing in Fig. 2-a that male KO rats have larger ventricles than female KO rats.
*p<0.05, **p<0.01, ***p<0.001. For the data in Fig. 2-a, the numbers of individual rats were: male WT, N=3; female WT, N=3; male KO, N=6 for each age; female KO, N=6 for 2 and 8 mos and N=5 for 4 and 6 mos).
Changes in neurochemical metabolites in striatum of rats were observed as age or gender varies.
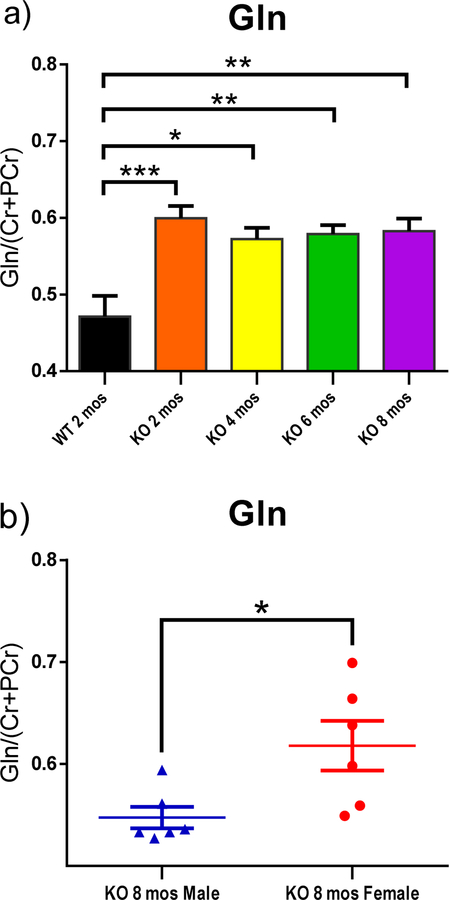
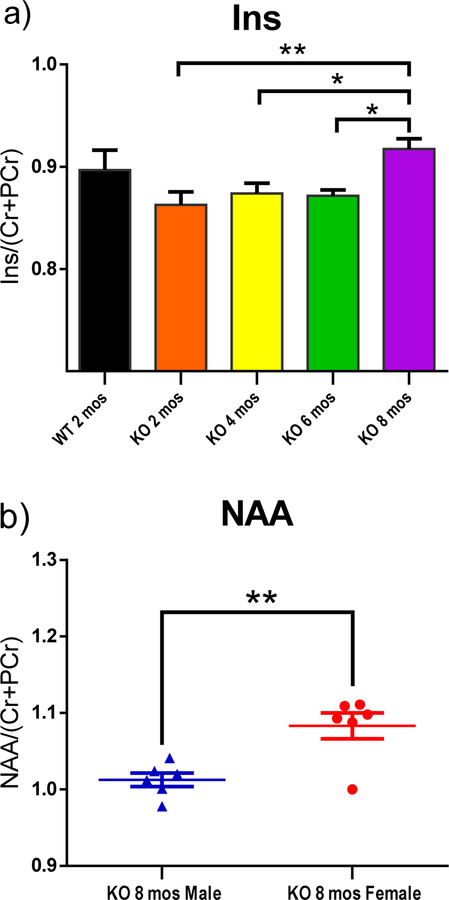
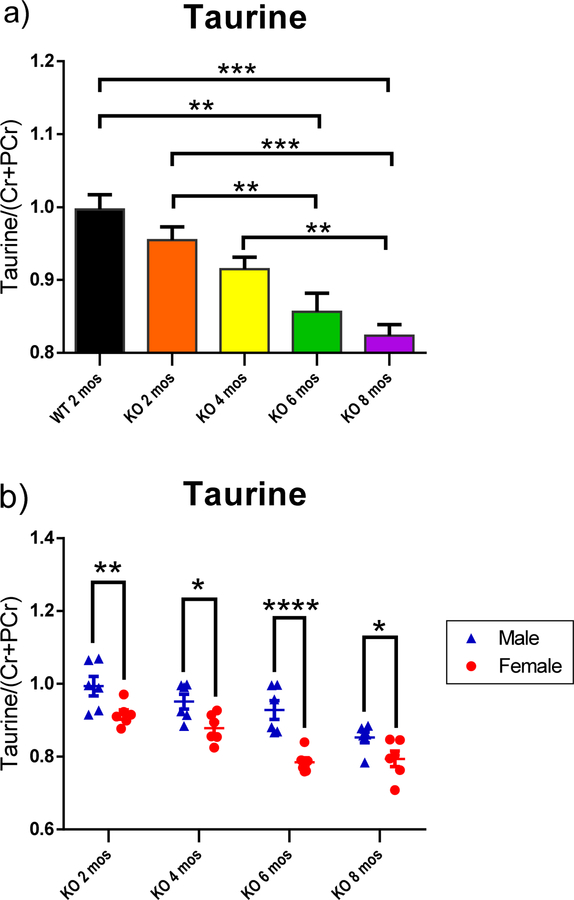
Bilateral H1-MRS scans of striatum revealed changes of metabolites, including glutamine (Gln), glutathione (GSH), taurine, inositol (Ins) and N-acetylaspartate (NAA) as functions of age and/ or gender (Fig. 3–5). Peak area of metabolites was divided by the total peak areas of Cr and PCr together. One-way ANOVA was used to analyze the results for the function of age, while multiple t-tests were applied to analyze the metabolites in the striatum at the same age with different genders. All of the KO rats showed a significantly higher level of Gln in the striatum compared to the WT control group (Fig. 3–a; p<0.001, p<0.05, p<0.01, and p<0.01 for 2,4,6, and 8 mos-old KO groups, respectively). A trend of decreased taurine was observed in the striatum as age increased (Fig. 4–a). The 6 mos-old KO group showed significantly decreased levels compared to both 2 mos-old WT and 2 mos-old KO group, respectively (p<0.01). The 8 mos-old KO group showed significantly decreased levels compared to 2 mos-old WT, 2 mos-old KO, and 4 mos-old KO group (p<0.001, p<0.001, p<0.01, respectively). In Fig. 5–a, the 2, 4, and 6 mos-old KO groups showed a decreased level of Ins in the striatum but not significantly compared to the WT group. The 8 mos-old KO rats showed a significantly increased level of Ins in the striatum compared to all other KO group of younger ages (p<0.01, p<0.05, p<0.05, respectively, for 2-, 4-, and 6-mos old KO rats). Gender differences are shown in Fig. 3–b, 3–c, 4–b, and 5–b. At the age of 8 mos, the female KO rats have significantly higher levels than male KO rats for metabolites Gln, GSH, and NAA in the striatum (Fig. 3–b, 3–c, 5–b ; p<0.05, p<0.01, p<0.01, respectively). The taurine levels in the striatum of KO male were always higher than KO female at all other ages (Fig. 4–b; p<0.01, p<0.05, p<0.0001, p<0.05, respectively).
Fig. 3.
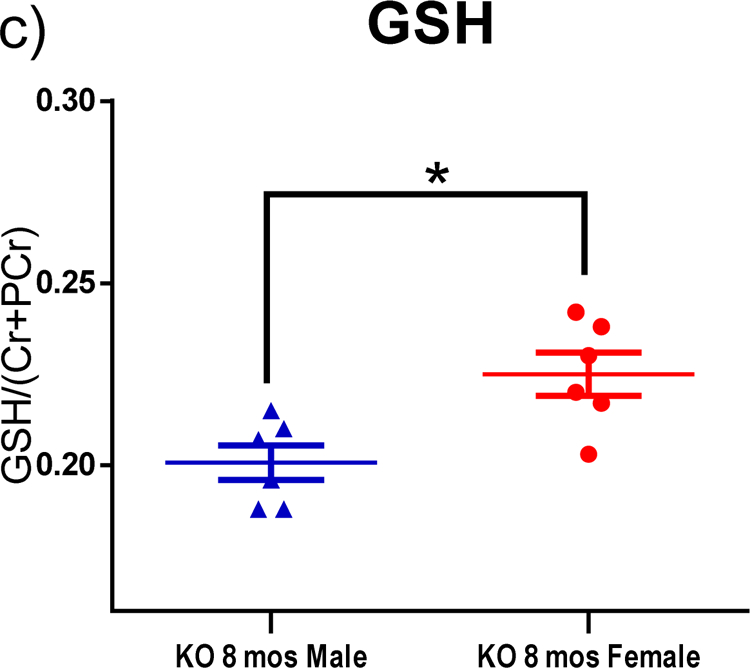
H1-MRS was used to quantify the changes in levels of neurochemical metabolites in the rat striatum. The peak area of each metabolite was divided by the total peak area of Cr and PCr together to normalize the levels of metabolites. (a) All KO groups at each age had significantly higher leves of Gln than the WT group. WT 2-mos vs. KO 2-mos (***, p<0.001). WT 2-mos vs. KO 4-mos (*, p<0.05). WT 2-mos vs. KO 6-mos (**, p<0.01). WT 2-mos vs. KO 8-mos (**, p<0.01). (b, c) In order to determine if brain levels of Gln or GSH were different in female and male KO rats at a given age, comparisons were made only among KO rats. At the age of 8 mos, female KO rats have higher levels of both Gln and GSH compared to male rats (*p<0.05). (WT, N=4; KO, N=12, with N=6 for both males and females).
Fig. 5.
H1-MRS was used to quantify the neurochemical metabolites changes in the rat striatum. The peak area of each metabolite was divided by the total peak area of Cr and PCr together to normalize the levels of metabolites. (a) The 8 mos-old KO rats showed increased levels of Ins in the striatum compared to the other three younger KO groups. KO 2-mos vs. KO 8-mos (**, p<0.01). KO 4-mos vs. KO 8-mos (*, p<0.05). KO 6-mos vs. KO 8-mos (*, p<0.05).
(b) NAA levels in the striatum of 8 mos-old female KO rats are higher than male at the same age. **p<0.01. (WT, N=4; KO, N=12, with N=6 for both males and females).
Fig. 4.
H1-MRS was used to quantify the neurochemical metabolites changes in the rat striatum. The peak area of each metabolite was divided by the total peak area of Cr and PCr together to normalize the levels of metabolites. (a) Taurine showed a decreased trend from 2 mos-old WT to 8 mos-old KO combined male and females animals. WT 2-mos vs. KO 6-mos (**, p<0.01). WT 2-mos vs. KO 8-mos (***, p<0.001). KO 2-mos vs. KO 6-mos (**, p<0.01). KO 2-mos vs. KO 8-mos (***, p<0.001). KO 4-mos vs. KO 8-mos (**, p<0.01). (b) In PINK1 KO rats striatum, the male has a higher level of taurine than female at each same age groups. *p<0.05, **p<0.01, ***p<0.001. (WT, N=4; KO, N=12, with N=6 for both males and females at each age group).
Discussion
The current paper focused on oxidative damage changes in the whole brain and levels of neurochemical metabolites in the striatum of PINK1 KO rats with increasing age and gender variation compared to 2 mos-old WT rats. Male and female KO rats at 2, 4, 6, 8 months of ages were selected. Biomarkers of oxidative damage, including protein carbonyls, protein-bound HNE, and 3-NT, all showed increased levels as age increased compared to the WT 2 months-aged rats. However, the levels of all types of oxidative damage had a similar trend, namely, a decreased at 6 months of age. The elevated markers of oxidative damage in this PD rat model are consistent with mitochondrial changes known in PD [5]. PINK1 is a monitor of mitochondrial structure and function [17], and mutations in PINK1 are a known cause of familial PD [9]. Mutations in PINK1 likely result in excess superoxide leak from damaged mitochondria and could be related to our observed elevated oxidative damage in brain of PINK1 KO rats, since the ultimate mutation in PINK1 is the absence of the gene.
In addition, ventricle size in the rat brain and neurochemical metabolites level in the striatum, including NAA, Gln, GSH and taurine, also exhibited greater changes in male KO rats, which are consonant with the known increased risk to develop PD among males.
The possibly earliest PD biomarker that appears before symptoms, decreased glutathione (GSH) and elevated GSSG, the oxidized form of GSH in the parenchyma [18,19], could contribute to higher oxidative damage in KO rats at younger ages. Blood GSH decreased in the blood of PD patients with age [20]. The reason for the decreased levels of all types of oxidative damage at 6 mos age for KO rats is unknown; we speculate that this could be due to compensatory responses in the brain. PINK1 KO mice started to show a PD phenotype when a decreased level of dopamine was observed [21]. The accumulation of oxidative damage conceivably triggered PD symptoms and compensation. However, as age increased with consequent more impaired mitochondria and neurons, the oxidative damage increased again as observed here at 8 mos in brains of KO rats (Fig. 1a, 1b, 1c).
The MRS studies in the current study were on the striatum, which involves both motor and rewards systems. Synaptic plasticity and decreased dopamine release were found in the striatum of PINK1 KO mice [22]. The ventricular system in the brain parenchyma is filled with cerebrospinal fluid (CSF), and the choroid plexus is where CSF is produced. CSF circulates up and around the brain and is absorbed into the venous system to protect the brain, to support cerebral blood flow, and to maintain brain homeostasis. Idiopathic normal pressure hydrocephalus was found in a patient with parkinsonism and initially consistent with PD symptoms [23]. The observed larger ventricle sizes of the male brain at all ages of PINK1 KO rats (Fig. 4) conceivably could be due to hydrocephaluism. Our results provide a hypothesis to potentially explain why males have a higher risk to develop PD compared to females.
DA and Glu signaling are dysregulated in the PD striatum [24]. Gln is one source for making Glu then forming GSH, but extra Gln could lead to excitotoxicity. In the current study, the higher level of Gln in the striatum of KO groups at all ages compared to 2 mos-old WT group (Fig. 5–a) is consistent with the known decreased plasma GSH level, an early biomarker of PD [18,19]. Here we observed in striatum of 8 mos-old male KO rats decreased levels of both Gln and GSH compared to those of females (Fig. 5–b,c). The accumulation of Gln compared to WT rats is consistent with the observations that less GSH and Glu were found in PD [25]. DA denervation may regulate glutamatergic signals and neural plasticity [26]. A glutamate antagonist led to anti-akinetic effects in PD mice [26]. γ-Glutamyl cysteine ligase, a Nrf2-dependent enzyme, is the rate-limiting enzyme during synthesis of GSH, under control of the vitagene network [27]. The vitagene network is composed of several genes that can sense and respond to cellular stress to sustain homeodynamics in vivo [27,28]. Vitagenes can upregulate anti-oxidant and anti-apoptic molecules, including GSH [29]. In the brain, vitagenes are involved in redox homeostasis and integrated survival responses [27]. Consistent with the notion that male gender confers a higher risk to develop PD, our result in Fig. 3–c, showing that female KO rats have higher levels of GSH than male KO rats, suggest a higher stress tolerance than do male KO rats at 8 mos of age. This result conceivably could be contributed to by the regulation of estrogen, a notion consistent with the finding that estradiol could upregulate the antioxidant expression in human erythrocytes during the menstrual cycle [30].
Taurine is an amino sulfonic acid that is important for neuroprotection and calcium homeostasis [31]. Taurine also is associated with mitochondrial function and oxidative damage [32,33]. We showed in this study that the taurine levels in the striatum had a decreasing trend (Fig. 4–a). The level of taurine of 6 mos-old KO group was significantly lower than the taurine levels of 2-mos WT and 2-mos KO groups. At 8 mos of age, the taurine level in the KO group was significantly lower than the WT control group, 2- and 4-mos old KO groups, respectively. The males always appeared to have higher levels than females in each KO age group (Fig. 4–b). Decreased levels of taurine were found in PD patients [34], supporting our results that PINK1 KO rats had a decreased level of taurine in the striatum. Another study on PINK1 KO rats also showed that the taurine level is lower in the PINK1 KO rats at 18 weeks (4.5 months) but became higher at 34 weeks (8.5 months) [31].
NAA and Ins are commonly assessed by MRS for neurodegenerative diseases [35]. NAA is located in neurons and is involved in neuronal metabolism and integrity. About 5 percent decreased NAA levels were observed in the lentiform nucleus of PD patients [36]. We did not observe a decreasing trend of NAA dependent on age. However, the higher level of NAA in female KO groups than male KO groups at the age of 8 mos (Fig. 5b) indicated that females might have healthier neuronal conditions than male under stress from PINK1 deficiency and aging, consistent with the oxidative damage observed in this current study (Fig. 1). The inositol level increased at 8 mos of age in KO rats (Fig. 5–a), suggesting glial activation could become highly mobilized, with more inflammatory cytokines as a consequence, in later stages of PD.
Our results provided the profiles of oxidative damage in the whole brain and neurochemical metabolites in the striatum of PINK1 KO rats at different ages and genders. Oxidative damage could be a crucial factor for PD. The identified metabolites could be considered as potential diagnostic markers and contribute to the gender differences in PD well. This PINK1 KO rat, though not perfect model for PD {indeed, immunohistochemistry analysis could not detect α-synuclein deposits in brain at different ages (data not shown)}, other aspects of this PINK1 KO rat model are consistent with characteristics of PD including gender risk and enlarged ventricles, and oxidative damage. With the caveats noted, researchers potentially could benefit by investigations of mechanisms of PD in this relevant PD model.
Highlights.
Oxidative damage in the brain of PINK1 KO rats followed a pattern that the oxidative damages increased at 4-month-old, decreased at 6-month-old, and increased again at 8-month-old.
Male PINK1 KO rats have larger sizes of ventricular systems in the brain than female PINK1 KO rats.
Neurometabolites in the striatum of PINK1 KO rats including glutathione, glutamine, taurine, inositol, and N-acetylaspartate change as age increasing and gender varying.
Acknowledgments
We thank Luke Potter and Shekinah Alfaro for technical assistances. This work was supported in part by a NIH grant to D. A. B [1R21NS094891].
Footnotes
Publisher's Disclaimer: This is a PDF file of an unedited manuscript that has been accepted for publication. As a service to our customers we are providing this early version of the manuscript. The manuscript will undergo copyediting, typesetting, and review of the resulting proof before it is published in its final citable form. Please note that during the production process errors may be discovered which could affect the content, and all legal disclaimers that apply to the journal pertain.
Reference
- [1].Pinares-Garcia P, Stratikopoulos M, Zagato A, Loke H, Lee J, Sex: A Significant Risk Factor for Neurodevelopmental and Neurodegenerative Disorders, Brain Sci 8 (2018) 154. doi: 10.3390/brainsci8080154. [DOI] [PMC free article] [PubMed] [Google Scholar]
- [2].Poewe W, Seppi K, Tanner CM, Halliday GM, Brundin P, Volkmann J, Schrag A-E, Lang AE, Parkinson disease, Nat. Rev. Dis. Primer 3 (2017) 17013. doi: 10.1038/nrdp.2017.13. [DOI] [PubMed] [Google Scholar]
- [3].Triplett JC, Zhang Z, Sultana R, Cai J, Klein JB, Büeler H, Butterfield DA, Quantitative expression proteomics and phosphoproteomics profile of brain from PINK1 knockout mice: insights into mechanisms of familial Parkinson’s disease, J. Neurochem 133 (2015) 750–765. doi: 10.1111/jnc.13039. [DOI] [PubMed] [Google Scholar]
- [4].Grünewald A, Kumar KR, Sue CM, New insights into the complex role of mitochondria in Parkinson’s disease, Prog. Neurobiol (2018). doi: 10.1016/j.pneurobio.2018.09.003. [DOI] [PubMed] [Google Scholar]
- [5].Greenamyre JT, What’s wrong with mitochondria in Parkinson’s disease?, Mov. Disord 33 (2018) 1515–1517. doi: 10.1002/mds.98. [DOI] [PubMed] [Google Scholar]
- [6].Wood-Kaczmar A, Gandhi S, Yao Z, Abramov AY, Abramov ASY, Miljan EA, Keen G, Stanyer L, Hargreaves I, Klupsch K, Deas E, Downward J, Mansfield L, Jat P, Taylor J, Heales S, Duchen MR, Latchman D, Tabrizi SJ, Wood NW, PINK1 is necessary for long term survival and mitochondrial function in human dopaminergic neurons, PloS One 3 (2008) e2455. doi: 10.1371/journal.pone.0002455. [DOI] [PMC free article] [PubMed] [Google Scholar]
- [7].Pickrell AM, Youle RJ, The Roles of PINK1, Parkin and Mitochondrial Fidelity in Parkinson’s Disease, Neuron 85 (2015) 257–273. doi: 10.1016/j.neuron.2014.12.007. [DOI] [PMC free article] [PubMed] [Google Scholar]
- [8].Akundi RS, Huang Z, Eason J, Pandya JD, Zhi L, Cass WA, Sullivan PG, Büeler H, Increased mitochondrial calcium sensitivity and abnormal expression of innate immunity genes precede dopaminergic defects in Pink1-deficient mice, PloS One 6 (2011) e16038. doi: 10.1371/journal.pone.0016038. [DOI] [PMC free article] [PubMed] [Google Scholar]
- [9].Jiang P, Dickson DW, Parkinson’s disease: experimental models and reality, Acta Neuropathol. (Berl.) 135 (2018) 13–32. doi: 10.1007/s00401-017-1788-5. [DOI] [PMC free article] [PubMed] [Google Scholar]
- [10].Cantuti-Castelvetri I, Keller-McGandy C, Bouzou B, Asteris G, Clark TW, Frosch MP, Standaert DG, Effects of gender on nigral gene expression and parkinson disease, Neurobiol. Dis 26 (2007) 606–614. doi: 10.1016/j.nbd.2007.02.009. [DOI] [PMC free article] [PubMed] [Google Scholar]
- [11].Dawson TM, Ko HS, Dawson VL, Genetic animal models of Parkinson’s disease, Neuron 66 (2010) 646–661. doi: 10.1016/j.neuron.2010.04.034. [DOI] [PMC free article] [PubMed] [Google Scholar]
- [12].Castegna A, Drake J, Pocernich C, Butterfield DA, Protein Carbonyl Levels—An Assessment of Protein Oxidation, in: Hensley K, Floyd RA (Eds.), Methods Biol. Oxidative Stress, Humana Press, Totowa, NJ, 2003: pp. 161–168. doi: 10.1385/1-59259-424-7:161. [DOI] [Google Scholar]
- [13].Sultana R, Butterfield DA, Slot-blot analysis of 3-nitrotyrosine-modified brain proteins, Methods Enzymol 440 (2008) 309–316. doi: 10.1016/S0076-6879(07)00820-8. [DOI] [PubMed] [Google Scholar]
- [14].Provencher SW, Estimation of metabolite concentrations from localized in vivo proton NMR spectra, Magn. Reson. Med 30 (1993) 672–679. doi: 10.1002/mrm.1910300604. [DOI] [PubMed] [Google Scholar]
- [15].Smith SM, Fast robust automated brain extraction, Hum. Brain Mapp 17 (2002) 143–155. doi: 10.1002/hbm.10062. [DOI] [PMC free article] [PubMed] [Google Scholar]
- [16].Zhang Y, Brady M, Smith S, Segmentation of brain MR images through a hidden Markov random field model and the expectation-maximization algorithm, IEEE Trans. Med. Imaging 20 (2001) 45–57. doi: 10.1109/42.906424. [DOI] [PubMed] [Google Scholar]
- [17].Deas E, Plun-Favreau H, Wood NW, PINK1 function in health and disease, EMBO Mol. Med 1 (2009) 152–165. doi: 10.1002/emmm.200900024. [DOI] [PMC free article] [PubMed] [Google Scholar]
- [18].Mischley LK, Standish LJ, Weiss NS, Padowski JM, Kavanagh TJ, White CC, Rosenfeld ME, Glutathione as a Biomarker in Parkinson’s Disease: Associations with Aging and Disease Severity, Oxid. Med. Cell. Longev 2016 (2016). doi: 10.1155/2016/9409363. [DOI] [PMC free article] [PubMed] [Google Scholar]
- [19].Chinta SJ, Rajagopalan S, Butterfield DA, Andersen JK, In vitro and in vivo neuroprotection by gamma-glutamylcysteine ethyl ester against MPTP: relevance to the role of glutathione in Parkinson’s disease, Neurosci. Lett 402 (2006) 137–141. doi: 10.1016/j.neulet.2006.03.056. [DOI] [PubMed] [Google Scholar]
- [20].Mischley LK, Standish LJ, Weiss NS, Padowski JM, Kavanagh TJ, White CC, Rosenfeld ME, Glutathione as a Biomarker in Parkinson’s Disease: Associations with Aging and Disease Severity, Oxid. Med. Cell. Longev 2016 (2016). doi: 10.1155/2016/9409363. [DOI] [PMC free article] [PubMed] [Google Scholar]
- [21].Akundi RS, Huang Z, Eason J, Pandya JD, Zhi L, Cass WA, Sullivan PG, Büeler H, Increased Mitochondrial Calcium Sensitivity and Abnormal Expression of Innate Immunity Genes Precede Dopaminergic Defects in Pink1-Deficient Mice, PLOS ONE 6 (2011) e16038. doi: 10.1371/journal.pone.0016038. [DOI] [PMC free article] [PubMed] [Google Scholar]
- [22].Kitada T, Pisani A, Porter DR, Yamaguchi H, Tscherter A, Martella G, Bonsi P, Zhang C, Pothos EN, Shen J, Impaired dopamine release and synaptic plasticity in the striatum of PINK1-deficient mice, Proc. Natl. Acad. Sci. U. S. A 104 (2007) 11441–11446. doi: 10.1073/pnas.0702717104. [DOI] [PMC free article] [PubMed] [Google Scholar]
- [23].Cucca A, Biagioni MC, Sharma K, Golomb J, Gilbert RM, Di Rocco A, Fleisher JE, Comorbid Normal Pressure Hydrocephalus with Parkinsonism: A Clinical Challenge and Call for Awareness, Case Rep. Neurol. Med (2018). doi: 10.1155/2018/2513474. [DOI] [PMC free article] [PubMed] [Google Scholar]
- [24].Gardoni F, Bellone C, Modulation of the glutamatergic transmission by Dopamine: a focus on Parkinson, Huntington and Addiction diseases, Front. Cell. Neurosci 9 (2015). doi: 10.3389/fncel.2015.00025. [DOI] [PMC free article] [PubMed] [Google Scholar]
- [25].Buchanan RJ, Darrow DP, Meier KT, Robinson J, Schiehser D, Glahn D, Nadasdy Z, Changes in GABA and glutamate concentrations during memory tasks in patients with Parkinson’s disease undergoing DBS surgery, Front. Hum. Neurosci 8 (2014). doi: 10.3389/fnhum.2014.00081. [DOI] [PMC free article] [PubMed] [Google Scholar]
- [26].Lange KW, Kornhuber J, Riederer P, Dopamine/glutamate interactions in Parkinson’s disease, Neurosci. Biobehav. Rev 21 (1997) 393–400. doi: 10.1016/S0149-7634(96)00043-7. [DOI] [PubMed] [Google Scholar]
- [27].Miquel S, Champ C, Day J, Aarts E, Bahr BA, Bakker M, Bánáti D, Calabrese V, Cederholm T, Cryan J, Dye L, Farrimond JA, Korosi A, Layé S, Maudsley S, Milenkovic D, Mohajeri MH, Sijben J, Solomon A, Spencer JPE, Thuret S, Vanden Berghe W, Vauzour D, Vellas B, Wesnes K, Willatts P, Wittenberg R, Geurts L, Poor cognitive ageing: Vulnerabilities, mechanisms and the impact of nutritional interventions, Ageing Res. Rev 42 (2018) 40–55. doi: 10.1016/j.arr.2017.12.004. [DOI] [PubMed] [Google Scholar]
- [28].Calabrese V, Santoro A, Salinaro AT, Modafferi S, Scuto M, Albouchi F, Monti D, Giordano J, Zappia M, Franceschi C, Calabrese EJ, Hormetic approaches to the treatment of Parkinson’s disease: Perspectives and possibilities, J. Neurosci. Res (2018). doi: 10.1002/jnr.24244. [DOI] [PubMed] [Google Scholar]
- [29].Calabrese V, Scapagnini G, Davinelli S, Koverech G, Koverech A, De Pasquale C, Salinaro AT, Scuto M, Calabrese EJ, Genazzani AR, Sex hormonal regulation and hormesis in aging and longevity: role of vitagenes, J. Cell Commun. Signal 8 (2014) 369–384. doi: 10.1007/s12079-014-0253-7. [DOI] [PMC free article] [PubMed] [Google Scholar]
- [30].SHENG-HUANG C, CHIEH-HSIN C, MU-CHUN Y, WEN-TUNG H, CHIA-YING H, YA-TING H, WAN-LING S, JIUAN-JEN S, CHIH-YANG H, JER-YUH L, Effects of estrogen on glutathione and catalase levels in human erythrocyte during menstrual cycle, Biomed. Rep 3 (2015) 266–268. doi: 10.3892/br.2014.412. [DOI] [PMC free article] [PubMed] [Google Scholar]
- [31].Villeneuve LM, Purnell PR, Boska MD, Fox HS, Early Expression of Parkinson’s Disease-Related Mitochondrial Abnormalities in PINK1 Knockout Rats, Mol. Neurobiol 53 (2016) 171–186. doi: 10.1007/s12035-014-8927-y. [DOI] [PMC free article] [PubMed] [Google Scholar]
- [32].Schaffer SW, Azuma J, Mozaffari M, Role of antioxidant activity of taurine in diabetes, Can. J. Physiol. Pharmacol 87 (2009) 91–99. doi: 10.1139/Y08-110. [DOI] [PubMed] [Google Scholar]
- [33].Hansen SH, Andersen ML, Cornett C, Gradinaru R, Grunnet N, A role for taurine in mitochondrial function, J. Biomed. Sci 17 (2010) S23. doi: 10.1186/1423-0127-17-S1-S23. [DOI] [PMC free article] [PubMed] [Google Scholar]
- [34].Engelborghs S, Marescau B, De Deyn PP, Amino acids and biogenic amines in cerebrospinal fluid of patients with Parkinson’s disease, Neurochem. Res 28 (2003) 1145–1150. [DOI] [PubMed] [Google Scholar]
- [35].Saeed U, Compagnone J, Aviv RI, Strafella AP, Black SE, Lang AE, Masellis M, Imaging biomarkers in Parkinson’s disease and Parkinsonian syndromes: current and emerging concepts, Transl. Neurodegener 6 (2017) 8. doi: 10.1186/s40035-017-0076-6. [DOI] [PMC free article] [PubMed] [Google Scholar]
- [36].Firbank MJ, Harrison RM, O’Brien JT, A comprehensive review of proton magnetic resonance spectroscopy studies in dementia and Parkinson’s disease, Dement. Geriatr. Cogn. Disord 14 (2002) 64–76. doi: 10.1159/000064927. [DOI] [PubMed] [Google Scholar]


