Abstract
Elevation of blood triglycerides, primarily triglyceride-rich lipoproteins (TGRL), is an independent risk factor for cardiovascular disease and vascular dementia (VaD). Accumulating evidence indicates that both atherosclerosis and VaD are linked to vascular inflammation. However, the role of TGRL in vascular inflammation, which increases risk for VaD, remains largely unknown and its underlying mechanisms are still unclear. We strived to determine the effects of postprandial TGRL exposure on brain microvascular endothelial cells, the potential risk factor of vascular inflammation, resulting in VaD. We showed in Aung et al., J Lipid Res., 2016 that postprandial TGRL lipolysis products (TL) activate mitochondrial reactive oxygen species (ROS) and increase the expression of the stress-responsive protein, activating transcription factor 3 (ATF3), which injures human brain microvascular endothelial cells (HBMECs) in vitro. In this study, we deployed high-throughput sequencing (HTS)-based RNA sequencing methods and mito stress and glycolytic rate assays with an Agilent Seahorse XF analyzer and profiled the differential expression of transcripts, constructed signaling pathways, and measured mitochondrial respiration, ATP production, proton leak, and glycolysis of HBMECs treated with TL.
Conclusions
TL potentiate ROS by mitochondria which activate mitochondrial oxidative stress, decrease ATP production, increase mitochondrial proton leak and glycolysis rate, and mitochondria DNA damage. Additionally, CPT1A1 siRNA knockdown suppresses oxidative stress and prevents mitochondrial dysfunction and vascular inflammation in TL treated HBMECs. TL activates ATF3-MAPKinase, TNF, and NRF2 signaling pathways. Furthermore, the NRF2 signaling pathway which is upstream of the ATF3-MAPKinase signaling pathway, is also regulated by the mitochondrial oxidative stress. We are the first to report differential inflammatory characteristics of transcript variants 4 (ATF3-T4) and 5 (ATF3-T5) of the stress responsive gene ATF3 in HBMECs induced by postprandial TL. Specifically, our data indicates that ATF3-T4 predominantly regulates the TL-induced brain microvascular inflammation and TNF signaling. Both siRNAs of ATF3-T4 and ATF3-T5 suppress cells apoptosis and lipotoxic brain microvascular endothelial cells. These novel signaling pathways triggered by oxidative stress-responsive transcript variants, ATF3-T4 and ATF3-T5, in the brain microvascular inflammation induced by TGRL lipolysis products may contribute to pathophysiological processes of vascular dementia.
Keywords: Mitochondrial oxidative stress, activating transcription factor 3, inflammation, brain microvascular endothelial cells, lipolysis, triglyceride-rich lipoproteins, RNA-Seq
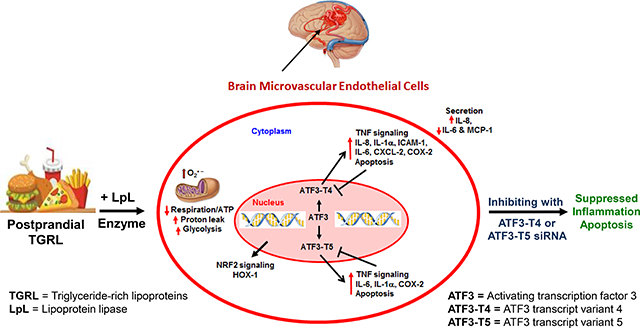
Graphical Abstract
INTRODUCTION
In 2018, an estimated 5.7 million Americans of all ages are living with Alzheimer’s dementia and 1 in 10 people age 65 and older has Alzheimer’s disease [1]. Recent studies suggest that not only vascular dementia (VaD) but also Alzheimer’s disease (AD) could be exacerbated by vascular inflammation and metabolic factors [2]. Brain neurovascular inflammation is fundamental to the development of VaD and AD [3,4]. Further, the Western diet (WD), hyperlipidemia, and insulin resistance have been strongly associated with the development of dementia [5]. Human and animal studies show a strong association between WD consumption, brain neurovascular inflammation, and development of dementia [6,7]. Elevated plasma triglyceride disrupted the blood-brain barrier (BBB) in mice fed with WD [8,9]. Recent work has established links between vascular disorders, such as dyslipidemia and vascular disease, and the exacerbation of VaD [10]. One of the potential stress-inducers of neurovascular inflammation is triglyceride-rich lipoproteins (TGRL) and their lipolysis products.
Lipoprotein lipase (LpL) is anchored to the brain microvascular endothelium, where it binds and hydrolyzes TGRL particles to smaller lipolysis products, such as fatty acids (FAs) [11] in the vascular system.Although LpL enzymes are anchored on the endothelial cells in vivo physiological system [12,13], LpL enzymes are not present in vitro cell cultured HBMECs [14,15]. This process results in TGRL remnant particle formation and lipolysis products such as phospholipids and FAs [16]. Our studies and those of others showed that TGRL lipolysis products (TL) and specific FAs at high physiological and supraphysiological concentrations can potentially injure the endothelium directly [12,13,17,18]. Further, we have shown that TL induce systemic vascular [14,19] and neurovascular injuries elevating expression of mitochondrial reactive oxygen species (ROS) [15], which increases the permeability of the BBB, and/or injures astrocytes and neurons within the brain [20,21]. Additionally, activating transcription factor 3 (ATF3) appears to play an important role as a master regulator of inflammation in the both aortic [12,18] and brain microvascular endothelium [14,15,19] in response to TL. The ATF3 is up-regulated in age-related cognitive decline and neurodegeneration models [22]. ATF3 is expressed under stress condition in the brain with seizures [23,24] and in injured neurons of peripheral nerve [25,26], in central nervous system (CNS) glia [27], and in hippocampus [28,29], which have associations with various neurological and cognitive functions.
We have previously shown that ATF3 is up-regulated in response to TL through interaction with the stress activated mitogen-activated protein kinases (MAPK) pathway and forms the activator protein (AP-1) complex in association with c-Jun [12,30]. Our prior studies used results from gene expression arrays which are designed to detect known mRNA sequences. In the present study, we evaluated the overall transcriptional response using high-throughput sequencing technologies (HTS)-based RNA sequencing (RNA-Seq) technology to better determine the full spectrum of RNA transcripts and deduce signaling pathways induced by TL. We also determined mitochondrial respiration and fatty acid-derived biofuel production in HBMECs regulated by TL through mitochondrial β-oxidation using CPT1A1 siRNA knockdown. Results of RNA-seq analysis identified 8 ATF3 transcript variants, two of which were selectively up-regulated in response to TL. This then led us to evaluate the functional significance of ATF3 transcript variants in endothelial proinflammatory responses.
MATERIALS AND METHODS
Human TGRL isolation
The protocol for obtaining human TGRL (Protocol No. 447043) was approved by the Human Subjects Review Committee/IRB at the University of California Davis and informed consents were obtained from all study subjects. Healthy adult human volunteers consumed a moderately high-fat meal containing at least 40% fat, and postprandial (3.5 h) blood was collected by standard venipuncture (Vacutainer K2EDTA tubes; BD, Franklin Lakes, NJ). We recruited five to six human donors/week, pooled the plasma, and isolated TGRLs. Over the years, we have found the data were very consistent using this method of collection and pooling of TGRLs [12,15].
Whole blood samples were then centrifuged at 3,000 rpm for 15 min at 4°C, and the plasma fraction was collected. Sodium azide was added to the plasma as a preservative. TGRL were isolated from human plasma at a density of less than 1.0063 g/mL following an 18 h centrifugation at 40,000 rpm in a SW41 Ti swinging bucket rotor (Beckman Coulter, Sunnyvale, CA) held at 14°C within a Beckman L8–70M (Beckman) ultracentrifuge. The top fraction TGRL was collected and dialyzed in Spectrapor membrane tubing (mol wt cut off 3,500; Spectrum Medical Industries, Los Angeles, CA) at 4°C overnight against a saline solution containing 0.01% EDTA. Total triglyceride content of samples was determined using the serum triglyceride determination kit, Sigma. The kit converts triglycerides to free fatty acids (FFAs) and glycerol. Glycerol is assayed enzymatically. The average pooled TGRL concentration was ~700–800 mg/dL. For these experiments, we pooled TGRL isolated from donors. We used 150 mg/dL concentration to treat endothelial cells in our study. After isolation, human TGRL was used within a week.
Reagents and antibodies
Lipoprotein lipase (LpL) (L2254), serum triglyceride determination kit (TR0100), monoclonal anti-β-actin antibody (A 5441), Oil Red O (O0625), and Nile Red (72485) were purchased from Sigma, St. Louis, MO. Scrambled or negative control siRNA (AM4611) and ATF3 transcript variant 4 siRNA (ATF3-I4) (Gene Bank: NM_001040619.2, AM16810, siRNA ID – s530265), (5′-GGCUGUUGACUCAUGCAAAtt-3′; 3′-UUUGCAUGAGUCAACAGCCca-5′), were purchased from Ambion (Carlsbad, CA) and ATF3 transcript variant 5 siRNA (ATF3-I5) (Gene Bank: NM_001206484.2, Duplex oligo 1-ATF3–005), (5′-AGCAGCAUUUGAUAUACAUGCUCAA-3′; 3′-CUUCGGUCGUAAACUAUAUGUACGAGUU-5′), CPT1A1 siRNA (Gene Bank: NM_001876, Duplex hs.Ri.CPT1A1 13.1), (5′-GAAGCUCUUAGACAAAUCUAUCUCT-3′; 3′-UACUUCGAGAAUCUGUUUAGAUAGAGA-5′), CPT1A1 siRNA (Gene Bank: NM_001031847, Duplex hs.Ri.CPT1A1 13.2), (5′-GCCUUUACGUGGUGUCUAAAUAUCT-3′; 3′-GACGGAAAUGCACCACAGAUUUAUAGA-5′), and (Gene Bank: NM_001876, Duplex hs.Ri.CPT1A1 13.3), (5′-UCAAUGGACAGCUACGCCAAAUCTC-3′; 3′-GCAGUUACCUGUCGAUGCGGUUUAGAG-5′) were purchased from Integrated DNA Technologies Inc (Coralville, IA). Spin trap 1-hydroxy-3-carboxy-2,2,5,5-tetramethylpyrrolidine (CP-H) (#ALX-430–078) was purchased from Enzo Life Sciences, Inc., Farmingdale, NY. PCR primers were purchased from Operon (Huntsville, AL) and Integrated DNA Technologies, Inc. (Coralville, IA). Antibodies were purchased from the following sources: ATF3 (sc-188), CHAC1 (sc-33321), JDP2 (sc-367695), c-Jun (sc-1694), COX-2 (sc-1747), p53 (sc-6243) from Santa Cruz Biotechnology (Santa Cruz, CA); ATF4 (#11815), p-c-Jun (#9261), JunB (#3753), DR5 (#8074), NRF2 (#12721), TNFR1 (#3736), PARP (#9532), Caspase-9 (#9502), Cleaved Caspase-9 (#9501), anti-mouse IgG HRP-linked secondary antibody (#7076) or anti-rabbit HRP-linked secondary antibody (#7074) from Cell Signaling Technology (Danvers, MA); Caspase-3 (Pro and Active) (NB100–56708) from Novus Biologicals (Littleton, CO); anti-goat IgG HRP-linked secondary antibody (HAF019) from R & D Systems (Minneapolis, MN); Anti-eIF2α phosphor specific antibody (44728G) from Invitrogen (Camarillo, CA); Human ELISA kits were purchased from following sources: DuoSet ELISA Hu CCL2/MCP-1 (DY279), Hu CCL3/MIP-1α (DY270), and Hu CCL20/MIP-3α from R & D system (Minneapolis, MN); and BD OptEIA™ Hu IL-8 (555244), Hu IL-6 (555220), Hu IL-1β (557953), and Hu TNF (555212) from BD Biosciences (San Diego, CA). Seahorse XF Base Medium (w/o phenol) (103335–100), Seahorse XF Cell Mito Stress Test Kit (103010–100), and Glycolytic Rate Assay kit (103346–100) were purchased from Aglient (Santa Clara, CA).
Cell culture and lipid treatments
Human brain microvascular endothelial cells (HBMECs) were obtained from Angio-Proteomie (Boston, MA) and cultured in EGM™−2MV BulletKit™ containing 5% serum (CC-3202, Lonza, Walkersville MD) in a 37°C incubator with a humidified 5% CO2 and 95% air environment. Medium was changed every other day until 90% confluency and cells were used at passage 6. One hour prior to experiments, cell culture medium was changed to fresh medium. Cells were exposed for 3 h to the following conditions: media, TGRL (150 mg/dL =1.5 mg/mL), lipoprotein lipase (LpL) (2 U/mL), and TGRL hydrolyzed with lipoprotein lipase (referred to as TGRL lipolysis product, TGRL (150 mg/dL) + LpL (2 U/mL)). The final concentration of TGRL lipolysis products were diluted in media and pre-incubated for 30 min at 37°C prior to application. In this manuscript, we denoted control media as M and TGRL lipolysis product as TL throughout the manuscript. After the incubation with media (M) or TGRL lipolysis products (TL), cells were washed with cold PBS and harvested by scraping them in ice-cold PBS.
To study the TL-induced signaling pathways, the following experiments were performed. For high-throughput sequencing and protein expression analysis, cells were treated with M or TL for 3 h, unless otherwise stated. After the incubation, cell culture supernatants were collected to measure secreted protein expression and the cells were washed with cold PBS and harvested based on experimental endpoints.
RNA sequencing analysis
RNA-Seq is commonly used to uncover quantitative temporal snapshots of the transcriptome and transcripts (splice variants). RNA-Seq sample preparation for Illumina sequencing included total mRNA isolation, bead-based ribosomal RNA (rRNA) depletion, and strand-specific library construction.
RNA isolation
Total RNA was extracted from HBMECs treated with M control or TL in 6-well plate (3 well per sample, N = 3/group) using RNeasy Plus Mini Kit (Qiagen, Valencia, CA) including the DNA digestion step as described by the manufacturer’s protocol. Sample quality was assessed using Nanodrop ND-1000 Spectrophotometer (Thermo Fisher Scientific, Wilmington, DE), Agilent Bioanalyzer 2100 (Agilent Technologies, Santa Clara, CA), and Qubit fluorometer (Life Technologies, Carlsbad, CA).
Library preparation, amplification, targeted capture, and Illumina-based sequencing
Total RNA samples were submitted to the DNA Technologies Core, UC Davis Genome Center for sequencing. RNA sample quality was confirmed using the Bioanalyzer 2100. All RNA samples had an RNA integrity number (RIN) score of ≈10.0. Three micrograms of total RNA each was subjected to ribo-depletion to remove ribosomal RNA (rRNA) using Ribo-Zero Gold Kits (Illumina, San Diego, CA). The RNA-Seq library preps were carried out using the KAPA Stranded RNA-Seq Library Preparation Kit (KK8400, Kapa Biosystems/Roche, Basel, Switzerland) following the manufacturer’s instructions. In short, after chemical RNA fragmentation, first-strand cDNA and second-strand cDNA generation, and A-tailing, indexed Illumina TruSeq “forked” adapters with 6bp barcodes are ligated to library insert fragments. The library fragments carrying adapter sequences at both ends were amplified using 10 cycles of high-fidelity, low-bias PCR. The size distributions of the resulting libraries were assessed using the Bioanalyzer 2100. The libraries were quantified with Qubit assay (Life Technologies) for pooling. The library pool was quantified by qPCR with a Kapa Library Quant kit (Kapa Biosystems-Roche) and sequenced on an Illumina HiSeq 3000 to generate 100 million paired-end reads per sample. The sequencing was carried out at the DNA Technologies and Expression Analysis Cores at the UC Davis Genome Center, supported by NIH Shared Instrumentation Grant 1S10OD010786–01.
RNA-Seq alignment and differential expression analysis
Raw read quality was evaluated with FastQC v0.11.2 [31]. Scythe v. 0.991 [32] and Sickle v. 1.33 [33] were used, respectively, to trim adapter artifacts and low quality reads. Trimmed reads were aligned to the hg19 genome using GENCODE v. 19 annotation (http://www.gencodegenes.org/releases/19.html) [34], with TopHat2 v. 2.1.0, running bowtie2 v. 2.2.6 [35]. Raw counts per gene were generated with htseq-count v. 0.6.1p2 [36]. Differential expression analysis was conducted using the limma-voom Bioconductor pipeline v. 3.24.15 [37], which transforms RNA-Seq/Tag-Seq count data then fits a linear model to each gene, followed by empirical Bayes shrinkage [38] for increased power and Benjamini-Hochberg adjustment of p-values [39].
Pathway analysis
Pathway annotations of the significantly differentially expressed genes were retrieved by Grinn software tool [40]. Grinn integrates biochemical pathway information from several public databases, such as KEGG [41], Reactome [42], and SMPDB [43]. The pathway enrichment analysis was conducted by using the R package Piano [44]. The median of adjusted p-values from the differential gene expression analysis was set as the enrichment score and the statistical significance of perturbed pathways was estimated by a permutation approach. In addition, fold changes from the comparison of two conditions were used to classify the direction of regulation that significantly affects the pathways as described [44]. The lists of TL-sensitive genes were then sorted to satisfy two requirements: (a) the gene was significantly differentially expressed with an adjusted p-value of ≤ 0.05; (b) the log2 fold change (Log2FC) was ± ≥ 1.3.
qRT-PCR validation of changes in mRNA expression by RNA-Seq data
qRT-PCR analyses were performed on individual aliquots of total RNA from each treatment replicate. The purpose of these analyses was to evaluate the reliability of RNA-Seq data and to develop statistical data to validate the changes suggested by the HTS assay of RNA samples. Based on our previous study the two assays may not match quantitatively but they always match qualitatively. The method of the two assays are different; the HTS assay quantifies discrete, digital sequencing read counts, offering an unlimited dynamic range, whereas the RT-PCR utilizes amplification of DNA fragments using specific primer sets designed by a different method.
An aliquot equivalent to 5 μg of total RNA extracted from each sample was reverse-transcribed to obtain cDNA in a final volume of 21 μL consisting of buffer, random hexamers, DTT, dNTPs, and SuperScript® III First-Strand Synthesis System (Invitrogen). qRT-PCR with SYBR as fluorescent reporter was used to quantify the expression of selected genes identified by RNA-Seq analysis. Specific human primers were designed with Primer Express 1.0 software (Applied Biosystems) using the gene sequences obtained from previously published Affymetrix Probeset IDs [12] and RNA-Seq sequences (Table 1). Reactions were carried out in 384-well optical plates containing 25 ng RNA in each well. The quantity of applied RNA was normalized by simultaneously amplifying cDNA samples with glyceraldehyde-3-phosphate dehydrogenase (GAPDH)-specific primers. Transcript levels were measured by RT-PCR using the ABI Vii7 Sequence detection system (PE Applied Biosystems, Foster City, CA). The PCR amplification parameters were: initial denaturation step at 95°C for 10 min followed by 40 cycles, each at 95°C for 15 s (melting) and 60°C for 1 min (annealing and extension). A comparative threshold cycle (Ct) method was used to calculate relative changes in gene transcription determined from real-time quantitative PCR experiments [Applied Biosystems user bulletin no. 2 (P/N4303859)] [45]. The Ct, which correlates inversely with the target mRNA levels, was measured as the cycle number at which the SYBR Green emission increases above a preset threshold level. The relative abundance of mRNA transcripts were expressed as fold changes in the transcription of the specific mRNAs in samples from the TL-treated cells compared with those from the control-treated cells. Analysis was done not only on the samples submitted for RNA-Seq analysis, but also on samples from additional biologically independent experimental replicates.
Table 1.
The oligonucleotide sequences for each primer sequence for mRNA and DNA used in qRT-PCR were obtained from Affymetrix data base using the probe set IDs.
| Gene | Primer sequence (5' – 3') |
|
|---|---|---|
| Sense | Antisense | |
| For mRNA | ||
| GAPDH | CACCAACTGCTTAG | TGGTCATGAGTCCT |
| ATF3 | TTCTCCCAGCGTTAACACAAAA | AGAGGACCTGCCATCATGCT |
| ATF3-I4 | GCAGAAACTCCCAAGGC | CCTGTGGCTCTGCTAATACT |
| ATF3-I5 | GTGAGTCCTCGGTGCTC | TGGCCTGGGTGTTGAAG |
| DDIT3 | AGAGTGGTCATTCCCCAGCC | CTTTCTCCTTCATGCGCTGC |
| DDIT4 | GCAGCTGCGTTTAAGCCTTC | TGCCAGCTCAACTCTGCAGT |
| CHAC1 | GGAGTCTCCAAGAGCCTCGA | CTATGGATGGCTGGGCTGA |
| JDP2 | TACGCTGACATCCGCAACCT | AACTCCGTGCGCTCCTTCTT |
| PTGS2/COX-2 | CTGAATGTGCCATAAGACTGACCT | TCCACAGATCCCTCAAAACATTT |
| CCL20 | TGGAATGGAATTGGACATAGCC | CAACCCCAGCAAGGTTCTTTC |
| CEBPB | TTTAAACATGGCTGAACGCG | ACACGTGGGTTGCGTCAGT |
| CXCL3 | TAGGGACAGCTGGAAAGGGA | ACCCTCGTAAGAAATAGTCAAACACAT |
| CSF2 | GGGCCCCTTGACCATGAT | GTTGGAGGGCAGTGCTGTTT |
| FOSL1 | GTGATGAGCTGATCTGCGGA | CCCTGGAGCTGAAGGCTTCT |
| FOSL2 | TCTGGCTTCTGAAGAGCCTGA | ACAAAGGGACAGGAATGGTCC |
| LIF | CCCTCCTTCCTTTCCACTGAA | GAGGAATTTGTCACCCAAGGC |
| ATF4 | GTGGCATCTGTATGAGCCCA | GGCTGTGCTGAGGAGACCC |
| E-Selectin | TGGCAATGAAAAATTCTCAGTCA | TCAAGGCTAGAGCAGCTTTGG |
| NFKB1 | GTCAGAGAGCTGGTGGAGGC | AATTGCTTCGGTGTAGCCCA |
| NFKBIA | CTTTTGGTGTCCTTGGGTGC | GCCATTACAGGGCTCCTGAG |
| JunB | AATGGAACAGCCCTTCTTACCACGA | GGCTCGGTTTCAGGAGTTTGTAGT |
| JUN | GTGCGATGTTTCAGGAGGCT | TGTCCCTCTCCACTGCAACC |
| EIF2AK3 | CATTTTTGTCCCTGGCGG | TGTCCTCCAAAATAGTGCAGATTC |
| HIF1α | ACCTAAATGTTCTGCCTACCCTGT | CAGTCTGCTCAAAATATCTTTATACCAAC |
| NRF2 | AGTGAATACTCCCTGCAGCAAAC | GGGAACAAGGAAAACATTGCC |
| CAT | CCGTGTAACCCGCTCATCAC | TGCACATCTAGCACAGGAGAAT CT |
| NQO1 | GCT GACT GGCACT GGTGGTT | ACCCAGCCGTCAGCTATTGT |
| SOD-2 | GGGAATACCCCAGTTGTGAAAG | TGGTGTCAGATGTTGCCTTACAG |
| HOX-1 | TCTTCCCCAACGAAAAGCAC | CCCCCTCTGAAGTTTAGGCC |
| IL-8 | CCTTTCCACCCCAAATTTAT CA | TGGTCCACTCTCAATCACTCTCAG |
| IL-6 | CACCGGGAACGAAAGAGAAG | TCATAGCTGGGCTCCTGGAG |
| IL-1α | GTTTTATCATTTTCAAAATGGAGGG | TGCGGCAGGAAGGCTTAG |
| VEGFA | GGGCCCCTTGACCATGAT | CTTTCAAAGGAATGTGTGCTGG |
| ICAM-1 | CAGAAGAAGTGGCCCTCCATAG | GGGCCTTTGTGTTTGATGCTA |
| HSPA6 | GTGAGAGGGCCATGACCAAG | TGAGTTCAAAACGCCCCAG |
| GADD45A | GGCCCGGAGATAGATGACTTT | CCTTCTTCATTTTCACCTCTTTCC |
| CXCL-2 | GAGAGACACAGCTGCAGAGGC | Antisense-TGCTCAAACACATTAGGCGC |
| ADAM2 | TGAAAGGCGCTACATTGAGAAC | GGCCATCTCATTGGTTTGGA |
| KLF4 | ACTGGAAGTTGTGGATATCAGGG | CTCCCCCAACTCACGGATATAA |
| CPT1A1 | AAGGCCTTGGAGGAGACCAT | TCCAGCCCAGCACATGAAC |
| For DNA | ||
| B2M | TGCTGTCTCCATGTTTGATGTATCT | TCTCTGCTCCCCACCTCTAAGT |
| ND-1 | CCCTTCGCTGACGCCATA | TGGTAGATGTGGCGGGTTTT |
| CO1 | TGATCTGCTGCAGTGCTCTGA | TCAGGCCACCTACGGTGAA |
| Cyb | AACCGCCTTTTCATCAATCG | AGCGGATGATTCAGCCATAATT |
The primers were custom prepared and used as described in the Methods.
siRNA experiments
Cells were cultured in 6-well plates. For ATF3 and CPT1A1 silencing, cells were pre-transfected for 18 h with 5 nM ATF3-T4 siRNA, ATF3-T5 siRNA, or negative control (scrambled) siRNA, and for 48 h with 5 nM CPT1A1 D1-D3 siRNA or negative control (scrambled) siRNA in media without serum using HiPerfect reagent (Qiagen) according to the manufacturer’s protocol. siRNA transfected cells were exposed to M or TL for 3 h. After treatment, mRNA expression was measured by qRT-PCR, protein expression was quantified by western blots, and secreted proteins in supernatant were measured by ELISA.
Cytokine/chemokine secretion analysis
Culture medium from the HBMECs treated with either M, lipoprotein lipase (L), TGRL (T), or TL for 3 h was collected and stored at −80°C until usage. Supernatant samples were assayed for cytokine/chemokine secretion using enzyme-linked immunosorbent assay (ELISA) kits for human IL-6, IL-8, IL-1β, TNF (BD Bioscience, San Diego, CA), macrophage inflammatory protein (MIP)-1α, MIP-3α, and monocyte chemoattractant protein 1 (MCP-1, also known as CCL-2) (R&D Systems, Minneapolis, MN) according to the manufacturer’s protocol. Colorimetric analysis was completed using a Bio-Rad xMark plate reader and concentrations were calculated following the manufacturers’ instructions. Supernatant of ATF3-T4 and ATF3-T5 siRNA treated group were also analyzed as above.
Western blotting
Cell pellets were lysed in radioimmune precipitation assay (RIPA) buffer containing 50 mM Tris (pH 7.4), 150 mM NaCl, 1% NP40, 0.25% sodium deoxycholate, 0.1% SDS, 1× Protease inhibitor cocktail set 1 (Calbiochem, La Jolla, CA), 1 mM NaF, and 1 mM Na3VO4. Protein concentration was determined with the bicinchoninic acid assay (Pierce), and equal amounts of proteins (60 μg) were separated by NuPAGE® Novex® 4–12% Bis-Tris protein gels using NuPAGE® MES SDS Running Buffer (Life Technologies, Grand Island, NY). Proteins then were transferred onto 0.2 μm polyvinylidenedifluoride membranes (Bio-Rad, Hercules, CA), which were subsequently blocked with 5% nonfat milk for 1 h and probed with ATF3 (1:200 dilution), c-Jun (1:200 dilution), COX-2 (1:200), CHAC1 (1:200), JDP2 (1;200), p53 (1:200), p-c-Jun (1:1000), ATF4 (1:1000), cleaved caspase-9 (1:1000), JunB (1:1000), DR5 (1:1000), TNFR1 (1:1000), NRF2 (1:1000), eIF2α (1:1000), PARP (1:1000), and pro and active caspase-3 (3 ug/mL) or blotting control mouse monoclonal anti-β-actin (1:5000) at 4°C overnight. Membranes were then incubated with horseradish peroxidase (HRP)-conjugated secondary anti-rabbit or anti-mouse antibody (1:5–10,000). Blots were developed with the enhanced chemiluminescence detection system according to the manufacturer’s instructions (Amersham). Protein expression levels were determined using a densitometer and Image Quant.
Measurement of cellular mitochondrial respiration and glycolytic rate
Cells numbers were counted with a hemocytometer and 0.5×10⁴ cells/well were seeded in 6-wells of a XFp Cell Culture 8-well chamber miniplate (Seahorse Biosciences) until confluence. Experiments were performed in triplicate with N = 6 wells/treatments group. Oxygen consumption rates (OCR) and extracellular acidification rates (ECAR) were measured according to Seahorse XFp Cell Mito Stress Test Kit and Glycolytic Rate Assay Kit protocols recommended by Seahorse Biosciences. Briefly, cells were equilibrated in XF base medium without phenol red containing 10 mM glucose, 2 mM L-glutamine, and 1 mM sodium pyruvate. For the Mito Stress test, (1) media control or TL were injected to cell seeded in a XFp cell culture chamber through ports A-D and incubated for 30 min at first, followed by injecting (2) oligomycin, (3) FCCP, and (4) mixture of antimycin A and rotenone, performed as manufacture’s protocol to measure mitochondrial basal respiration, ATP-linked respiration, H+ (Proton) leak, maximal respiration, spare respiratory capacity, and non-mitochondrial respiration [46].
For the glycolytic rate assay, 5 mM Hepes buffer was added to the above medium according to Glycolytic Rate Assay Kit protocols recommended by Seahorse Biosciences. Baseline OCR and ECAR were recorded, and TL were injected while continuously measuring oxygen and H+ with the Agilent Seahorse XFp Analyzer. Data presented are normalized to total cell number per well.
Mitochondrial DNA determination
After HBMECs were treated with M or TL, and cells were washed with 1X cold PBS. DNA was extracted using QIAamp DNA Blood Mini Kit (Qiagen, Valencia, CA) according to the manufacturer’s protocol. Sample quality was assessed using Nanodrop ND-1000 Spectrophotometer (Thermo Fisher Scientific, Wilmington, DE). For mtDNA copy number measurement, we used the procedure as previously described [47,48] with DNA isolated from each treatment group (N = 3/group). Mitochondrial DNA (mtDNA) copy number was calculated by measuring the amount of mtDNA relative to the amount of nuclear DNA (nDNA). To do so, mitochondrial encoded genes, NADH dehydrogenase 1 (ND1), cytochrome c oxidase I (CO1), cytochrome b (Cyb), and the nuclear β2-microglobulin (B2M) gene, of HBMECs were amplified using qRT-PCR (SYBR green). Fluorescence signal was detected using an Applied Biosystems Vii7 Sequence Detection System (Applied Biosystems). These primer sequences were designed with Primer Express 1.0 software (Applied Biosystems) using the gene sequences obtained from previously published Affymetrix Probeset IDs (Table 1) and relative quantification for mtDNA copy number was performed. The ratio of mtDNA copy number to the amount of nDNA (mtDNA: nDNA) was determined for each sample with standard curves made by serial dilution (1:5) of a reference DNA sample. The PCR amplification parameters were: initial denaturation step at 95°C for 10 min followed by 40 cycles, each at 95°C for 15 s (melting) and 60°C for 1 min (annealing and extension). A comparative threshold cycle (Ct) method was used to calculate relative changes in DNA copy number with fold change determined from real-time quantitative PCR experiments.
Electron Paramagnetic Resonance (EPR) Spin Trapping of Superoxide Radical (O2.−)
To detect O2.− generation in HBMECs, measurements of supernatant O2.− levels were performed on cells treated with media and TL for 15 min. Cells were pretreated with scrambled control siRNA or CPT1A1 D1 siRNA for 48 h. Each treatment condition contained 0.5 mM 1-hydroxy-3-carboxy-2,2,5,5-tetramethylpyrrolidine (CP-H) spin trap as previously described [15,49]. Spin traps are capable of rapidly trapping free radicals such as O2.− to form more persistent radicals (spin adducts) detectable by EPR. Conversion of the diamagnetic hydroxy-amine CP-H to the paramagnetic nitroxide was measured using a JEOL JES TE-100 EPR spectrometer. All spectra were obtained at room temperature by averaging two 2-min scans with a sweep width of 100 G at a microwave power of 3 mW and modulation amplitude optimized to the natural line width of the spin probe.
Lipid droplets staining
To visualize the lipid droplets in HBMECs, cells were grown to confluence on attachment factor-coated 12-mm round coverslips placed in 24-well medical-grade polystyrene plates (BD Falcon) and were treated (N = 4 coverslips/treatment group) as described above. After treated, cells were fixed with 4% paraformaldehyde in PBS for 10 min at room temperature and then washed 3 times with 1X PBS. Lipid droplets were stained with Oil Red O or Nile Red. For Oil Red O staining, cells were quickly rinsed with 60% iso-propanol to equilibrate and incubated with Oil red O solution for 5 min. Final concentration of Oil Red O is 10 ug/mL. Subsequently, cells were washed with 60% iso-propanol to remove excess Oil red O stain and followed by distilled water.
For Nile Red staining, cells were permeabilized with 0.1% TritonX-100 for 5 min and incubated with 100 ng/mL final concentration of Nile Red for 1 h. The nucleus was counterstained with 4’, 6-diamidino-2-phenylindole (DAPI) (1 μg/mL) in both Oil Red O- and Nile Red-stained cells for 5 min. Cells were then mounted on slides with ProLong Gold antifade reagent (Life Technologies, Carlsbad, CA) and visualized by DeltaVision Ultra High Resolution Microscope (GE Healthcare, Pittsburgh, PA).
Total intracellular lipid content analysis
Cell pellets were lysed in radioimmune precipitation assay (RIPA) buffer and protein concentration was determined with the bicinchoninic acid assay (Pierce) as the above western blot analysis. Total triglycerides were quantified using a colorimetric triglyceride quantification assay (Sigma) (n = 15 samples/treatment group). Triglyceride content was determined relative to protein content.
Statistical Analysis
Data for changes in gene expression obtained by qRT-PCR and protein expression were analyzed by GraphPad PRISM 5.0 software (San Diego, CA). An unpaired student’s t test or two-way analysis of variance with repeated measures was used for comparisons between the treatments. Differences with P ≤0.05 were considered significant. Results are expressed as MEAN ± SEM.
RESULTS
RNA-Seq quality and alignment
We used high-throughput sequencing technologies (HTS) to determine genome wide response of HBMECs to TL. The HTS assay quantifies unbiasedly discrete, digital sequencing read counts, offering an unlimited dynamic range. We performed RNA-Seq using 3 replicate samples each of HBMECs treated with media control or TL. Total paired-end reads sequenced from the 6 samples are shown in Table 2.
Table 2.
Summary of reads mapping to the human genome (UCSC hg19) using TopHat2 v. 2.1.0.
| M (control) |
TL |
|||||||
|---|---|---|---|---|---|---|---|---|
| 1 | 2 | 3 | Ave | 1 | 2 | 3 | Ave | |
| Total Reads | 113,733,751 | 110,926,790 | 118,864,109 | 114,508,217 | 117,731,460 | 114,367,336 | 114,905,739 | 115,668,178 |
| % Mapped | 82.80% | 84.00% | 71.70% | 79.5% | 83.90% | 84.60% | 83.00% | 83.83% |
Differential gene expression
Differential gene expression was determined by mapping with TopHat2, counting aligned reads per genes with HTSeq-count, and analyzing the differential expression with limma-voom. Comparisons were made between the TL treated HBMECs and the media control treated cells. 619 genes were significantly differentially expressed (FDR < 0.05) by treatment with TL. We performed pathway enrichment analysis on the 619 significantly differentially expressed genes between treated and control samples. After applying a threshold of (Log2FC ≥ ± 1.3) at the mRNA transcript level, 69 of the significantly differentially expressed genes were up-regulated and 31 genes were down-regulated (Table 3). Specific up-regulated and down-regulated genes sensitive to TL treatment are listed in Table 5 and Table 6, respectively. Using the Grinn R package, we identified 108 signaling pathways of which 47 signaling pathway were significantly activated with P≤0.05 (Table 4). The MAPK signaling pathway is the most statistically significant with P value ≈ 0. The second most significant biological pathway is tumor necrosis factor (TNF) signaling.
Table 3.
Summary of differential gene expression analysis using RNA-Seq.
| Transcripts with Log2FC | Up-regulated Transcript | Down-regulated Transcript | |
|---|---|---|---|
| M (control) vs TL | 100 | 69 | 31 |
All data are based on reliably reads in the HBMECs.
The criterion for selection was Log2FC ≥ ± 1.3-fold change with P≤0.05 as detailed in the methods.
Effects of TGRL + LpL (TL) on gene expression in HBMECs were obtained by comparing the entire list of genes with control Media (M) alone.
Table 5.
Up-regulated gene expression by TGRL lipolysis products
| Gen ID | Gene Symbol | Gene Name | Log2FC | P.Value |
|---|---|---|---|---|
| ENSG00000128965 | CHAC1 | ChaC glutathione specific gamma-glutamylcyclotransferase 1 | 5.3856 | 1.07E-08 |
| ENSG00000128165 | ADM2 | adrenomedullin 2 | 4.3860 | 1.11E-06 |
| ENSG00000168209 | DDIT4 | DNA damage inducible transcript 4 | 4.1767 | 2.78E-08 |
| ENSG00000162772 | ATF3 | activating transcription factor 3 | 3.9141 | 1.03E-07 |
| ENSG00000269926 | RP11–442H21.2 | 3.6496 | 2.48E-06 | |
| ENSG00000175197 | DDIT3 | DNA damage inducible transcript 3 | 3.5799 | 3.52E-08 |
| ENSG00000130766 | SESN2 | sestrin 2 | 3.1353 | 1.25E-08 |
| ENSG00000205710 | C17orf107 | chromosome 17 open reading frame 107 | 2.9942 | 3.79E-05 |
| ENSG00000140044 | JDP2 | Jun dimerization protein 2 | 2.8726 | 1.08E-06 |
| ENSG00000116285 | ERRFI1 | ERBB receptor feedback inhibitor 1 | 2.7646 | 1.74E-08 |
| ENSG00000163545 | NUAK2 | NUAK family kinase 2 | 2.7459 | 0.0004 |
| ENSG00000153714 | LURAP1L | leucine rich adaptor protein 1 like | 2.6904 | 1.19E-06 |
| ENSG00000208028 | MIR616 | microRNA 616(MIR616) | 2.6523 | 4.12E-05 |
| ENSG00000136826 | KLF4 | Kruppel like factor 4 | 2.6502 | 2.38E-07 |
| ENSG00000176907 | C8orf4 | chromosome 8 open reading frame 4 | 2.6173 | 3.69E-06 |
| ENSG00000023171 | GRAMD1B | GRAM domain containing 1B | 2.4635 | 1.62E-07 |
| ENSG00000073756 | PTGS2 | prostaglandin-endoperoxide synthase 2 | 2.3668 | 2.82E-05 |
| ENSG00000115009 | CCL20 | C-C motif chemokine ligand 20 | 2.3522 | 1.98E-05 |
| ENSG00000173110 | HSPA6 | heat shock protein family A (Hsp70) member 6 | 2.3395 | 0.0008 |
| ENSG00000145777 | TSLP | thymic stromal lymphopoietin | 2.2644 | 0.0003 |
| ENSG00000172216 | CEBPB | CCAAT/enhancer binding protein beta | 2.2451 | 3.67E-07 |
| ENSG00000264175 | MIR3189 | microRNA 3189 | 2.2197 | 2.88E-05 |
| ENSG00000273129 | RP5–973M2.2 | PTGS2 antisense NFKB1 complex-mediated expression regulator RNA | 2.1876 | 6.82E-06 |
| ENSG00000261114 | RP11–325K4.2 | - | 2.1836 | 2.57E-05 |
| ENSG00000183395 | PMCH | pro-melanin concentrating hormone | 2.1698 | 3.34E-05 |
| ENSG00000163734 | CXCL3 | C-X-C motif chemokine ligand 3 | 2.1636 | 7.57E-07 |
| ENSG00000141682 | PMAIP1 | phorbol-12-myristate-13-acetate-induced protein 1 | 2.0567 | 5.03E-06 |
| ENSG00000115008 | IL1A | interleukin 1 alpha | 1.9900 | 2.34E-06 |
| ENSG00000171174 | RBKS | ribokinase | 1.9534 | 1.97E-05 |
| ENSG00000156804 | FBXO32 | F-box protein 32 | 1.9332 | 3.82E-05 |
| ENSG00000261270 | RP11–325K4.3 | - | 1.9329 | 0.000111 |
| ENSG00000164949 | GEM | GTP binding protein overexpressed in skeletal muscle | 1.8611 | 3.20E-06 |
| ENSG00000253616 | RP11–875O11.3 | - | 1.8093 | 0.000972 |
| ENSG00000233058 | LINC00884 | - | 1.7781 | 4.52E-05 |
| ENSG00000235513 | RP4–756G23.5 | - | 1.7669 | 5.83E-05 |
| ENSG00000152292 | SH2D6 | SH2 domain containing 6 | 1.7655 | 3.45E-05 |
| ENSG00000112715 | VEGFA | vascular endothelial growth factor A | 1.7612 | 1.25E-07 |
| ENSG00000023445 | BIRC3 | baculoviral IAP repeat containing 3 | 1.7381 | 3.59E-06 |
| ENSG00000087074 | PPP1R15A | protein phosphatase 1 regulatory subunit 15A | 1.7211 | 8.76E-07 |
| ENSG00000113739 | STC2 | stanniocalcin 2 | 1.7067 | 4.54E-07 |
| ENSG00000272574 | RP11–359K18.4 | - | 1.6995 | 0.000187 |
| ENSG00000227941 | UQCRBP2 | ubiquinol-cytochrome c reductase binding protein pseudogene 2 | 1.6760 | 0.001467 |
| ENSG00000260727 | SLC7A5P1 | solute carrier family 7 member 5 pseudogene 1 | 1.6751 | 2.16E-05 |
| ENSG00000169429 | IL8 | C-X-C motif chemokine ligand 8 | 1.6689 | 6.26E-06 |
| ENSG00000116717 | GADD45A | growth arrest and DNA damage inducible alpha | 1.6261 | 1.87E-06 |
| ENSG00000120337 | TNFSF18 | tumor necrosis factor superfamily member 18 | 1.5878 | 1.60E-07 |
| ENSG00000165030 | NFIL3 | nuclear factor, interleukin 3 regulated | 1.5755 | 0.000196 |
| ENSG00000184545 | DUSP8 | dual specificity phosphatase 8 | 1.5692 | 0.000296 |
| ENSG00000120129 | DUSP1 | dual specificity phosphatase 1 | 1.5538 | 1.78E-07 |
| ENSG00000167772 | ANGPTL4 | angiopoietin like 4 | 1.5506 | 4.72E-06 |
| ENSG00000128272 | ATF4 | activating transcription factor 4 | 1.5403 | 4.92E-05 |
| ENSG00000170689 | HOXB9 | homeobox B9 | 1.5178 | 0.000614 |
| ENSG00000081041 | CXCL2 | C-X-C motif chemokine ligand 2 | 1.5165 | 1.09E-05 |
| ENSG00000204389 | HSPA1A | heat shock protein family A (Hsp70) member 1A | 1.5132 | 1.35E-05 |
| ENSG00000101255 | TRIB3 | tribbles pseudokinase 3 | 1.5065 | 3.10E-06 |
| ENSG00000051108 | HERPUD1 | homocysteine inducible ER protein with ubiquitin like domain 1 | 1.4848 | 8.35E-05 |
| ENSG00000269375 | AL117190.3 | - | 1.4691 | 0.000794 |
| ENSG00000123358 | NR4A1 | nuclear receptor subfamily 4 group A member 1 | 1.4689 | 2.79E-05 |
| ENSG00000205502 | C2CD4B | C2 calcium dependent domain containing 4B | 1.4605 | 0.000201 |
| ENSG00000168386 | FILIP1L | filamin A interacting protein 1 like | 1.4564 | 7.01E-06 |
| ENSG00000113070 | HBEGF | heparin binding EGF like growth factor | 1.4416 | 1.09E-06 |
| ENSG00000103257 | SLC7A5 | solute carrier family 7 member 5 | 1.3668 | 4.69E-07 |
| ENSG00000236252 | RP11–15J10.8 | uncharacterized LOC101928381(LOC101928381) | 1.3573 | 0.000430 |
| ENSG00000136630 | HLX | H2.0 like homeobox(HLX) | 1.3473 | 4.77E-05 |
| ENSG00000227558 | PGM5P2 | phosphoglucomutase 5 pseudogene 2 | 1.3450 | 0.000160 |
| ENSG00000237021 | RP3–486I3.7 | dermatan sulfate epimerase | 1.3363 | 0.001871 |
| ENSG00000180535 | BHLHA15 | basic helix-loop-helix family member a15 | 1.3344 | 0.001080 |
| ENSG00000171223 | JUNB | JunB proto-oncogene, AP-1 transcription factor subunit | 1.3123 | 1.63E-05 |
| ENSG00000128590 | DNAJB9 | DnaJ heat shock protein family (Hsp40) member B9 | 1.3077 | 1.54E-05 |
Table 6.
Down-regulated gene expression by TGRL lipolysis
| Gen ID | Gene Symbol | Gene Name | logFC | P.Value |
|---|---|---|---|---|
| ENSG00000181690 | PLAG1 | PLAG1 zinc finger | −1.3047 | 5.12E-05 |
| ENSG00000125347 | IRF1 | interferon regulatory factor 1 | −1.3092 | 5.21E-05 |
| ENSG00000228672 | PROB1 | proline rich basic protein 1 | −1.3192 | 7.43E-05 |
| ENSG00000213203 | GIMAP1 | GTPase, IMAP family member 1 | −1.3249 | 8.78E-05 |
| ENSG00000170577 | SIX2 | SIX homeobox 2 | −1.3642 | 0.0002 |
| ENSG00000264063 | MIR3687 | microRNA 3687–2 | −1.3675 | 0.0003 |
| ENSG00000133561 | GIMAP6 | GTPase, IMAP family member 6 | −1.3778 | 7.31E-06 |
| ENSG00000129173 | E2F8 | E2F transcription factor 8 | −1.3893 | 0.0019 |
| ENSG00000141570 | CBX8 | chromobox 8 | −1.4247 | 2.11E-05 |
| ENSG00000124019 | FAM124B | family with sequence similarity 124 member B | −1.4252 | 4.66E-05 |
| ENSG00000180855 | ZNF443 | zinc finger protein 443 | −1.4367 | 0.0003 |
| ENSG00000074966 | TXK | TXK tyrosine kinase | −1.4599 | 0.0019 |
| ENSG00000171115 | GIMAP8 | GTPase, IMAP family member 8 | −1.4698 | 1.26E-05 |
| ENSG00000196227 | FAM217B | family with sequence similarity 217 member B | −1.4785 | 0.0001 |
| ENSG00000238297 | U3 | - | −1.5352 | 0.0011 |
| ENSG00000256006 | AC084117.3 | - | −1.6689 | 0.0015 |
| ENSG00000197245 | FAM110D | family with sequence similarity 110 member D | −1.6812 | 5.85E-05 |
| ENSG00000179144 | GIMAP7 | GTPase, IMAP family member 7 | −1.7241 | 1.48E-05 |
| ENSG00000168062 | BATF2 | basic leucine zipper ATF-like transcription factor 2(BATF2) | −1.7752 | 0.0005 |
| ENSG00000140450 | ARRDC4 | arrestin domain containing 4 | −1.8494 | 0.0008 |
| ENSG00000062282 | DGAT2 | diacylglycerol O-acyltransferase 2 | −1.8906 | 2.99E-06 |
| ENSG00000124479 | NDP | NDP, norrin cystine knot growth factor | −1.9734 | 2.33E-05 |
| ENSG00000180884 | ZNF792 | zinc finger protein 792 | −2.0420 | 1.02E-05 |
| ENSG00000105991 | HOXA1 | homeobox A1 | −2.0843 | 9.50E-06 |
| ENSG00000215146 | RP11–313J2.1 | zinc finger protein 91 pseudogene | −2.0922 | 0.0004 |
| ENSG00000180592 | SKIDA1 | SKI/DACH domain containing 1 | −2.2789 | 0.0006 |
| ENSG00000168646 | AXIN2 | axin 2(AXIN2) | −2.4330 | 0.0014 |
| ENSG00000166292 | TMEM100 | transmembrane protein 100 | −2.7242 | 0.0002 |
| ENSG00000117289 | TXNIP | thioredoxin interacting protein | −2.9230 | 7.30E-09 |
| ENSG00000007944 | MYLIP | myosin regulatory light chain interacting protein | −2.9767 | 4.83E-06 |
| ENSG00000210195 | MT-TT | mitochondrially encoded tRNA threonine | −4.0408 | 0.0001 |
Table 4.
47 signaling pathways were significantly activated by TGRL lipolysis products.
| ID | Pathway Name | Total | P value | Up-Regulated | Down-Regulated |
|---|---|---|---|---|---|
| hsa04010 | MAPK signaling pathway | 24 | 0 | 20 | 4 |
| hsa04668 | TNF signaling pathway | 20 | 0 | 16 | 4 |
| hsa05164 | Influenza A | 16 | 0 | 10 | 6 |
| hsa05132 | Salmonella infection | 8 | 2.00E-04 | 6 | 2 |
| hsa05134 | Legionellosis | 9 | 3.00E-04 | 8 | 1 |
| hsa04932 | Non-alcoholic fatty liver disease (NAFLD) | 10 | 8.00E-04 | 8 | 2 |
| hsa04141 | Protein processing in endoplasmic reticulum | 12 | 0.001 | 9 | 3 |
| hsa05162 | Measles | 10 | 0.0011 | 8 | 2 |
| REACT_18355 | ATF4 activates genes | 5 | 0.0014 | 5 | 0 |
| hsa04062 | Chemokine signaling pathway | 6 | 0.0015 | 5 | 1 |
| hsa04621 | NOD-like receptor signaling pathway | 7 | 0.0015 | 4 | 3 |
| hsa04510 | Focal adhesion | 4 | 0.0024 | 3 | 1 |
| hsa05140 | Leishmaniasis | 9 | 0.0029 | 7 | 2 |
| hsa04014 | Ras signaling pathway | 3 | 0.0035 | 2 | 1 |
| hsa04380 | Osteoclast differentiation | 12 | 0.0037 | 9 | 3 |
| hsa04060 | Cytokine-cytokine receptor interaction | 18 | 0.0041 | 13 | 5 |
| REACT_169168 | Senescence-Associated Secretory Phenotype (SASP) | 3 | 0.0041 | 3 | 0 |
| hsa05120 | Epithelial cell signaling in Helicobacter pylori infection | 5 | 0.0044 | 4 | 1 |
| hsa05166 | HTLV-I infection | 12 | 0.0047 | 11 | 1 |
| hsa05323 | Rheumatoid arthritis | 10 | 0.0047 | 8 | 2 |
| hsa04915 | Estrogen signaling pathway | 7 | 0.0052 | 7 | 0 |
| hsa04115 | p53 signaling pathway | 8 | 0.0059 | 7 | 1 |
| hsa05152 | Tuberculosis | 10 | 0.0062 | 6 | 4 |
| hsa05145 | Toxoplasmosis | 10 | 0.0062 | 7 | 3 |
| hsa04722 | Neurotrophin signaling pathway | 5 | 0.0068 | 4 | 1 |
| REACT_27161 | Transcriptional regulation of white adipocyte differentiation | 3 | 0.0081 | 2 | 1 |
| hsa04068 | FoxO signaling pathway | 10 | 0.0088 | 7 | 3 |
| hsa04912 | GnRH signaling pathway | 4 | 0.0091 | 3 | 1 |
| hsa05142 | Chagas disease (American trypanosomiasis) | 8 | 0.0102 | 6 | 2 |
| REACT_264487 | Regulation of HSF1-mediated heat shock response | 4 | 0.0115 | 4 | 0 |
| REACT_264075 | Attenuation phase | 4 | 0.0115 | 4 | 0 |
| REACT_264164 | HSF1-dependent transactivation | 4 | 0.0115 | 4 | 0 |
| REACT_264071 | HSF1 activation | 4 | 0.0115 | 4 | 0 |
| hsa05131 | Shigellosis | 3 | 0.0178 | 2 | 1 |
| hsa05321 | Inflammatory bowel disease (IBD) | 5 | 0.0183 | 4 | 1 |
| hsa05211 | Renal cell carcinoma | 3 | 0.0228 | 3 | 0 |
| hsa05231 | Choline metabolism in cancer | 3 | 0.0228 | 3 | 0 |
| hsa05030 | Cocaine addiction | 3 | 0.0228 | 3 | 0 |
| hsa04662 | B cell receptor signaling pathway | 3 | 0.0228 | 3 | 0 |
| hsa04024 | cAMP signaling pathway | 8 | 0.0249 | 7 | 1 |
| hsa05146 | Amoebiasis | 4 | 0.0315 | 3 | 1 |
| hsa04370 | VEGF signaling pathway | 3 | 0.0327 | 2 | 1 |
| hsa05034 | Alcoholism | 4 | 0.0337 | 3 | 1 |
| hsa04064 | NF-kappa B signaling pathway | 13 | 0.0388 | 9 | 4 |
| hsa04612 | Antigen processing and presentation | 3 | 0.0414 | 3 | 0 |
| hsa04660 | T cell receptor signaling pathway | 4 | 0.0453 | 3 | 1 |
| hsa05031 | Amphetamine addiction | 3 | 0.0493 | 3 | 0 |
The signaling pathways were analyzed based on TGRL + LpL (TL, lipolysis) sensitive genes, 619 significantly expressed genes. The total differentially expressed TGRL + LpL (lipolysis) sensitive genes (column 3) in each pathway, up-regulated (column 5), and down-regulated (column 6) are shown above. The criterion for selection was P value ≤0.05 as significant.
Effects of TGRL Lipolysis products on HBMECs gene expression
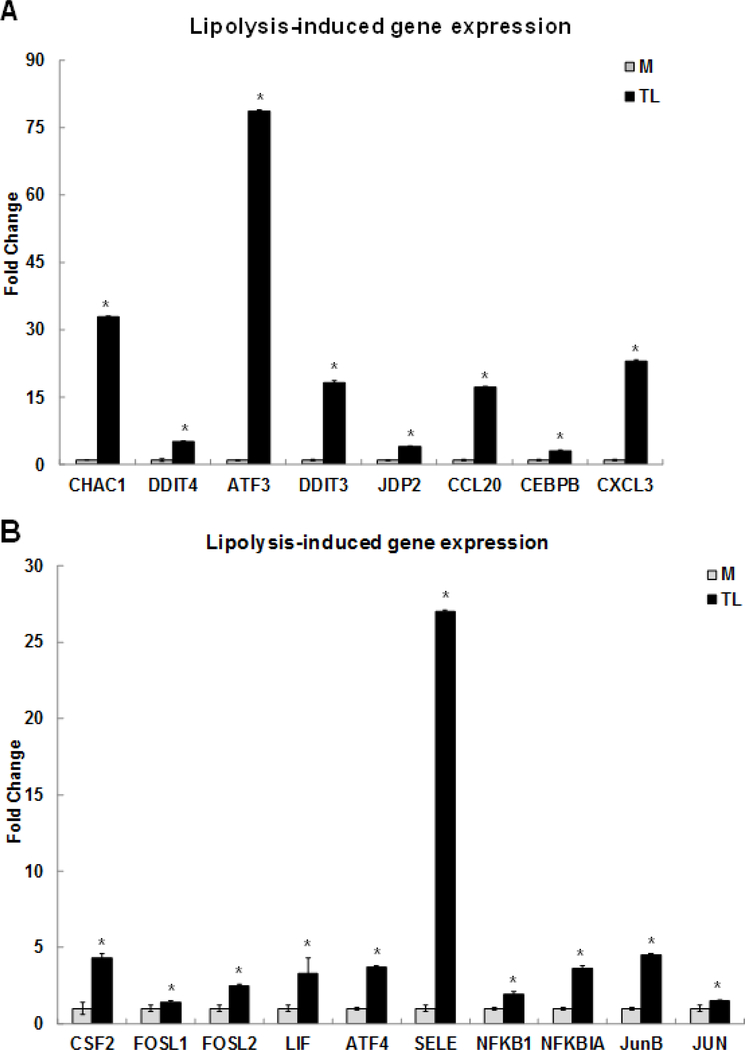
We selected nine differentially expressed genes, present in the MAPK, TNF, and NRF2 signaling pathways, for confirmation by qRT-PCR (Fig 1A). The selected genes induced by TGRL lipolysis products (TL) were glutathione-specific gamma-glutamylcyclotransferase 1 (CHAC1) (32.9-fold), DDIT4 (5.2-fold), ATF3 (78.7-fold), DDIT3 (18.3-fold), Jun dimerization protein 2 (JDP2) (4.1-fold), CCL-20 (17.3-fold), CEBPB (3.1-fold), and CXCL-3 (23.1-fold), respectively. Among these genes, we are first to report the up-regulation of CHAC1 and JDP2 induced by TL. CHAC1 may have an important role in the oxidative balance of the cell because CHAC1 degrades glutathione, the major intracellular antioxidant [50]. CHAC1 has been shown to link stress signaling and oxidative stress of the cell and apoptosis with implications for multiple diseases [51]. JDP2, a member of the AP-1 transcriptional regulator, is known to regulate a subset of genes in umbilical vein endothelial cells by preeclamptic plasma [52], and that regulates the epigenetic status of histones [53]. JDP2 is reported to be expressed in all cell types and tissues and plays a positive role in cell cycle control. ATF3 binds to JDP2 and directs its phosphorylation by JNK [54].
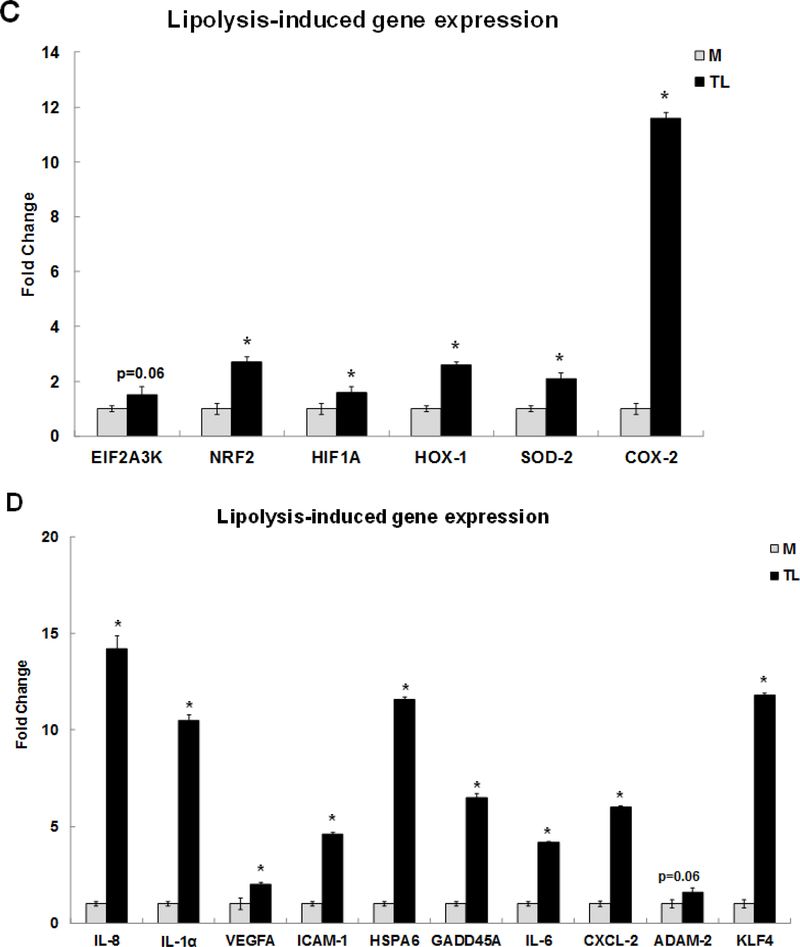
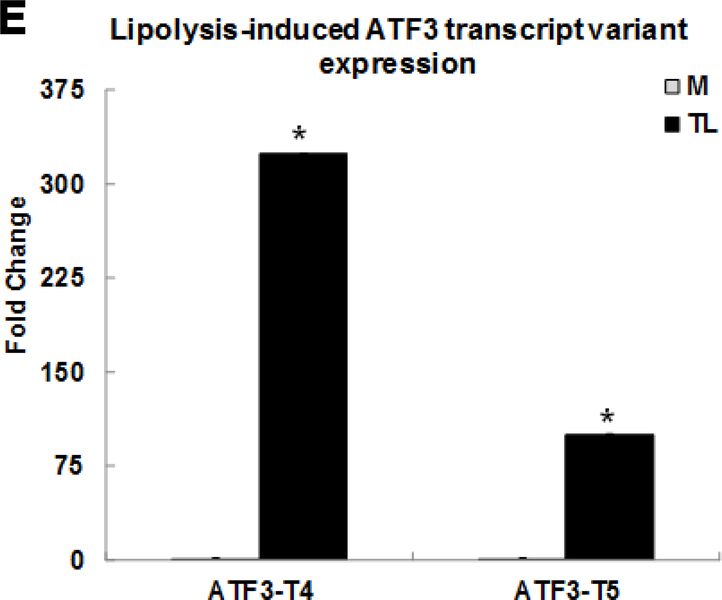
Figure 1. Confirmation of up-regulated gene expression by Triglyceride-rich lipoprotein (TGRL) lipolysis products with qRT-PCR.
Human brain microvascular endothelial cells (HBMECs) were treated with media control (M) or TGRL lipolysis products (TL= TGRL, 150 mg/dL + lipoprotein lipase, 2 U/mL) for 3 h. Expression of each gene was normalized to that of glyceraldehyde 3-phosphate dehydrogenase (GAPDH) by qRT-PCR and fold change was calculated as the ratio of TL to media control. A) Lipolysis-induced top selected differential gene expression; B) TNF signaling-related gene expression; C) NRF2 signaling-related gene expression; D) Pro-inflammatory response gene expression; E) ATF3 transcript variant 4 and 5 gene expression. N = 3/treatment group and results expressed as means ± SEM, *P≤ 0.05 compared to Media control.
TNF signaling is the second most significant pathway induced by the TL. The TNF signaling pathway related genes were confirmed by qRT-PCR (Fig 1B). These genes were colony stimulating factor 2 (CSF2) (4.3-fold), FOS like 1 (FOSL1) (1.4-fold), FOSL2 (2.5-fold), interleukin 6 family cytokine (LIF) (3.3-fold), ATF4 (3.7-fold), SELE/E-Selectin (27-fold), NFKB1/NFκB (p50) (1.9-fold), NFKBIA/IκBA (3.6-fold), JUNB (4.5-fold), and JUN (1.5-fold), respectively. Furthermore, TL induced genes involved in nuclear factor erythroid-derived 2-related factor 2 (NRF2) signaling pathway including EIF2A3K (1.5-fold), NRF2 (2.7-fold), hypoxia inducible factor 1 subunit alpha (HIF1A) (1.6-fold), HOX-1 (2.6-fold), SOD-2 (2.1-fold), and PTGS2 also known as COX-2 (11.6-fold), respectively. The expression levels of these genes were confirmed by qRT-PCR in Fig 1C. Our published study reported that oxidative stress genes, mitochondria specific SOD-2, HOX-1, and PTGS2/COX-2 were up-regulated by TL. This study is the first to report that TL induce the NRF2 signaling pathway.
Relative expression of pro-inflammatory response related genes is confirmed by qRT-PCR in Fig 1D. These genes were IL-8 (14.2-fold), IL-1α (10.5-fold), VEGFA (2-fold), ICAM-1 (4.6-fold), HSPA6 (11.6-fold), GADD45A (6.5-fold), IL-6 (4.2-fold), CXCL-2 (6-fold), ADAM-2 (1.6-fold), and KLF4 (11.8-fold), respectively. This study consistently confirms our previous report that expression of these pro-inflammatory genes is induced by TL [15].
We previously published the first evidence that expression of stress response transcription factor ATF3 is up-regulated by lipolysis using microarray data analysis [14]. In this study, RNA-Seq data analysis confirmed and reinforced our previous discovery that stress response ATF3 gene was significantly up-regulated by TL. In addition, this study uncovered the selective and robust induction of two transcript variants, ATF3 transcript variant 4 (ATF3-T4) and transcript variant 5 (ATF3-T5), up-regulated by lipolysis products. The human ATF3 gene has 8 transcript variants encoding different isoforms (https://www.ncbi.nlm.nih.gov/gene?Db=gene&Cmd=DetailsSearch&Term=467). ATF3-T4 and ATF3-T5 were increased 323.9-fold and 100.2-fold, respectively. Expression of these genes isoforms was confirmed by qRT-PCR (Fig 1E).
Effects of ATF3-specific transcript variants’ knockdown on TGRL lipolysis products-induced gene expression
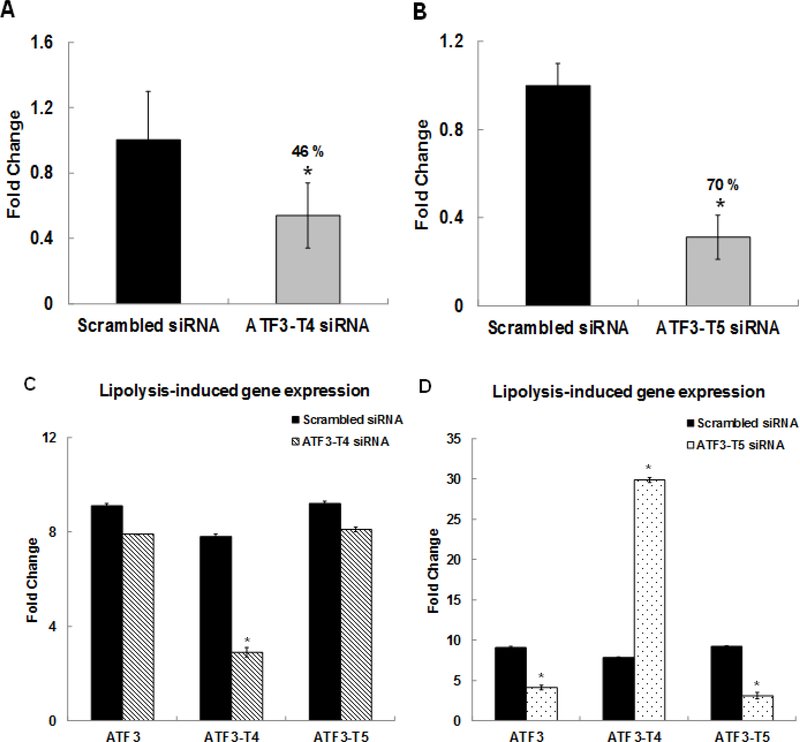
We identified the effects of ATF3-specific transcript variants on TL-induced gene expression in HBMECs. Cells were pretreated with either scrambled siRNA or ATF3-T4 siRNA or ATF3-T5 siRNA for 18 h before treatment with TL or control M. mRNA expression was assayed by qRT-PCR. In scrambled siRNA-treated HBMECs, both ATF3-T4 and ATF3-T5 expression were up-regulated significantly after treatment with TL for 3 h. Oligo-based siRNA targeting effectively decreased the amount of ATF3-T4 mRNA (46%) (Fig 2A) and ATF3-T5 mRNA (70%) (Fig 2B) in HBMECs after 3 h of TL treatment. Interestingly, pretreatment with ATF3-T4 siRNA suppressed only ATF3-T4 mRNA expression, not global ATF3 or ATF3-T5 expression (Fig 2C) compared to scrambled siRNA treatment. In contrast, pretreatment with ATF3-T5 siRNA suppressed both global ATF3 and ATF3-T5 mRNA expression while ATF3-T4 mRNA expression was further increased significantly (Fig 2D).
Figure 2. Effects of ATF3 transcript variant 4 and 5 siRNA.
HBMECs were transfected with ATF3-T4 or ATF3-T5 siRNA for 18 h and treated with TGRL lipolysis products (TL) for 3 h. mRNA expression was determined by qRT-PCR. The expression of each gene was normalized to that of GAPDH and the fold change was calculated as the difference in expression with TGRL lipolysis products (TL) in the presence of scrambled siRNA and ATF3-T4 siRNA or ATF3-T5 siRNA. A) ATF3-T4 mRNA was significantly knocked down after transfection with ATF3-T4 siRNA (N = 3/treatment group, *P≤ 0.05 compared to scrambled Media control); B) ATF3-T5 mRNA was significantly knocked down after transfection with ATF3-T5 siRNA (N = 3/treatment group, *P≤ 0.05 compared to scrambled Media control); C) Alterations in ATF3 gene transcription, ATF3-T4 transcripts, and ATF3-T5 transcripts after transfection with ATF3-T4 siRNA and followed by treatment with TL (N = 3/treatment group, *P≤ 0.05 compared to scrambled TL); D) Alterations in ATF3 gene transcription ATF3-T4 transcripts, and ATF3-T5 transcripts after transfection with ATF3-T5 siRNA and followed by treatment with TL (N = 3/treatment group, *P≤ 0.05 compared to scrambled TL).
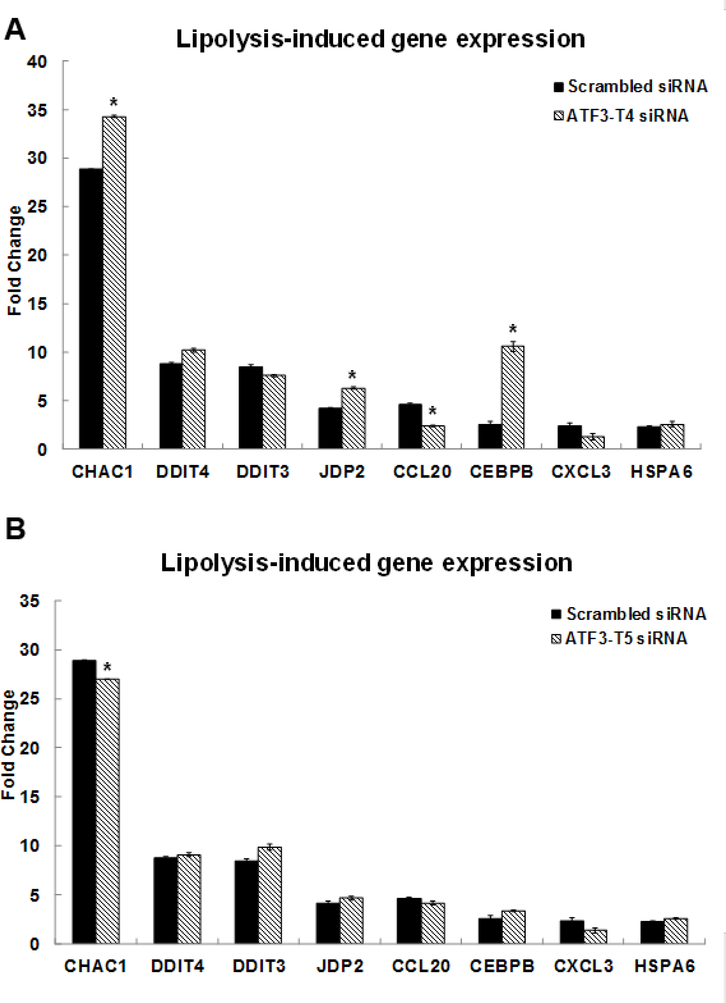
We determined whether the expression of selected genes was affected by the two transcript variants. In the ATF3-T4 siRNA pretreated group, CHAC1, JDP2 and CEBPB mRNA expression increased significantly and CCL20 expression was significantly suppressed compared to TL-induced gene expression (Fig 3A). In contrast, CHAC1 expression was significantly decreased in the ATF3-T5 siRNA pretreated group compared to the scrambled siRNA treated group (Fig 3B).
Figure 3. Control of ATF3 transcript variant 4 and 5 on lipolysis-induced top selected differential gene expression.
HBMECs were transfected with ATF3-T4 or ATF3-T5 siRNA for 18 h and treated with TGRL lipolysis products (TL) for 3 h. mRNA expression was determined by qRT-PCR. The expression of each gene was normalized to that of GAPDH and the fold change was calculated as the difference in expression with TGRL lipolysis products in the presence of scrambled siRNA and ATF3-T4 siRNA or ATF3-T5 siRNA. A) CHAC1, JDP2, and CEBPB were significantly increased and CCL20 was significantly suppressed after transfection with ATF3-T4 siRNA and followed by treatment with TL (N = 3/treatment group, *P≤ 0.05 compared to scrambled TL); B) CHAC1 expression was significantly suppressed after transfection with ATF3-T5 siRNA and followed by treatment with TL (N = 3/treatment group, *P≤ 0.05 compared to scrambled TL).
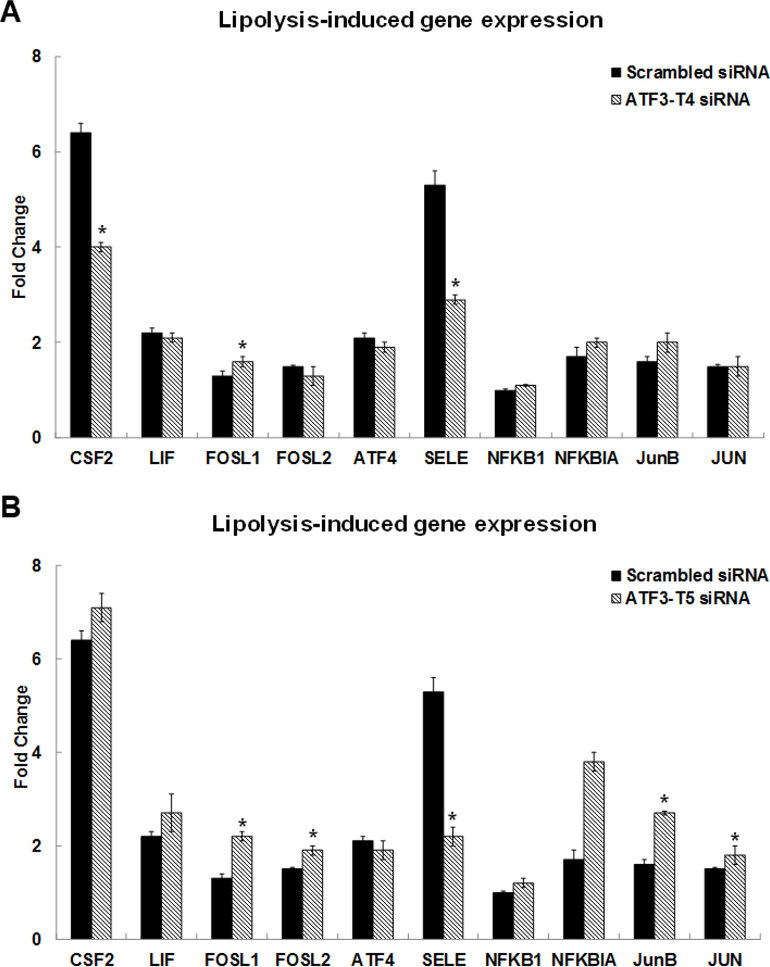
Among the TNF signaling related genes, CSF2 and E-Selectin (SELE) were significantly suppressed while FOSL1 expression increased in the ATF3-T4 siRNA pretreated group (Fig 4A). With pretreatment with ATF3-T5 siRNA, FOSL1, FOSL2, JunB, and JUN were significantly increased compared to scrambled siRNA treatment (Fig 4B). Interestingly, SELE/E-Selectin was significantly suppressed in the ATF3-T5 siRNA pretreatment group (Fig 4B).
Figure 4. Control of ATF3 transcript variant 4 and 5 on lipolysis-induced TNF signaling-related gene expression.
HBMECs were transfected with ATF3-T4 or ATF3-T5 siRNA for 18 h and treated with TGRL lipolysis products (TL) for 3 h. mRNA expression was determined by qRT-PCR. The expression of each gene was normalized to that of GAPDH and the fold change was calculated as the difference in expression with TGRL lipolysis products in the presence of scrambled siRNA and ATF3-T4 siRNA or ATF3-T5 siRNA. A) CSF2 & SELE/E-Selectin were significantly suppressed and FOSL1 was significantly increased after transfection with ATF3-T4 siRNA and followed by treatment with TL (N = 3/treatment group, *P≤ 0.05 compared to scrambled TL); B) FOSL1, FOSL2. JunB, and JUN were significantly increased and SELE/E-Selectin was significantly suppressed after transfection with ATF3-T5 siRNA and followed by treatment with TL (N = 3/treatment group, *P≤ 0.05 compared to scrambled TL).
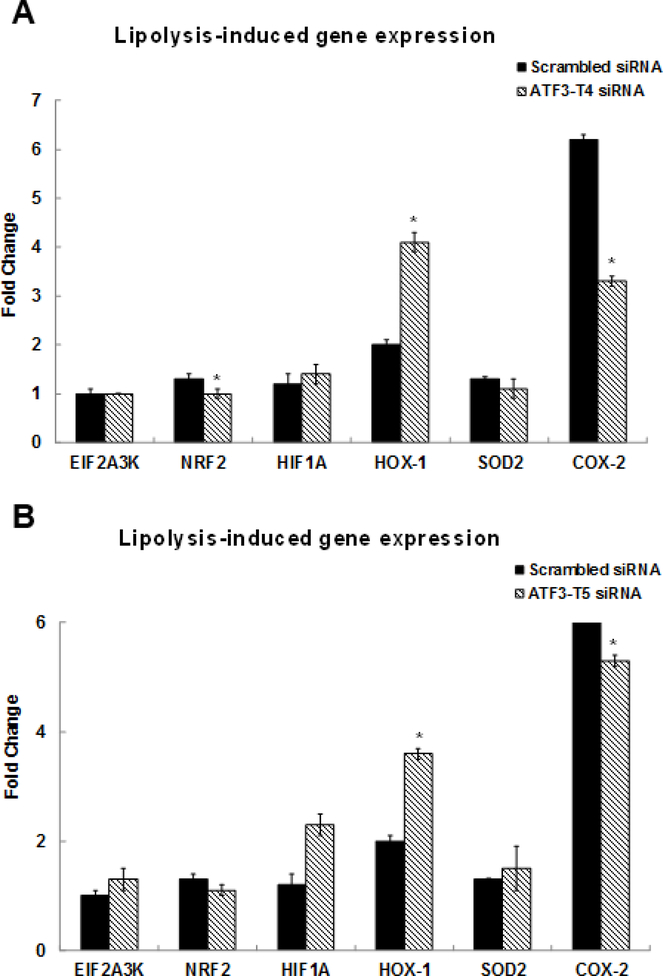
Among the NRF2 signaling related genes, NRF2 and PTGS2/COX-2 were significantly suppressed and HOX-1 was dramatically increased in the ATF3-T4 siRNA pretreatment group (Fig 5A). ATF3-T5 siRNA pretreatment significantly suppressed PTGS2/COX-2 but further increased HOX-1 expression (Fig 5B).
Figure 5. Control of ATF3 transcript variant 4 and 5 on lipolysis-induced NRF2 signaling-related gene expression.
HBMECs were transfected with ATF3-T4 or ATF3-T5 siRNA for 18 h and treated with TGRL lipolysis products (TL) for 3 h. mRNA expression was determined by qRT-PCR. The expression of each gene was normalized to that of GAPDH and the fold change was calculated as the difference in expression with TGRL lipolysis products in the presence of scrambled siRNA and ATF3-T4 siRNA or ATF3-T5 siRNA. A) NRF2 and PTGS2/COX-2 were significantly suppressed and HOX-1 was significantly increased after transfection with ATF3-T4 siRNA and followed by treatment with TL (N = 3/treatment group, *P≤ 0.05 compared to scrambled TL); B) PTGS2/COX-2 were significantly suppressed and HOX-1 was significantly increased after transfection with ATF3-T5 siRNA and followed by treatment with TL (N = 3/treatment group, *P≤ 0.05 compared to scrambled TL).
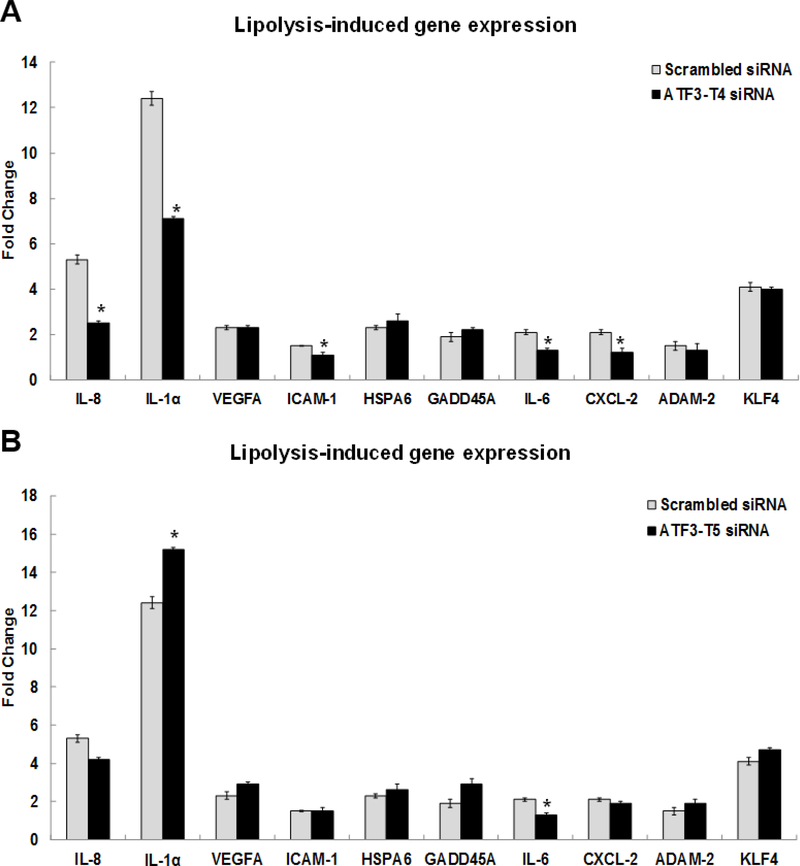
Relative to pro-inflammatory gene expression induced by TL, IL-8, IL-1α, ICAM-1, IL-6, and CXCL-2 were significantly decreased in the ATF3-T4 siRNA pretreatment group (Fig 6A). In the ATF3-T5 siRNA pretreatment group, IL-6 was significantly decreased and IL-1α was further increased compared to scrambled siRNA treatment (Fig 6B).
Figure 6. Control of ATF3 transcript variant 4 and 5 on lipolysis-induced inflammatory response gene expression.
HBMECs were transfected with ATF3-T4 or ATF3-T5 siRNA for 18 h and treated with TGRL lipolysis products (TL) for 3 h. mRNA expression was determined by qRT-PCR. The expression of each gene was normalized to that of GAPDH and the fold change was calculated as the difference in expression with TGRL lipolysis products in the presence of scrambled siRNA and ATF3-T4 siRNA or ATF3-T5 siRNA. A) Significantly suppressed IL-8, IL-1a, ICAM-1, IL-6, and CXCL-2 after transfection with ATF3-T4 siRNA and followed by treatment with TL (N = 3/treatment group, *P≤ 0.05 compared to scrambled TL); B) Significantly increased IL-1a and decreased IL-6after transfection with ATF3-T5 siRNA and followed by treatment with TL (N = 3/treatment group, *P≤ 0.05 compared to scrambled TL).
TGRL lipolysis products induce ATF3 expression and activate MAPK pathway
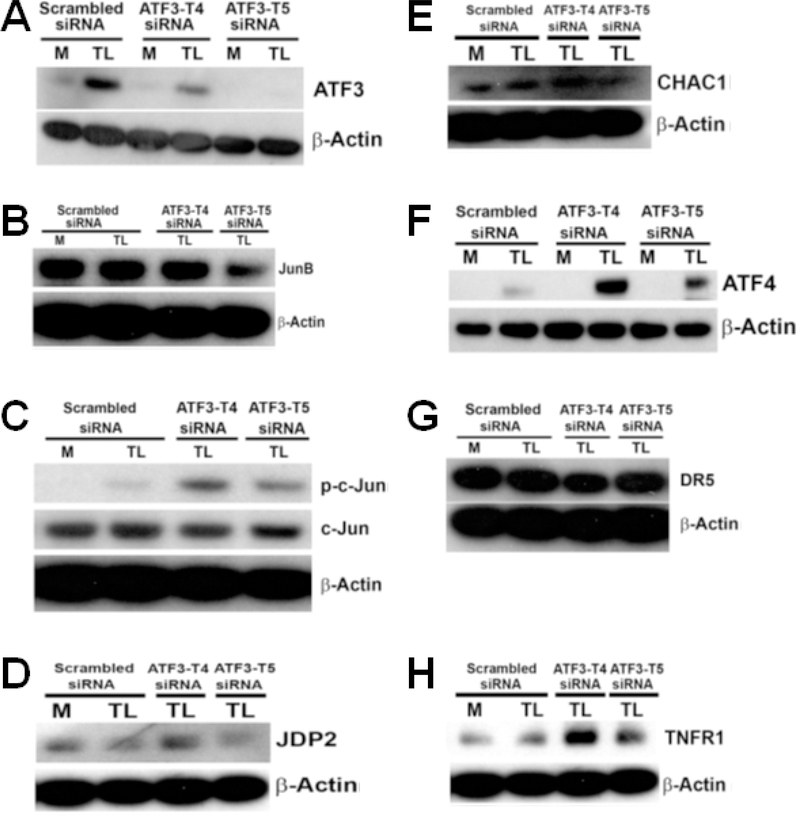
To examine the association between ATF3 protein expression and mitogen-activated protein kinase (MAPK) signaling, HBMECs were pretreated as above. Protein expression was assessed by western blot analysis. TL-induced ATF3 protein expression was suppressed 50 % with pretreated ATF3-T4 siRNA, and was significantly eliminated with pretreated ATF3-T5 siRNA (Fig 7A). Interestingly, JunB protein expression was significantly reduced with ATF3-T5 siRNA but did not change with ATF3-T4 siRNA (Fig 7B). Phosphorylated-c-Jun (p-c-Jun) (Fig 7C) was further increased in both the ATF3-T4 and ATF3-T5 siRNA treatment group.
Figure 7. Effects of ATF3 transcript variant 4 and 5 siRNA on lipolysis products-induced protein expression.
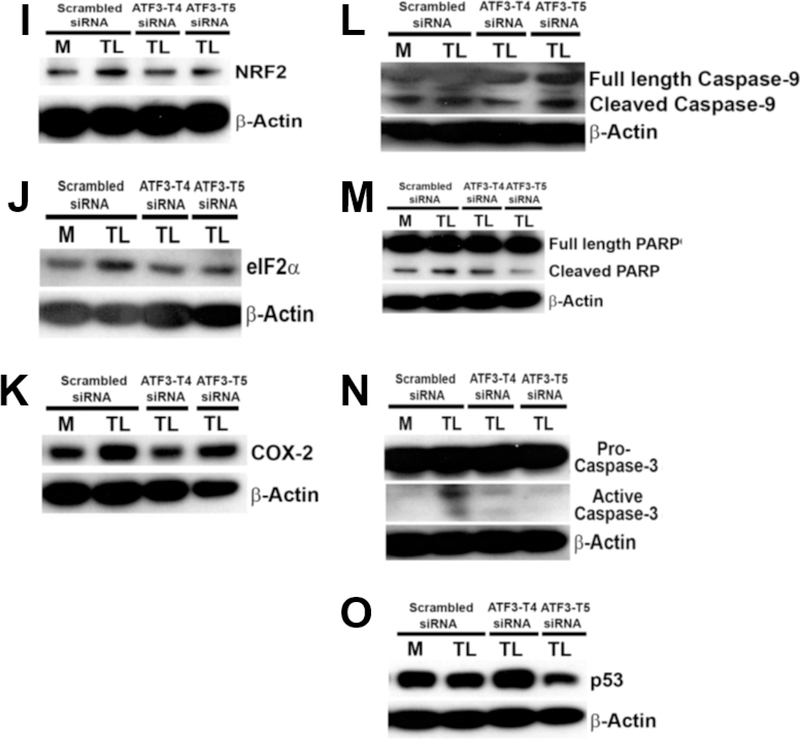
HBMECs were transfected with ATF3-T4 or ATF3-T5 siRNA for 18 h and treated with TGRL lipolysis products (TL) for 3 h. Cell lysates were analyzed by western blotting. A) Both transcript variants significantly suppressed lipolysis-induced ATF3; B) Inhibiting with ATF3-T5 siRNA decreased lipolysis-induced JunB, but not with ATF3-T4 siRNA; C) inhibiting with ATF3-T4 siRNA or ATF3-T5 siRNA further increased lipolysis-induced p-c-Jun expression; D) Inhibiting with ATF3-T4 siRNA further increased lipolysis-induced JDP2, but not with ATF3-T5; E) Inhibiting with ATF3-T4 siRNA further increased CHAC1, but not with ATF3-T5 siRNA; F) Inhibiting with ATF3-T4 siRNA or ATF3-T5 siRNA further significantly increased lipolysis-induced ATF4; G) inhibiting with ATF3-T4 siRNA significantly decreased lipolysis-induced DR5, but not with ATF3-T5 siRNA; H) inhibiting with ATF3-T4 siRNA or ATF3-T5 siRNA further increased TNFR1; I) inhibiting with ATF3-T4 siRNA or ATF3-T5 siRNA decreased lipolysis-induced NRF2; J) Inhibiting with ATF3-T4 siRNA or ATF3-T5 siRNA suppressed lipolysis-induced eIF2α; K) Inhibiting with ATF3-T4 siRNA or ATF3-T5 siRNA suppressed lipolysis-induced COX-2; L) Inhibiting with ATF3-T4 siRNA suppressed lipolysis-induced cleaved capase-9, but further increased ATF3-T5 siRNA; M) Inhibiting with ATF3-T5 siRNA suppressed lipolysis-induced PARP, but no change with ATF3-T4 siRNA; N) Both transcript variants suppressed lipolysis-activated active caspase-3; O) Inhibiting with ATF3-T4 siRNA further increased p53, but suppressed with ATF3-T5 siRNA. N = 3/treatment group.
JDP2 protein expression was significantly increased with ATF3-T4 siRNA and significantly suppressed with ATF3-T5 siRNA (Fig 7D). Additionally, CHAC1 protein expression was further increased with ATF3-T4 siRNA but did not change with ATF3-T5 siRNA (Fig 7E).
TGRL lipolysis products activate parallel TNF signaling pathway
Protein expression of ATF4 (Fig 7F), known to be induced by TNFα, was further increased in both ATF3-T4 and ATF3-T5 siRNA treatment group. A cell surface receptor of the TNF-receptor, death receptor 5 (DR5), also known as tumor necrosis factor receptor superfamily member 10B (TNFRSF10B) or TNF-related apoptosis-inducing ligand receptor-2 (TRAIL-R2) was increased by TL. This was suppressed by pretreatment with ATF3-T4 siRNA but not with ATF3-T5 (Fig 7G). In contrast, tumor necrosis factor receptor 1 (TNFR1) protein expression was further increased in both ATF3-T4 and ATF3-T5 siRNA pretreatment groups compared to TL-induced TNFR1 expression (Fig 7H). TNFα bind to TNFR1 inducing receptor trimerization and activation, which plays a role in cell survival, apoptosis, and inflammation.
TGRL lipolysis products also activate the NRF2 signaling pathway through oxidative stress
Here we showed NRF2 protein expression was significantly increased by TL, which is significantly reduced by either ATF3-T4 or ATF3-T5 siRNA pretreatment (Fig 7I). We have previously shown that TL generate mitochondrial superoxide radical generation and oxidative stress to cells. NRF2 protein regulates the expression of antioxidant proteins that protect against oxidative damage triggered by injury and inflammation. Additionally, eukaryotic Initiation Factor 2-alpha (eIF2α), which is known to be involved in stress responses and is an apoptosis protein, was significantly suppressed with ATF3-T4 or ATF3-T5 siRNA pretreatment compared to TL-induced expression (Fig 7J). TL induced COX-2 protein expression was significantly suppressed by pretreatment with ATF3-T4 or ATF3-T5 siRNA (Fig 7K). COX-2 is responsible for biosynthesis of prostanoids involved in inflammation and mitogenesis [55,56,57].
Knockdown of ATF3 transcript variant 4 and 5 siRNA suppresses induction of TGRL lipolysis products-induced vascular endothelial cell apoptosis
TGRL lipolysis products (TL) induced parallel ATF3-MAPK, TNF, and NRF2 signaling pathways which further activate apoptosis and cellular inflammation. TL activated mitochondrial apoptosis protein cleaved-caspase-9 that was significantly suppressed with ATF3-T4 siRNA, but not with ATF3-T5 siRNA (Fig 7L). Pretreatment with ATF3-T4 or ATF3-T5 siRNA significantly suppressed TL activated cell apoptosis protein cleaved-PARP (Fig 7M) and cleaved-caspase-3 protein expression (Fig 7N). In contrast, TL-induced p53 protein expression was significantly increased with ATF3-T4 siRNA but significantly decreased with ATF3-T5 siRNA compared to pretreated scrambled siRNA (Fig 7O).
Secreted pro-inflammatory cytokines and chemokines expression
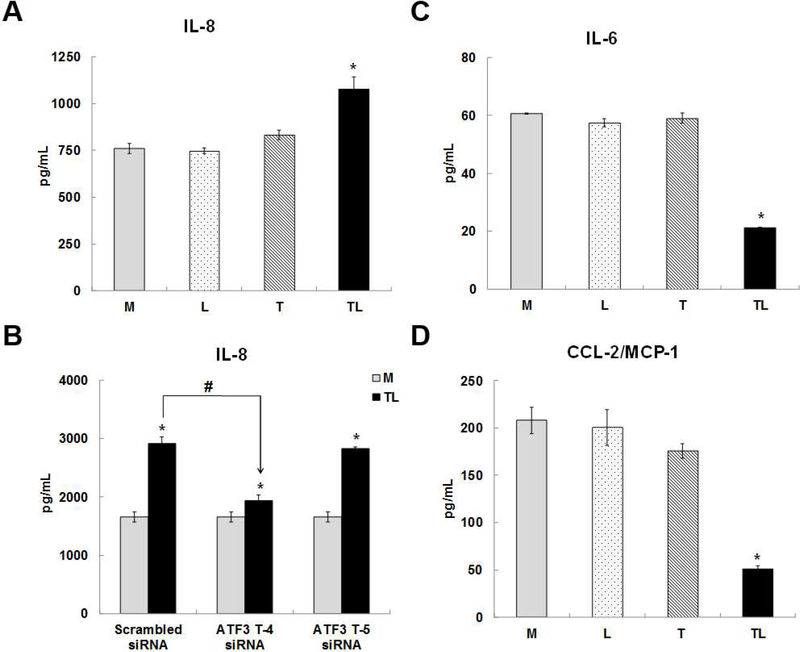
The cytokines and chemokines expression were measured in the cell culture medium of the above-mentioned treatments. In cell culture medium of TL-treated cells, chemokine, IL-8 (Fig 8A), was significantly up regulated, and cytokines, IL-6 (Fig 8C) and CCL-2/MCP-1 (Fig 8D), were significantly down regulated in comparison to the control cell culture medium. In the cell culture medium of cells pre-treated with ATF3-T4 siRNA before the treatment of TL, IL-8 expression was significantly reduced in comparison to the cytokines in the cell culture medium of pretreated cells with scrambled siRNA before the TL treatment, but not in the medium of pretreated cells with ATF3-T5 siRNA (Fig 8B). Pre-treatment with ATF3-T4 or ATF3-T5 siRNA did not change IL-6 or CCL-2/MCP-1 secretion (data not shown). The cytokines expression of IL-1β, TNF, MIP-1α, and MIP-3α did not change in TL treated cell culture medium.
Figure 8. Cytokine/Chemokine secretion by lipolysis products.
HBMECs were treated with media control (Media) or TGRL lipolysis products (TL= TGRL, 150 mg/dL + lipoprotein lipase, 2 U/mL) for 3 h and the supernatant was collected. For siRNA treatment, cells were transfected with scrambled siRNA and ATF3-T4 siRNA or ATF3-T5 siRNA 18 h prior to lipolysis product exposure. Cytokine/chemokine secretion in cells supernatant were measured by ELISA. A) Lipolysis products significantly increased IL-8 secretion (N = 5/treatment group, *P≤ 0.05 compared to Media control); B) inhibiting with ATF3-T4 siRNA significantly suppressed lipolysis products-induced IL-8 secretion, but not ATF3-T5 siRNA (N = 5/treatment group, P≤ 0.05, *= scrambled TL compared to scrambled control, # = ATF3-T4 siRNA TL compared to scrambled TL); C) Lipolysis products significantly decreased IL-6 secretion (N = 5/treatment group, *P≤ 0.05 compared to Media control); D) Lipolysis products significantly decreased CCL-2/MCP-1 secretion (N = 5/treatment group, *P≤ 0.05 compared to Media control).
Effects of lipolysis products on mitochondrial respiration
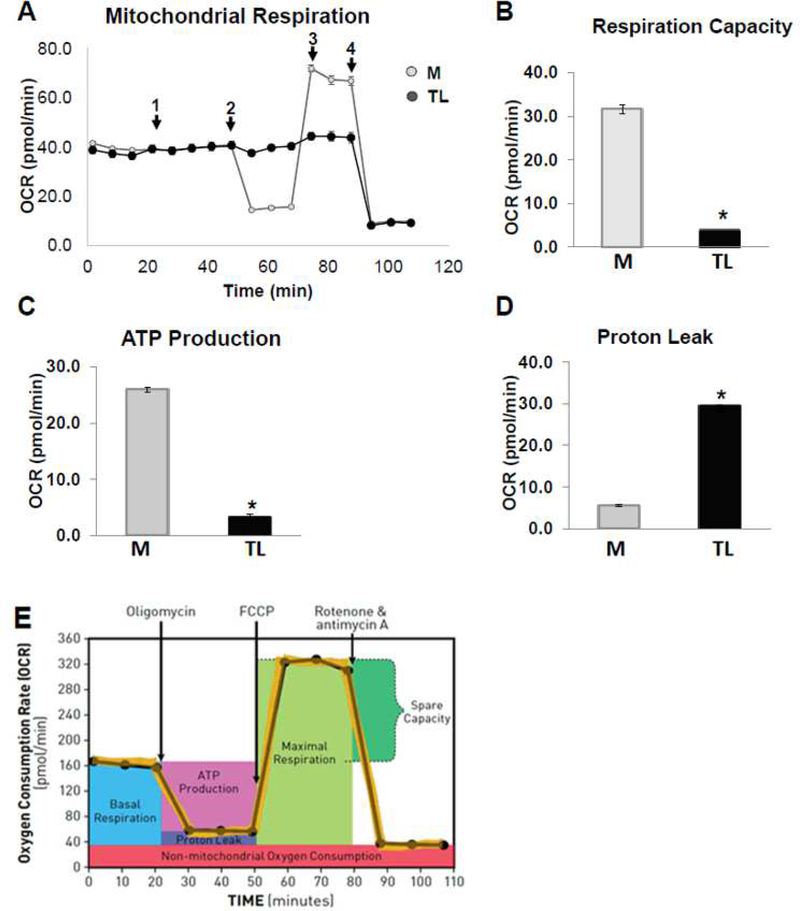
Mitochondrial functions play a central role in energy demanding cellular processes such as cellular activation, proliferation, differentiation, and dysfunction. The electron transport chain (ETC) is the primary molecular pathway for generating electrons, protons, and ATP, and consuming oxygen. Mito Stress test analysis measure mitochondrial basal oxygen consumption (respiration), ATP-linked respiration, H+ (Proton) leak, maximal respiration, spare respiratory capacity, and non-mitochondrial respiration. FCCP stimulates respiration in mitochondria by uncoupling ATP synthesis from electron transport, while rotenone and antimycin A inhibit complexes I and III, respectively. When the cells are provided with mitochondrial substrates, rotenone and antimycin A, oxygen consumption is stimulated, illustrating the importance of optimizing substrate when determining maximal respiratory capacity. Fig 9A shows the raw trace of oxygen consumption rate (OCR) after the sequential addition into ports A-D. TL reduced mitochondrial respiration or oxygen consumption (Fig 9B) and reduced ATP production (Fig 9C) compared to the media control (M). The pH decreased from 6.8 to 6.5 after treated with TL compared to control M. Additionally, TL also increased mitochondrial proton leak compared to the M (Fig 9D). The profile of the Aglient Seahorse XF Mito stress test is shown in Fig 9E.
Figure 9. Lipolysis products decreased mitochondrial respiratory reserve capacity.
HBMECs were injected port A-D with (1) lipolysis products for 30 min and followed by (2) 1 μM Oligomycin, (3) 1 μM FCCP, and (4) 0.5 μM rotenone combined with 0.5 μM antimycin A were added sequentially to measure cellular respiration parameters (basal respiration, maximal respiration, spare respiratory capacity and non-mitochondrial respiration). A mitochondrial respiration measurement of oxygen consumption rate (OCR) was performed during acute TGRL lipolysis products treatment using the XF Cell miniplate Seahorse system. A) Raw trace of OCR regulated by lipolysis products; B) reduced mitochondrial respiration or oxygen consumption; C) reduced ATP production; D) increased proton leak compared to media control treatment; E) Profile of Aglient Seahorse XF Mito stress test. N = 6 wells/treatment group and values are expressed as means ± SEM, *P≤0.05, compared to control group at the same time point.
Assessment of maximum glycolytic capacity induced by lipolysis products
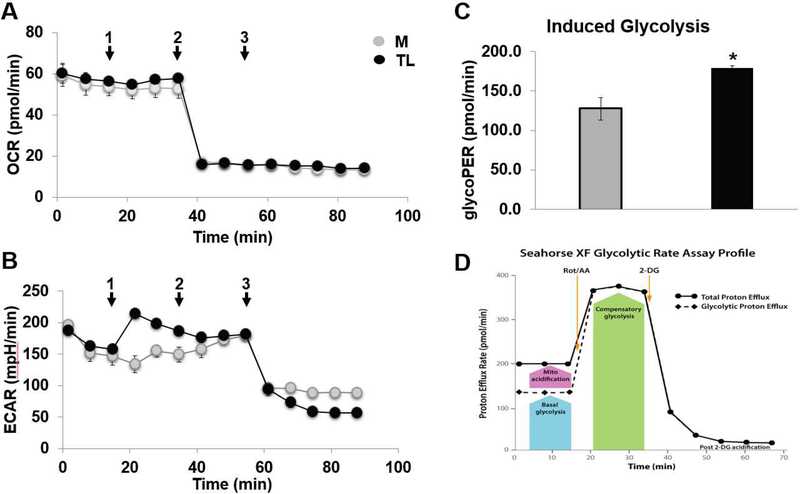
Two major metabolic pathways, respiratory and glycolytic, contribute to ATP metabolism. Although full flux analysis with tracers can be used to quantify them, it is often more convenient to distinguish and measure the activities of two pathways by the rates of change in extracellular concentrations of dissolved oxygen (O2) and protons (H+), respectively. To determine the rate of cellular glycolysis, we measured glycolytic rate and maximum glycolytic capacity using extracellular flux analysis. To estimate maximum glycolytic capacity, cells were injected with control M or TL and incubated for 30 min, followed by complete inhibition of the respiratory chain by the addition of rotenone (which inhibits respiratory complex I) plus antimycin A (which inhibits complex III), and 2DG, injected into ports A-C. Fig 10A and 10B show the raw trace of oxygen consumption rate (OCR) and extracellular acidification rate (ECAR) after sequential addition into ports A-C. Lipolysis products TL induced glycolysis (Fig 10C) compared to the media control. The profile of Agilent Seahorse XF glycolytic rate assay is shown in Fig 10D.
Figure 10. Lipolysis products increased glycolytic rate.
HBMECs were assayed for both oxygen consumption rate (OCR) and extracellular acidification rate (ECAR) in DMEM Base Medium without phenol red, supplemented with 10 mM glucose, 2 mM glutamine, 1 mM pyruvate, 5 mM HEPES, pH 7.4. Cells were injected port A-C with (1) media control or lipolysis products for 30 min and followed by (2) 0.5 μM rotenone combined with 0.5 μM antimycin A, and (3) 2DG were added sequentially to measure cellular respiration parameters (basal respiration, maximal respiration, spare respiratory capacity and non-mitochondrial respiration). A glycolytic rate measurement of OCR and ECAR were performed during acute TGRL lipolysis products treatment using the XF Cell miniplate Seahorse system. A) Raw trace of oxygen consumption rate (OCR); B) Raw trace of extracellular acidification rate (ECAR); C) Increased glycolytic rate; D) Profile of Aglient Seahorse XF Glycolytic rate test. N = 6 wells/treatment group and values are expressed as means ± SEM, *P≤0.05, compared to control group at the same time point.
Mitochondrial DNA (mtDNA) copy number
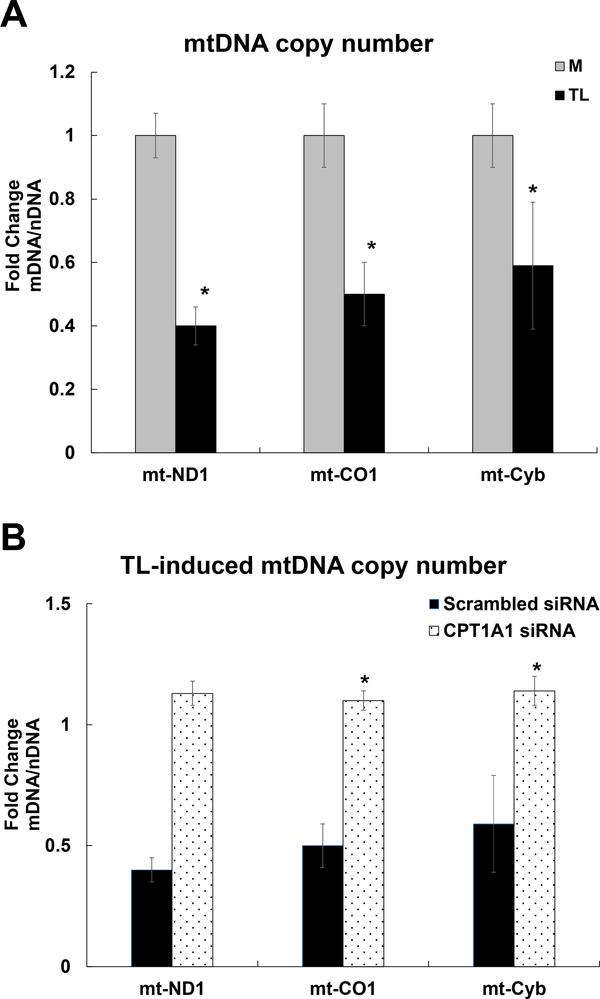
In this study, we determined the oxidant-induced mitochondrial damage by measuring the mtDNA copy number. MtDNA copy number is significantly lower in the TL treated group compared to control M, which is assessed by the ratio of mtDNA: nuDNA using qRT-PCR analysis. The copy number of mt-ND1 (0.4-fold), mt-CO1 (0.5-fold), and mt-Cyb (0.59-fold) were significantly lower in the TL treated group compared to control M (Fig 11A).
Figure 11. Mitochondrial DNA copy number.
HBMECs were treated with control M or TGRL lipolysis products (TL) for 3 h. The relative mitochondrial DNA (mtDNA) copy number was defined as the total amount of mtDNA (ND1, CO1, and Cyb) divided by the total amount of nuclear DNA (B2M) using qRT-PCR analysis. A) TL significantly decreased mitochondrial DNA copy number. B) CPT1A1 siRNA significantly recovered TL-induced mitochondrial DNA copy number or dysfunction. N = 3/treatment group and the values are expressed as means ± SEM, *P≤0.05, TL compared to M group or TL treated CPT1A1 siRNA compared to Scrambled siRNA at the same time point.
We determined whether inhibiting the mitochondrial β-oxidation protect mitochondrial dysfunction or damage by mtDNA copy number analysis. We demonstrated that TL reduced mitochondrial DNA copy number of ND1 (1.13-fold), mt-CO1 (1.1-fold), and mt-Cyb (1.14-fold) was significantly increased with CPT1A1 siRNA knockdown (Fig 11B).
CPT1A1 siRNA suppresses induction of a subset of inflammatory genes
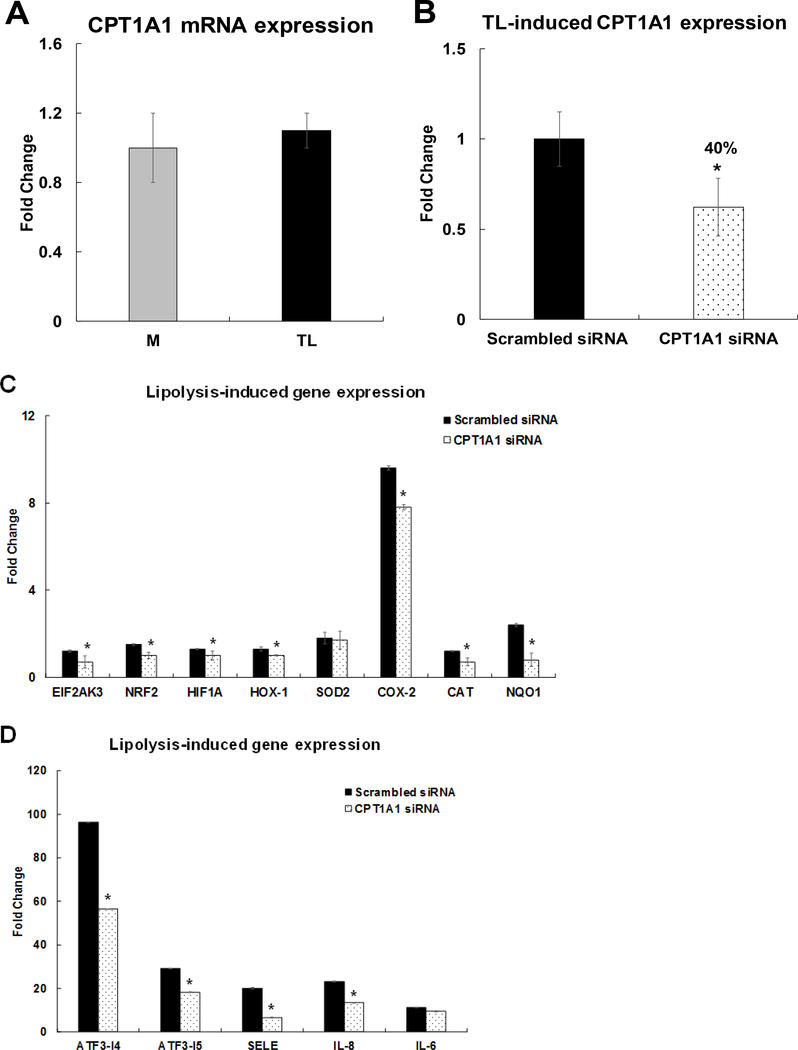
The present study identified that TL did not alter CPT1A1 mRNA expression in Fig 12A. CPT1A1 mRNA expression in CPT1A1 siRNA-treated HBMECs was decreased by 40% of the expression level of the scrambled siRNA-treated HBMECs after 3 h of TL treatment (Fig 12B). Then, we determined the relationship between CPT1A1 and induction of oxidative stress and pro-inflammatory gene networks. The mRNAs expression of oxidative stress response genes, EIF2AK3, NRF2, HIF1A, HOX-1, SOD-2, COX-2, catalase (CAT), and NAD(P)H Quinone Dehydrogenase 1 (NQO1), was quantified in CPT1A1 siRNA–transfected cells. Inhibiting CPT1A1 significantly decreased TL–induced EIF2AK3, NRF2, HIF1A, HOX-1, COX-2, CAT, and NQO1 mRNA expression levels (Fig 12C). Interestingly, inhibiting CPT1A1 siRNA did not alter mitochondrial SOD-2 gene expression induced by TL (Fig 12C). The mRNA transcription of ATF3-T4, ATF3-T5, SELE/E-selectin, IL-8, and IL-6 genes were quantified in CPT1A1 siRNA–transfected cells. Inhibiting CPT1A1 significantly decreased ATF3-T4, ATF3-T5, E-selectin, and IL-8 mRNA expression (Fig 12D). In contrast, mRNA expression of IL-6 was not altered by inhibition of CPT1A1 (Fig 12D).
Figure 12. Regulation of CPT1A1 on TL-induced oxidative stress responsive gene expression.
HBMECs were transfected with CPT1A1 siRNA for 48 h and treated with TGRL lipolysis products (TL) for 3 h. mRNA expression was determined by qRT-PCR. The expression of each gene was normalized to that of GAPDH and the fold change was calculated as the difference in expression with TGRL lipolysis products in the presence of scrambled siRNA and CPT1A1 siRNA. A) TL did not alter CPT1A1 mRNA expression B) CPT1A1 mRNA was significantly knocked down after transfection with CPT1A1 siRNA (N = 3/treatment group, *P≤ 0.05, CPT1A1 siRNA compared to scrambled Media control); C) Significantly suppressed oxidative stress responsive genes (EIF2AK3, NRF2, HIF1A, HOX-1, COX-2, CAT, and NQO1) and did not alter mitochondrial SOD-2 expression; D) Significantly suppressed stress responsive transcription factors (ATF3-T4 and ATF3-T5) and pro-inflammatory genes (SELE/E-Selectin and IL-8) and did not alter IL-6 expression after transfection with CPT1A1 siRNA and followed by treatment with TL (N = 3/treatment group and values are expressed as means ± SEM,*P≤ 0.05, compared to scrambled TL).
Effect of CPT1A1 siRNA on superoxide radical generation
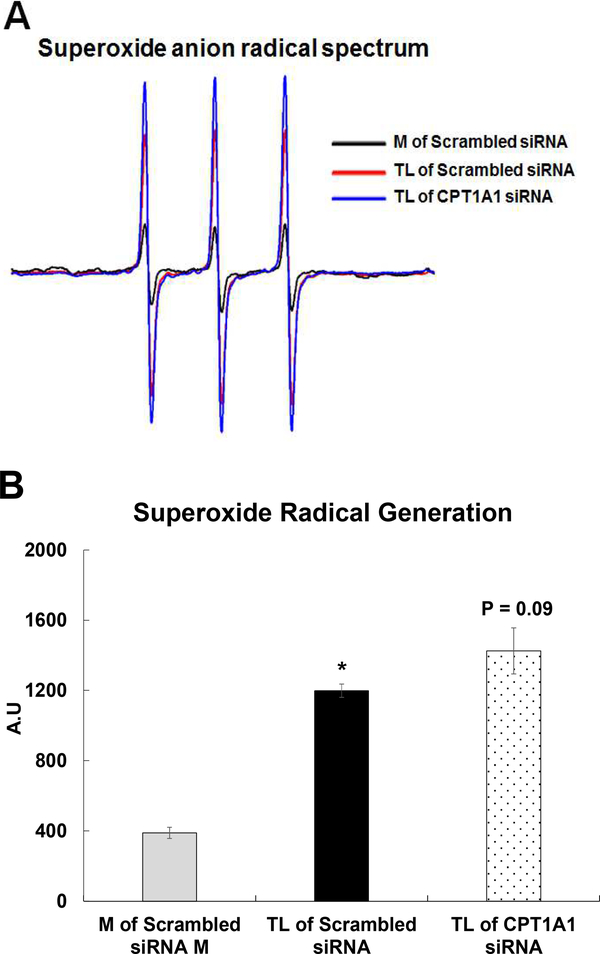
We have previously shown that acute TL insult increases O2.− generation in the supernatant of HBMEC at 15 min and the involvement of oxidative stress is observed in the cellular injury. In this study, we determined the effect of CPT1A1 siRNA on O2.− generation in the supernatant of HBMEC using electron paramagnetic resonance (EPR). CP-H spin trap was used to quantify O2.− formation. Exposure of TL to HBMECs generates a large nitroxide signal in the cells supernatant, indicating an oxidation of the CP-H spin trap. Inhibiting with CPT1A1 siRNA did not alter the TL-activated nitroxide signal (Fig 13A). The intensities of the EPR signals are shown in Fig 13B.
Figure 13. TGRL lipolysis products-activated superoxide radical (O2−.) in supernatant solution.
HBMECs were treated with media (M) or TGRL lipolysis products (TL) for 15 min. Supernatant solutions from the alternatively treated cells were incubated with the diamagnetic (EPR-silent) CP-H spin trap and scanned by EPR. A) TL-activated O2−. generation and the intensity of the 3-line nitroxide spectrum is indicative of the rate of CP-H oxidation, which generates the paramagnetic nitroxide species; B) Quantification of oxidized CP-H signal is shown in panel. N = 3 /treatment group and results expressed as means ± SEM. p ≤ 0.05 was considered significant. * = TL compared to M.
Lipid droplet formation and intracellular lipid uptake by HBMEC
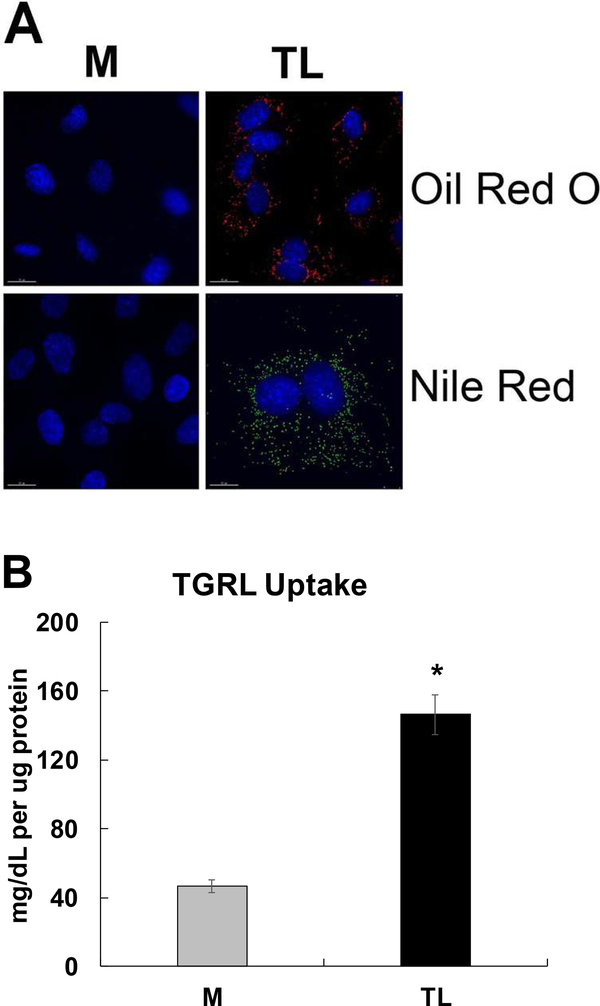
We have previously shown that TL-treated HBMEC formed lipid droplets. In this study, lipid droplet formations were analyzed by Oil Red O and Nile Red staining. Lipid droplet formations were only observed with TL treated cells compared to control M in Fig 14A. Additionally, we analyzed intracellular TGRL uptake. TGRL concentration inside cells was also significantly increased (Fig 14B) by TL treatment compared to control M.
Figure 14. TGRL lipolysis products induced lipid droplet (LD) formation and increased lipid uptake in HBMEC.
A) LD formations were observed in TL-treated cells by Oil Red O staining (Red color), which detects neutral lipid deposits, and Nile Red staining (Green), which detects detectscholesteryl esters and triacylglycerols (bar = 15 μm), N = 4 coverslips/treatment group; B) TGRL concentration significantly increased in TL treated HBMECs. N = 15 samples/treatment group and results expressed as means ± SEM. p ≤ 0.05 was considered significant. * = TL compared to M.
DISCUSSION
We previously examined the effects of TGRL lipolysis products (TL) on HBMECs in vitro using microarray data analysis [14] and showed that stress-responsive transcription factor ATF3 was significantly up-regulated by TL. We have shown that TL causes lipotoxic injury to HBMECs and this lipotoxicity occurs through stimulation of mitochondrial metabolism resulting in overproduction of superoxide radical (O2•−) [15].
We previously reported that TL increased mitochondrial O2•− generation, ATF3-mediated inflammatory, and apoptotic responses in in vitro HBMECs culture [15]. Moreover, our previous finding in vivo also demonstrated that ATF3 is up-regulated in brain microvessels in a murine model of hyperlipidemia, with an overall in vivo phenotype similar to that observed in in vitro HBMECs. These responses may alter the integrity of the blood-brain barrier, induce neurovascular inflammation, and contribute to cognitive decline. This appears to be an important response to vascular stress in the brain as Takara et al showed that ATF3 was up-regulated in brain cells after reperfusion following transient middle cerebral artery occlusion [58].
Here, we describe our efforts to uncover the mechanisms, both metabolic and transcriptional, that contribute to injuries to endothelium by diet derived lipolysis products. The data from this study show that mitochondrial oxygen consumption or respiration capacity and adenosine triphosphate (ATP) production was significantly decreased by TL treatment, resulting in increased mitochondrial proton leak. This study supports our previous finding that mitochondrial O2•− generation and ROS are by-products of cellular respiration in TL-treated HBMECs. When mitochondria generate O2•− production, mitochondria are not making ATP predominantly from complex I. The mitochondrial electron transport chain contains several redox centers that leak electrons to oxygen [59,60].
Additionally, TL also increased glycolysis rate. Glycolysis breaks down glucose and forms pyruvate with the production of two molecules of ATP. The pyruvate end product of glycolysis can be used in either aerobic respiration via the tricarboxylic acid (TCA) cycle or anaerobic respiration. The TCA cycle yields much more usable energy for the cell. TCA has a central route for oxidative metabolism and a cyclic metabolic pathway consisting in the oxidation of acetyl-CoA, deriving from glycolysis through pyruvate dehydrogenase and from lipid β-oxidation [61]. Both aerobic and anaerobic respiration produce ATP; however, aerobic respiration produces a much more ATP compared to anaerobic respiration. The decrease in ATP production despite increased glycolysis in TL treatment suggests a switch to anaerobic metabolism occurs. Cellular glucose uptake is known to be associated with increased ROS and oxidative stress levels that drive stress-mediated signaling [62]. Hence, ROS is likely to be the primary mediator of uncoupling mitochondrial respiration from glycolysis. Dr. Widlansky group has intensively studied the glucose-induced endothelial dysfunction in human umbilical vein endothelial cells, coronary artery disease [46,63], and Type 2 Diabetes Mellitus [64]. Their studies showed that low-glucose causes mitochondrial superoxide production and endothelial dysfunction in aspects of diabetes and coronary artery disease.
We report here that the decrease in mtDNA copy number of mt-ND1, mt-CO1, and mt-Cyb gene expressions by TL suggested that TL damage mitochondria. MtDNA copy number variation is known to the indicative of oxidant-induced cell damage that has been observed in a variety of human diseases [64]. TL-induced mitochondria damage causes cellular stress and injury. The TL treatment also significantly decreased pH which determines the hydrogen ion concentration of a solution is higher in TL treatment. Our lab has previously shown that TL, products of LpL enzyme hydrolyzes with TGRL, releases excess FFAs, for example, linoleic acid [16]. The drop in pH is due to acidic extracellular environment which increases ROS generation in mitochondrial respiratory chain, induces mitochondrial DNA damage, and further decreases mitochondrial biogenesis [65,66,67]. CPT1A1 siRNA significantly increased TL-induced mitochondria copy number. These findings suggested that inhibiting the FA β-oxidation with CPT1A1 siRNA can prevent TL-induced mitochondrial dysfunction. We have reported previously that the generation of O2•− is increased in supernatant and in mitochondria at 15 min by TL [15]. Although CPT1A1 siRNA prevent mitochondrial dysfunction and cellular injury at 3 h, CPT1A1 siRNA did not alter TL-activated O2•− in supernatant at 15 min, which may be due to short sample time of 15 min.
Additionally, Cells lipid uptake or lipid droplet formations were significantly increased with TL treatment using Oil Red O and Nile Red staining in Fig 14A. The Oil Red O staining detects neutral lipid deposits and Nile Red staining detects cholesteryl esters and triacylglycerols [68]. The present study identified that HBMEC increases the uptake of both neutral lipid and triglycerides in TL treatment.
We detected increased expression of CPT1A transcript in response to TL exposure. CPT1 is a rate-limiting mitochondrial enzyme and responsible for β-oxidation in the mitochondria. CPT1 is anchored in the inner aspect of the outer mitochondrial membrane and catalyses the formation of long-chain acyl-CoA, which is imported into the inner mitochondrial membrane. CPT2 is located in the inner mitochondrial membrane. CPT1 has three isoforms, CPT1A, CPT1B, and CPT1C. CPT1A exists in all mammalian tissues including brain and mitochondria of all cells except skeletal muscle cells and brown adipose cells. The physiological role of CPT1A in brain microvascular endothelial cells is not known. The stabilization of mitochondrial outer membrane, we used CPT1A1 siRNA to determine the role of CPT1A in HBMEC by TL. Inhibiting with CPT1A1 siRNA did not alter TL-activated O2•− generation in the supernatant at 15 min. Additionally, inhibiting with CPT1A1 siRNA significantly suppressed TL-induced subsets of oxidative stress-responsive and inflammatory gene expression at 3 h. In contrast, TL-induced mitochondrial SOD-2 is not altered by pretreating with CPT1A1 siRNA. Our data suggested that CPT1A siRNA limits the TL-induced outer membrane of mitochondria β-oxidation and long chain fatty acid entering into inner mitochondrial membrane. CPT1A1 siRNA might not inhibit inner mitochondrial membrane and did not alter SOD-2 gene expression. Our findings with respect to FAs release from TL and inhibiting with CPT1A1 siRNA suggest mechanistically that FAs utilize mitochondrial β-oxidation system as biofuel production. Our data suggest that CPT1A1 siRNA inhibit mitochondrial superoxide production in cells at 3 h and perhaps improve endothelial dysfunction. CPT1A, Carnitine Acyltransferases, plays a key role in both transporting and handling fatty acids [69].
Some studies have suggested that role of CPT1 in mitochondrial β-oxidation and reactive oxygen species remains controversial [70,71]. Future study is needed to determine both stabilization of mitochondrial outer (CPT1) and inner (CPT2) membrane function by TL-induced brain microvascular endothelial function.
A decrease in mitochondrial complex I is known to associate with a reduction in carnitine palmitoyltransferase 1 (CPT1) and CPT2 level [71,72,73]. The mitochondrial outer (CPT1) and inner (CPT2) membrane transporter enzymes are specialized in transporting long-chain acyl-CoAs of FAs into the mitochondria membrane for bio-fuel production [71].
This is the first report examining the role of individual ATF3 transcript variants in the context of TL-induced brain microvascular endothelial cells inflammation. We utilized RNA-Seq and bioinformatics data analysis to identify specific variants of ATF3 response to TL. We identified 47 significant signaling pathways (P≤0.05) induced by TL which the two top signaling pathways were most significant with P value =0. We previously reported that the TL induced ATF3 MAPK signaling pathway and lipotoxic injury in HBMECs [14,15]. In this study, we also demonstrate that the TL activated TNF and NRF2 signaling pathways.
We previously demonstrated that pretreatment with ATF3 siRNA alters the general role of stress responsive ATF3-MAPKinase-signaling of which a subset of genes are related to TL-induced vascular inflammation and apoptosis [15]. In the present study, we demonstrate that specific variants of ATF3 are up-regulated by TL-induced stress and these variants have differing influences on proinflammatory response genes. Additionally, TL significantly increased JDP2 and CHAC1 mRNA and protein expression. JDP2 and ATF3 are two basic leucine zipper protein (bZIP) members of the AP-1 family of transcription factors. Here, we reported that both mRNA and protein of JDP2 is significantly increased in pretreated with ATF3-T4 siRNA but significantly suppressed with ATF3-T5 siRNA pretreatment. Specifically, ATF3-T5 can form a heterodimer with binding partners JDP2 and be an activator or a suppressor in HBMECs treated with TL. Further studies are needed to examine this possibility. Both mRNA and protein expression of CHAC1 were significantly increased with ATF3-T4 siRNA pretreatment and significantly suppressed with ATF3-T5 siRNA pretreatment compared to TL treatment alone. CHAC1 is a component of the ER stress response and has been shown to be regulated by ATF3 and ATF4 in kidney cells treated with oxidized phospholipids, in a model study of atherosclerosis [51]. Our study revealed that CHAC1 is downstream of ATF3-T5, but not ATF3-T4. Comparing downstream signaling of ATF3-T4 and ATF3-T5, it appears that ATF3-T5 induces more pro-inflammatory response genes and oxidative stress response protein expression.
ATF3 is induced by pathogenic stimuli such as oxidized low-density lipoprotein (OxLDL), tumor necrosis factor α (TNFα), or homocysteine in vascular endothelial cells [74,75,76]. TNFα is a potent cytokine produced in a variety of cells including vascular endothelial cells and is a key regulator of atherogenesis and thrombogenesis [77,78]. ATF3 is known to be a responsible for the inhibition of TNFα released in ethanol-exposed monocytes and macrophages [79]. Many clinical and animal studies strongly suggest an involvement of TNF-α in the pathophysiology of AD [80,81,82,83]. TL induced CSF2 mRNA and DR5 protein expression was significantly decreased by pretreatment with ATF3-T4 siRNA, but not with ATF3-T5 siRNA. Inhibiting with ATF3-T5 siRNA significantly further increased FOSL1, FOSL-2, JunB, and JUN gene expression and ATF4 and TNFR1 protein expression. ATF4, TNFR1 and DR5 are known to be activated by TNFα. TNF-signaling was regulated by ATF3-T4, but not by the ATF3-T5 transcript variant.
Many transcription factors/proteins such as nuclear respiratory factors (NRF-1 and NRF-2) regulate the transcription of the core mitochondrial enzymes. TL up-regulated NRF2 signaling related genes, NRF2, HIF1A, EIF2A3K, HOX-1, SOD-2, and PTGS2/COX-2. NRF2 (a member of the Cap’n’Collar subfamily of the bZIP transcription factor family) play a vital role in the defense system against oxidative stress. NRF2 degradation was markedly inhibited by high levels of oxidative stress in the liver [84], heart [85], kidney [86] and brain [87] under ischemia-stress conditions. Activation of NRF2 induces the expression of heme oxygen-ase-1 (HOX-1), suggesting that NRF2 is essential for the regulation of HOX-1. NRF2/HOX-1 signaling cascade may be crucial in regulating inflammatory responses against oxidant stress-induced organ injury. Additionally, NRF2 is known to bind to antioxidant response element (ARE) in promoters of ATF3 resulting in up-regulated ATF3 transcript expression in astrocytes [88]. Both ATF3-T4 and ATF3-T5 siRNA did not suppress NRF2 related gene expression. ATF3-T4 siRNA further increased HOX-1 gene expression, suggesting that NRF2 signaling is up stream of ATF3. ATF3-T4 may constitute a negative feedback loop mechanism of NRF2 signaling. ATF3 may be a novel repressor of the NRF2-directed stress response pathway [89].
Inhibition with ATF3-T4 and ATF3-T5 siRNAs differentially regulate TL-induced pro-inflammatory gene expression. IL-8, IL-1 α, ICAM-1, IL-6, and CXCL-2 were significantly suppressed by ATF3-T4 siRNA. Additionally, secreted chemokine IL-8 protein expression was significantly increased but cytokines IL-6 and CCL-2/MCP-1 were reduced significantly by the TL treated HBMECs. IL-8 secretion was significantly reduced by pretreating with ATF3-T4 siRNA but not by pretreatment with ATF3-T5 siRNA, when compared to scrambled siRNA control. Pretreatment with ATF3-T4 siRNA and ATF3-T5 siRNA did not changed TL-induced IL-6 and CCL-2/MCP-1 secretion. In contrast, inhibiting with ATF3-T5 siRNA significantly further increased IL-1α and suppressed IL-6, but did not change IL-8, ICAM-1, and CXCL-2 gene expression. These data suggest that ATF3-T4 regulates pro-inflammatory MAPK signaling.
Mitochondrial apoptosis protein cleaved caspase-9 activity was significantly suppressed by inhibiting with ATF3-T4 siRNA, but not with ATF3-T5 siRNA. Once initiated, the mitochondrial apoptosis activation continues executing cell apoptosis caspase-3 activity. Our previous study showed that TL activate caspase-9 then initiate apoptosis directly by cleaving and thereby activating executioner caspase-3 to induce cell death. In this study, inhibition with either ATF3-T4 or ATF3-T5 siRNA significantly suppressed active caspase-3 and cleaved-PARP (poly(ADP-ribose) polymerase) activated by TL. Caspase-3 is primarily responsible for the cleavage of PARP in cell apoptosis process. Therefore, ATF3-T4 regulates mitochondrial apoptosis, and both ATF3-T4 and ATF3-T5 are responsible of cell apoptosis.
A summary of HBMEC responses to a 3 h exposure to TL with additional data concerning ATF3-T4 siRNA, ATF3-T5 siRNA and CPT1A1 siRNA treatments are presented in Table 7.
Table 7.
Summary of TGRL lipolysis products and ATF3 transcript variant 4 or 5 siRNA treatment in HBMECs
| Treatment | Response |
|---|---|
| TGRL Lipolysis Products |
mRNA expression Up-regulation of CHAC1, DDIT4, ATF3, DDIT3, JDP2, CCL20, CEBPB, CXCL3. Up-regulation of TNF signaling (CSF2, FOSL1, FOSL2, LIF, ATF4, SELE, NFKB1, NFKBIA, JUNB, JUN) Up-regulation of NRF2 signaling (EIF2A3K, NRF2, HIF1α, HOX-1, SOD-2, PTGS2/COX-2) Up-regulation of Inflammation (IL-8, IL1α, VEGFA, ICAM-1, HSPA6, GADD45A, IL-6, CXCL-2, ADAM-2, KLF4) Up-regulation of Transcript variant 4 and 5 of ATF3. Protein Expression Up-regulation of ATF3, ATF4, p-c-Jun, JDP2, JunB, CHAC1; TNFR1, DR5; NRF2, COX-2. Apotosis Increase Cleaved caspase-9, Active caspase-3, Cleaved PARP |
| ATF3-T4 siRNA + TGRL Lipolysis Products |
mRNA expression Up-regulation of CHAC1, JDP2, CEBPB; FOSL1; HOX-1. Down-Regulation of CCL20; CSF2, SELE; NRF2, COX-2; IL-8, IL-1α, ICAM-1, IL-6, CXCL-2. Protein Expression Up-regulation of ATF4, JDP2, CHAC1, TNFR1. Down-Regulation of JunB, DR5, NRF2, EIF2α, PTGS2/COX-2. Apotosis Decrease Cleaved caspase-9, Active caspase-3; No change of Cleaved PARP; Increased p53. |
| ATF3-T5 siRNA + TGRL Lipolysis Products |
mRNA expression Up-regulation of FOSL1, FOSL2, JunB, Jun; HOX-1; IL-1α. Down-Regulation of CHAC1; COX-2; IL-6. Protein Expression Up-regulation of ATF4, p-c-Jun. Down-Regulation of JunB, CHAC1, DR5, TNFR1, NRF2, EIF2α, COX-2. Apotosis Increased Cleaved caspase-9; Decreased Active caspase-3, Cleaved PARP, p53. |
| CPT1A1 siRNA + TGRL Lipolysis Products |
mRNA expression Down-Regulation of NRF2 signaling (EIF2A3K, NRF2, HIF1a, HOX-1, PTGS2/COX-2) Down-regulation of Transcript variant 4 and 5 of ATF3. Down-Regulation of Inflammation (IL-8, SELE/E-Selectin) No Change SOD-2 and IL-6 |
CONCLUSION
We conclude that TGRL lipolysis products (TL) potentiate ROS in mitochondria, and decrease mitochondrial copy number, activating mitochondrial oxidative stress that decreases ATP production, resulting in an increase of mitochondrial proton leak and glycolysis rate, and activating ATF3-MAPKinase signaling along with the TNF signaling pathway at 3h. Increased cellular damage and injury could be prevented by inhibiting β-oxidation with CPT1A1 siRNA. Neutral lipid, cholesteryl esters and triacylglycerols lipid deposition are increased in HBMECs with TL. The NRF2 signaling pathway is regulated through the mitochondrial oxidative stress response and is up stream of the ATF3-MAPKinase signaling pathway. TNF signaling is controlled by ATF3-T4. Furthermore, the ATF3-T4 transcript variant predominantly regulates the TL-induced inflammation. Interestingly, siRNAs of both transcript variants ATF3-T4 and ATF3-T5, suppressed cell apoptosis and lipotoxic brain microvascular endothelial cells injury. We are first to report the differential characteristics of pro-inflammatory gene expression by transcript variants 4 and 5 of the stress responsive transcription factor ATF3 in HBMECs induced by TL. Our data demonstrate that the ATF3 transcript variants (ATF3-T4 and ATF3-T5) play a major role in regulating the inflammatory response genes and signaling pathways in TGRL lipolysis products-induced brain microvascular inflammation.
Highlights.
Postprandial triglyceride-rich lipoproteins (TGRL) lipolysis products potentiate ROS by mitochondria which activate mitochondrial oxidative stress, decrease ATP production, increase mitochondrial proton leak and glycolysis rate, and mitochondria DNA damage in human brain microvascular endothelial cells (HBMECs).
Inhibiting the FA β-oxidation with CPT1A1 siRNA can prevent TL-induced mitochondrial dysfunction and vascular inflammation in HBMECs.
Postprandial lipolysis products induced transcript variants 4 (ATF3-T4) and 5 (ATF3-T5) of activating transcription factor 3 (ATF3), which differentially induced the pro-inflammatory gene expression in HBMECs.
Postprandial lipolysis products activate ATF3-MAPKinase signaling along with NRF2 and and TNF signaling pathways in HBMECs
ATF3-T4 and ATF3-T5 siRNAs decrease the apoptosis and suppress the inflammation induced by postprandial lipolysis products in HBMECs.
ACKNOWLEDGMENTS
The authors would like to thank the human subjects who donated blood for these studies, as well as the staff of the Ragle Human Nutrition Center at the University of California, Davis for donating their valuable time and expertise to this study. We would like to thank Dr. Kishorchandra Gohil, Division of Pulmonary and Critical Care Medicine, UC Davis, for valuable suggestion to the manuscript and Dr. JoAnne Engebrecht, Molecular & Cellular Biology at UC Davis for allowing us to use the DeltaVision Ultra High Resolution Microscope. We also thank Brian Bussolini and Jestine Ho (Agilent) for the Seahorse XF machine loaned to us.
Funding Sources
This work was supported by the NIH-NIA AG045541, NIH-NIA AG039094, the Richard A. and Nora Eccles Harrison Endowed Chair in Diabetes Research (to J.C.R.), U24 DK092993 (to Kent Lloyd), Packer Wizard Foundation (to H.H. A), and GM103860-S1 (J. E). J.C.R. was partially funded through Grant U24 DK092993, which was awarded to Kent Lloyd. Kent Lloyd did not contribute to this manuscript.
ABBREVIATIONS
- T or TGRL
triglyceride-rich lipoproteins
- L
Lipoprotein lipase
- TL
TGRL lipolysis products
- FAs
fatty acids
- FFAs
free fatty acids
- VaD
vascular dementia
- HBMECs
human brain microvascular endothelial cells
- ATF3
activating transcription factor 3
- ATF3-T4
ATF3 transcript variants 4
- ATF3-T5
ATF3 transcript variants 5
- HTS
high-throughput sequencing technologies
- RNA-Seq
RNA sequencing
- AD
Alzheimer’s disease
- WD
Western diet
- ROS
reactive oxygen species
- O2•−
superoxide radical
- CNS
Central nervous system
- MAPK
mitogen-activated protein kinases
- AP-1
activator protein (AP-1)
- GAPDH
glyceraldehyde-3-phosphate dehydrogenase
- (MIP)-1α
macrophage inflammatory protein 1α
- MCP-1
monocyte chemoattractant protein 1
- OCR
Oxygen consumption rates
- ECAR
extracellular acidification rates
- CHAC-1
glutathione-specific gamma-glutamylcyclotransferase 1
- JDP2
Jun dimerization protein 2
- CSF2
colony stimulating factor 2
- FOSL1
FOS like 1
- NRF2
nuclear factor erythroid-derived 2-related factor 2
- DR5
death receptor 5
- TNFRSF10B
tumor necrosis factor receptor superfamily member 10B
- TRAIL-R2
TNF-related apoptosis-inducing ligand receptor-2
- eIF2α
eukaryotic Initiation Factor 2-alpha
- TCA
tricarboxylic acid
- OxLDL
oxidized low-density lipoprotein
- TNFα
tumor necrosis factor α
- mtDNA
mitochondria DNA
- nDNA
nuclear DNA
- mtND1
mitochondrially encoded NADH dehydrogenase 1
- mt-CO1
mitochondrially encoded Cytochrome C Oxidase I
- mt-Cyb
mitochondrially encoded Cytochrome B
- CP-H
1-hydroxy-3-carboxy-2,2,5,5-tetramethylpyrrolidine
- EPR
Electron Paramagnetic Resonance
Footnotes
Disclosures
The authors have no conflicts of interest.
Publisher's Disclaimer: This is a PDF file of an unedited manuscript that has been accepted for publication. As a service to our customers we are providing this early version of the manuscript. The manuscript will undergo copyediting, typesetting, and review of the resulting proof before it is published in its final citable form. Please note that during the production process errors may be discovered which could affect the content, and all legal disclaimers that apply to the journal pertain.
REFERENCES
- [1].Alzheimer’s Association, 2018 Alzheimer’s Disease Facts and Figures, Alzheimers Dement. 14 (2018) 367–429. [Google Scholar]
- [2].Craft S, The role of metabolic disorders in Alzheimer disease and vascular dementia: two roads converged, Arch Neurol 66 (2009) 300–305. [DOI] [PMC free article] [PubMed] [Google Scholar]
- [3].Grammas P, Neurovascular dysfunction, inflammation and endothelial activation: implications for the pathogenesis of Alzheimer’s disease, J Neuroinflammation 8 (2011) 26. [DOI] [PMC free article] [PubMed] [Google Scholar]
- [4].Goldwaser EL, Acharya NK, Nagele RG, Cerebrovascular and Blood-Brain Barrier Compromise: A Mechanistic Link between Vascular Disease and Alzheimer’s Disease Subtypes of Neurocognitive Disorders, J Parkinsons Dis Alzheimer Dis. 2 (2015) 10. [Google Scholar]
- [5].Hildreth KL, Van Pelt RE, Schwartz RS, Obesity, insulin resistance, and Alzheimer’s disease, Obesity (Silver Spring) 20 (2012) 1549–1557. [DOI] [PMC free article] [PubMed] [Google Scholar]
- [6].Graham LC, Harder JM, Soto I, de Vries WN, John SW, Howell GR, Chronic consumption of a western diet induces robust glial activation in aging mice and in a mouse model of Alzheimer’s disease, Sci Rep 6 (2016) 21568. [DOI] [PMC free article] [PubMed] [Google Scholar]
- [7].Knight A, Bryan J, Murphy K, Is the Mediterranean diet a feasible approach to preserving cognitive function and reducing risk of dementia for older adults in Western countries? New insights and future directions, Ageing Res Rev 25 (2016) 85–101. [DOI] [PubMed] [Google Scholar]
- [8].Burgess BL, McIsaac SA, Naus KE, Chan JY, Tansley GH, Yang J, Miao F, Ross CJ, van Eck M, Hayden MR, van Nostrand W, St George-Hyslop P, Westaway D, Wellington CL, Elevated plasma triglyceride levels precede amyloid deposition in Alzheimer’s disease mouse models with abundant A beta in plasma, Neurobiol Dis 24 (2006) 114–127. [DOI] [PubMed] [Google Scholar]
- [9].Ng KF, Anderson S, Mayo P, Aung HH, Walton JH, Rutledge JC, Characterizing blood-brain barrier perturbations after exposure to human triglyceride-rich lipoprotein lipolysis products using MRI in a rat model, Magn Reson Med 76 (2016) 1246–1251. [DOI] [PMC free article] [PubMed] [Google Scholar]
- [10].Pallebage-Gamarallage MM, Lam V, Takechi R, Galloway S, Mamo JC, A diet enriched in docosahexanoic Acid exacerbates brain parenchymal extravasation of apo B lipoproteins induced by chronic ingestion of saturated fats, Int J Vasc Med 2012 (2012) 647689. [DOI] [PMC free article] [PubMed] [Google Scholar]
- [11].Altman R, Rutledge JC, The vascular contribution to Alzheimer’s disease, Clin Sci (Lond) 119 (2010) 407–421. [DOI] [PMC free article] [PubMed] [Google Scholar]
- [12].Aung HH, Lame MW, Gohil K, An CI, Wilson DW, Rutledge JC, Induction of ATF3 gene network by triglyceride-rich lipoprotein lipolysis products increases vascular apoptosis and inflammation, Arterioscler Thromb Vasc Biol 33 (2013) 2088–2096. [DOI] [PMC free article] [PubMed] [Google Scholar]
- [13].Eiselein L, Wilson DW, Lame MW, Rutledge JC, Lipolysis products from triglyceride-rich lipoproteins increase endothelial permeability, perturb zonula occludens-1 and F-actin, and induce apoptosis, Am J Physiol Heart Circ Physiol 292 (2007) H2745–2753. [DOI] [PubMed] [Google Scholar]
- [14].Aung HH, Tsoukalas A, Rutledge JC, Tagkopoulos I, A systems biology analysis of brain microvascular endothelial cell lipotoxicity, BMC Syst Biol 8 (2014) 80. [DOI] [PMC free article] [PubMed] [Google Scholar]
- [15].Aung HH, Altman R, Nyunt T, Kim J, Nuthikattu S, Budamagunta M, Voss JC, Wilson D, Rutledge JC, Villablanca AC, Lipotoxic brain microvascular injury is mediated by activating transcription factor 3-dependent inflammatory and oxidative stress pathways, J Lipid Res 57 (2016) 955–968. [DOI] [PMC free article] [PubMed] [Google Scholar]
- [16].Wang L, Gill R, Pedersen TL, Higgins LJ, Newman JW, Rutledge JC, Triglyceride-rich lipoprotein lipolysis releases neutral and oxidized FFAs that induce endothelial cell inflammation, J Lipid Res 50 (2009) 204–213. [DOI] [PMC free article] [PubMed] [Google Scholar]
- [17].Wang L, Sapuri-Butti AR, Aung HH, Parikh AN, Rutledge JC, Triglyceride-rich lipoprotein lipolysis increases aggregation of endothelial cell membrane microdomains and produces reactive oxygen species, Am J Physiol Heart Circ Physiol 295 (2008) H237–244. [DOI] [PMC free article] [PubMed] [Google Scholar]
- [18].Eiselein L, Nyunt T, Lame MW, Ng KF, Wilson DW, Rutledge JC, Aung HH, TGRL Lipolysis Products Induce Stress Protein ATF3 via the TGF-beta Receptor Pathway in Human Aortic Endothelial Cells, PLoS One 10 (2015) e0145523. [DOI] [PMC free article] [PubMed] [Google Scholar]
- [19].Kalai T, Petrlova J, Balog M, Aung HH, Voss JC, Hideg K, Synthesis and study of 2-amino-7-bromofluorenes modified with nitroxides and their precursors as dual anti-amyloid and antioxidant active compounds, Eur J Med Chem 46 (2011) 1348–1355. [DOI] [PMC free article] [PubMed] [Google Scholar]
- [20].Lee LL, Aung HH, Wilson DW, Anderson SE, Rutledge JC, Rutkowsky JM, Triglyceride-rich lipoprotein lipolysis products increase blood-brain barrier transfer coefficient and induce astrocyte lipid droplets and cell stress, Am J Physiol Cell Physiol 312 (2017) C500–C516. [DOI] [PMC free article] [PubMed] [Google Scholar]
- [21].Rutkowsky JM, Lee LL, Puchowicz M, Golub MS, Befroy DE, Wilson DW, Anderson S, Cline G, Bini J, Borkowski K, Knotts TA, Rutledge JC, Mouse G Metabolic Phenotyping Center Imaging Working, Reduced cognitive function, increased blood-brain-barrier transport and inflammatory responses, and altered brain metabolites in LDLr −/−and C57BL/6 mice fed a western diet, PLoS One 13 (2018) e0191909. [DOI] [PMC free article] [PubMed] [Google Scholar]
- [22].Borgesius NZ, de Waard MC, van der Pluijm I, Omrani A, Zondag GC, van der Horst GT, Melton DW, Hoeijmakers JH, Jaarsma D, Elgersma Y, Accelerated age-related cognitive decline and neurodegeneration, caused by deficient DNA repair, J Neurosci 31 (2011) 12543–12553. [DOI] [PMC free article] [PubMed] [Google Scholar]
- [23].Chen BP, Wolfgang CD, Hai T, Analysis of ATF3, a transcription factor induced by physiological stresses and modulated by gadd153/Chop10, Mol Cell Biol 16 (1996) 1157–1168. [DOI] [PMC free article] [PubMed] [Google Scholar]
- [24].Pernhorst K, Herms S, Hoffmann P, Cichon S, Schulz H, Sander T, Schoch S, Becker AJ, Grote A, TLR4, ATF-3 and IL8 inflammation mediator expression correlates with seizure frequency in human epileptic brain tissue, Seizure 22 (2013) 675–678. [DOI] [PubMed] [Google Scholar]
- [25].Tsujino H, Kondo E, Fukuoka T, Dai Y, Tokunaga A, Miki K, Yonenobu K, Ochi T, Noguchi K, Activating transcription factor 3 (ATF3) induction by axotomy in sensory and motoneurons: A novel neuronal marker of nerve injury, Mol Cell Neurosci 15 (2000) 170–182. [DOI] [PubMed] [Google Scholar]
- [26].Isacsson A, Kanje M, Dahlin LB, Induction of activating transcription factor 3 (ATF3) by peripheral nerve compression, Scand J Plast Reconstr Surg Hand Surg 39 (2005) 65–72. [DOI] [PubMed] [Google Scholar]
- [27].Hunt D, Hossain-Ibrahim K, Mason MR, Coffin RS, Lieberman AR, Winterbottom J, Anderson PN, ATF3 upregulation in glia during Wallerian degeneration: differential expression in peripheral nerves and CNS white matter, BMC Neurosci 5 (2004) 9. [DOI] [PMC free article] [PubMed] [Google Scholar]
- [28].Hunt D, Raivich G, Anderson PN, Activating transcription factor 3 and the nervous system, Front Mol Neurosci 5 (2012) 7. [DOI] [PMC free article] [PubMed] [Google Scholar]
- [29].Pai CS, Sharma PK, Huang HT, Loganathan S, Lin H, Hsu YL, Phasuk S, Liu IY, The Activating Transcription Factor 3 (Atf3) Homozygous Knockout Mice Exhibit Enhanced Conditioned Fear and Down Regulation of Hippocampal GELSOLIN, Front Mol Neurosci 11 (2018) 37. [DOI] [PMC free article] [PubMed] [Google Scholar]
- [30].Yahiatene I, Aung HH, Wilson DW, Rutledge JC, Single-molecule quantification of lipotoxic expression of activating transcription factor 3, Phys Chem Chem Phys 16 (2014) 21595–21601. [DOI] [PMC free article] [PubMed] [Google Scholar]
- [31].Andrews S, FastQC A Quality Control tool for High Throughput Sequence Data.
- [32].Joshi N, Fass J, Sickle: A sliding-window, adaptive, quality-based trimming tool for FastQ files (Version 1.33) [Software], (2011).
- [33].Buffalo V, Fass J, Scythe: A very simple adapter trimmer [Software], (2011).
- [34].Harrow J, Frankish A, Gonzalez JM, Tapanari E, Diekhans M, Kokocinski F, Aken BL, Barrell D, Zadissa A, Searle S, Barnes I, Bignell A, Boychenko V, Hunt T, Kay M, Mukherjee G, Rajan J, Despacio-Reyes G, Saunders G, Steward C, Harte R, Lin M, Howald C, Tanzer A, Derrien T, Chrast J, Walters N, Balasubramanian S, Pei B, Tress M, Rodriguez JM, Ezkurdia I, van Baren J, Brent M, Haussler D, Kellis M, Valencia A, Reymond A, Gerstein M, Guigo R, Hubbard TJ, GENCODE: the reference human genome annotation for The ENCODE Project, Genome Res 22 (2012) 1760–1774. [DOI] [PMC free article] [PubMed] [Google Scholar]
- [35].Kim D, Pertea G, Trapnell C, Pimentel H, Kelley R, Salzberg SL, TopHat2: accurate alignment of transcriptomes in the presence of insertions, deletions and gene fusions, Genome Biol 14 (2013) R36. [DOI] [PMC free article] [PubMed] [Google Scholar]
- [36].Anders S, Pyl PT, Huber W, HTSeq--a Python framework to work with high-throughput sequencing data, Bioinformatics 31 (2015) 166–169. [DOI] [PMC free article] [PubMed] [Google Scholar]
- [37].Ritchie ME, Phipson B, Wu D, Hu Y, Law CW, Shi W, Smyth GK, limma powers differential expression analyses for RNA-sequencing and microarray studies, Nucleic Acids Res 43 (2015) e47. [DOI] [PMC free article] [PubMed] [Google Scholar]
- [38].Smyth GK, Linear models and empirical bayes methods for assessing differential expression in microarray experiments, Stat Appl Genet Mol Biol 3 (2004) Article3. [DOI] [PubMed] [Google Scholar]
- [39].Benjamini Y, Y. H, Controlling the false discovery rate: a practical and powerful approach to multiple testing, ournal of the Royal Statistical Society. Series B (Methodological) 57 (1995) 289–300. [Google Scholar]
- [40].Wanichthanarak K, Fahrmann JF, Grapov D, Genomic, Proteomic, and Metabolomic Data Integration Strategies, Biomark Insights 10 (2015) 1–6. [DOI] [PMC free article] [PubMed] [Google Scholar]
- [41].Kanehisa M, Goto S, Sato Y, Kawashima M, Furumichi M, Tanabe M, Data, information, knowledge and principle: back to metabolism in KEGG, Nucleic Acids Res 42 (2014) D199–205. [DOI] [PMC free article] [PubMed] [Google Scholar]
- [42].Croft D, Mundo AF, Haw R, Milacic M, Weiser J, Wu G, Caudy M, Garapati P, Gillespie M, Kamdar MR, Jassal B, Jupe S, Matthews L, May B, Palatnik S, Rothfels K, Shamovsky V, Song H, Williams M, Birney E, Hermjakob H, Stein L, D’Eustachio P, The Reactome pathway knowledgebase, Nucleic Acids Res 42 (2014) D472–477. [DOI] [PMC free article] [PubMed] [Google Scholar]
- [43].Jewison T, Su Y, Disfany FM, Liang Y, Knox C, Maciejewski A, Poelzer J, Huynh J, Zhou Y, Arndt D, Djoumbou Y, Liu Y, Deng L, Guo AC, Han B, Pon A, Wilson M, Rafatnia S, Liu P, Wishart DS, SMPDB 2.0: big improvements to the Small Molecule Pathway Database, Nucleic Acids Res 42 (2014) D478–484. [DOI] [PMC free article] [PubMed] [Google Scholar]
- [44].Varemo L, Nielsen J, Nookaew I, Enriching the gene set analysis of genome-wide data by incorporating directionality of gene expression and combining statistical hypotheses and methods, Nucleic Acids Res 41 (2013) 4378–4391. [DOI] [PMC free article] [PubMed] [Google Scholar]
- [45].Livak KJ, Schmittgen TD, Analysis of relative gene expression data using real-time quantitative PCR and the 2(-Delta Delta C(T)) Method, Methods 25 (2001) 402–408. [DOI] [PubMed] [Google Scholar]
- [46].Tanner MJ, Wang J, Ying R, Suboc TB, Malik M, Couillard A, Branum A, Puppala V, Widlansky ME, Dynamin-related protein 1 mediates low glucose-induced endothelial dysfunction in human arterioles, Am J Physiol Heart Circ Physiol 312 (2017) H515–H527. [DOI] [PMC free article] [PubMed] [Google Scholar]
- [47].Paull D, Emmanuele V, Weiss KA, Treff N, Stewart L, Hua H, Zimmer M, Kahler DJ, Goland RS, Noggle SA, Prosser R, Hirano M, Sauer MV, Egli D, Nuclear genome transfer in human oocytes eliminates mitochondrial DNA variants, Nature 493 (2013) 632–637. [DOI] [PMC free article] [PubMed] [Google Scholar]
- [48].Mei H, Sun S, Bai Y, Chen Y, Chai R, Li H, Reduced mtDNA copy number increases the sensitivity of tumor cells to chemotherapeutic drugs, Cell Death Dis 6 (2015) e1710. [DOI] [PMC free article] [PubMed] [Google Scholar]
- [49].Dikalov SI, Kirilyuk IA, Voinov M, Grigor’ev IA, EPR detection of cellular and mitochondrial superoxide using cyclic hydroxylamines, Free Radic Res 45 (2011) 417–430. [DOI] [PMC free article] [PubMed] [Google Scholar]
- [50].Aquilano K, Baldelli S, Ciriolo MR, Glutathione: new roles in redox signaling for an old antioxidant, Front Pharmacol 5 (2014) 196. [DOI] [PMC free article] [PubMed] [Google Scholar]
- [51].Crawford RR, Prescott ET, Sylvester CF, Higdon AN, Shan J, Kilberg MS, Mungrue IN, Human CHAC1 Protein Degrades Glutathione, and mRNA Induction Is Regulated by the Transcription Factors ATF4 and ATF3 and a Bipartite ATF/CRE Regulatory Element, J Biol Chem 290 (2015) 15878–15891. [DOI] [PMC free article] [PubMed] [Google Scholar]
- [52].Calicchio R, Buffat C, Mathieu JR, Ben Salem N, Mehats C, Jacques S, Hertig A, Berkane N, Grevoul-Fresquet J, Simeoni U, Peyssonnaux C, Gavard J, Vaiman D, Miralles F, Preeclamptic plasma induces transcription modifications involving the AP-1 transcriptional regulator JDP2 in endothelial cells, Am J Pathol 183 (2013) 1993–2006. [DOI] [PubMed] [Google Scholar]
- [53].Jin C, Kato K, Chimura T, Yamasaki T, Nakade K, Murata T, Li H, Pan J, Zhao M, Sun K, Chiu R, Ito T, Nagata K, Horikoshi M, Yokoyama KK, Regulation of histone acetylation and nucleosome assembly by transcription factor JDP2, Nat Struct Mol Biol 13 (2006) 331–338. [DOI] [PubMed] [Google Scholar]
- [54].Katz S, Aronheim A, Differential targeting of the stress mitogen-activated protein kinases to the c-Jun dimerization protein 2, Biochem J 368 (2002) 939–945. [DOI] [PMC free article] [PubMed] [Google Scholar]
- [55].Litalien C, Beaulieu P, Molecular Mechanisms of Drug Actions: From Receptors to Effectors, in: Fuhrman BP, Zimmerman JJ (Eds.), Pediatric Critical Care, Elsevier Saunders, Philadelphia, PA, 2011, pp. 1553–1568. [Google Scholar]
- [56].Bustos M, Coffman TM, Saadi S, Platt JL, Modulation of eicosanoid metabolism in endothelial cells in a xenograft model. Role of cyclooxygenase-2, J Clin Invest 100 (1997) 1150–1158. [DOI] [PMC free article] [PubMed] [Google Scholar]
- [57].Okahara K, Sun B, Kambayashi J, Upregulation of prostacyclin synthesis-related gene expression by shear stress in vascular endothelial cells, Arterioscler Thromb Vasc Biol 18 (1998) 1922–1926. [DOI] [PubMed] [Google Scholar]
- [58].Takarada T, Kou M, Hida M, Fukumori R, Nakamura S, Kutsukake T, Kuramoto N, Hinoi E, Yoneda Y, Protective upregulation of activating transcription factor-3 against glutamate neurotoxicity in neuronal cells under ischemia, J Neurosci Res 94 (2016) 378–388. [DOI] [PubMed] [Google Scholar]
- [59].Murphy MP, How mitochondria produce reactive oxygen species, Biochem J 417 (2009) 1–13. [DOI] [PMC free article] [PubMed] [Google Scholar]
- [60].Turrens JF, Mitochondrial formation of reactive oxygen species, J Physiol 552 (2003) 335–344. [DOI] [PMC free article] [PubMed] [Google Scholar]
- [61].Bhatti JS, Bhatti GK, Reddy PH, Mitochondrial dysfunction and oxidative stress in metabolic disorders - A step towards mitochondria based therapeutic strategies, Biochim Biophys Acta 1863 (2017) 1066–1077. [DOI] [PMC free article] [PubMed] [Google Scholar]
- [62].Liemburg-Apers DC, Willems PHGM, Koopman WJH, Grefte S, Interactions between mitochondrial reactive oxygen species and cellular glucose metabolism, Arch Toxicol. 89 (2015) 1209–1226. [DOI] [PMC free article] [PubMed] [Google Scholar]
- [63].Wang J, Alexanian A, Ying R, Kizhakekuttu TJ, Dharmashankar K, Vasquez-Vivar J, Gutterman DD, Widlansky ME, Acute exposure to low glucose rapidly induces endothelial dysfunction and mitochondrial oxidative stress: role for AMP kinase, Arterioscler Thromb Vasc Biol 32 (2012) 712–720. [DOI] [PMC free article] [PubMed] [Google Scholar]
- [64].Kizhakekuttu TJ, Wang J, Dharmashankar K, Ying R, Gutterman DD, Vita JA, Widlansky ME, Adverse alterations in mitochondrial function contribute to type 2 diabetes mellitus-related endothelial dysfunction in humans, Arterioscler Thromb Vasc Biol 32 (2012) 2531–2539. [DOI] [PMC free article] [PubMed] [Google Scholar]
- [65].Riemann A, Schneider B, Ihling A, Nowak M, Sauvant C, Thews O, Gekle M, Acidic environment leads to ROS-induced MAPK signaling in cancer cells, PLoS One 6 (2011) e22445. [DOI] [PMC free article] [PubMed] [Google Scholar]
- [66].Teixeira J, Basit F, Swarts HG, Forkink M, Oliveira PJ, Willems P, Koopman WJH, Extracellular acidification induces ROS- and mPTP-mediated death in HEK293 cells, Redox Biol 15 (2018) 394–404. [DOI] [PMC free article] [PubMed] [Google Scholar]
- [67].Genders AJ, Martin SD, McGee SL, Bishop DJ, A physiological drop in pH decreases mitochondrial respiration, and HDAC and Akt signaling, in L6 myocytes, Am J Physiol Cell Physiol 316 (2019) C404–C414. [DOI] [PubMed] [Google Scholar]
- [68].Fowler SD, Greenspan P, Application of Nile red, a fluorescent hydrophobic probe, for the detection of neutral lipid deposits in tissue sections: comparison with oil red O, J Histochem Cytochem 33 (1985) 833–836. [DOI] [PubMed] [Google Scholar]
- [69].Ramsay RR, Arduini A, The carnitine acyltransferases and their role in modulating acyl-CoA pools, Arch Biochem Biophys 302 (1993) 307–314. [DOI] [PubMed] [Google Scholar]
- [70].Sebastián D, Guitart M, García-Martínez C, Mauvezin C, Orellana-Gavaldà JM, Serra D, Gómez-Foix AM, Hegardt FG, Asins G, Novel role of FATP1 in mitochondrial fatty acid oxidation in skeletal muscle cells, J Lipid Res. 50 (2009) 1789–1799. [DOI] [PMC free article] [PubMed] [Google Scholar]
- [71].Serra D, Mera P, Malandrino MI, Mir JF, Herrero L, Mitochondrial fatty acid oxidation in obesity, Antioxid Redox Signal 19 (2013) 269–284. [DOI] [PMC free article] [PubMed] [Google Scholar]
- [72].Kudin AP, Malinska D, Kunz WS, Sites of generation of reactive oxygen species in homogenates of brain tissue determined with the use of respiratory substrates and inhibitors, Biochim Biophys Acta 1777 (2008) 689–695. [DOI] [PubMed] [Google Scholar]
- [73].Longo N, Frigeni M, M. P, Carnitine transport and fatty acid oxidation, Biochim Biophys Acta 1863 (2016) 2422–2435. [DOI] [PMC free article] [PubMed] [Google Scholar]
- [74].Nawa T, Nawa MT, Adachi MT, Uchimura I, Shimokawa R, Fujisawa K, Tanaka A, Numano F, Kitajima S, Expression of transcriptional repressor ATF3/LRF1 in human atherosclerosis: colocalization and possible involvement in cell death of vascular endothelial cells, Atherosclerosis 161 (2002) 281–291. [DOI] [PubMed] [Google Scholar]
- [75].Kawauchi J, Zhang C, Nobori K, Hashimoto Y, Adachi MT, Noda A, Sunamori M, Kitajima S, Transcriptional repressor activating transcription factor 3 protects human umbilical vein endothelial cells from tumor necrosis factor-alpha-induced apoptosis through down-regulation of p53 transcription, J Biol Chem 277 (2002) 39025–39034. [DOI] [PubMed] [Google Scholar]
- [76].Cai Y, Zhang C, Nawa T, Aso T, Tanaka M, Oshiro S, Ichijo H, Kitajima S, Homocysteine-responsive ATF3 gene expression in human vascular endothelial cells: activation of c-Jun NH(2)-terminal kinase and promoter response element, Blood 96 (2000) 2140–2148. [PubMed] [Google Scholar]
- [77].van Hinsbergh VW, Kooistra T, van den Berg EA, Princen HM, Fiers W, Emeis JJ, Tumor necrosis factor increases the production of plasminogen activator inhibitor in human endothelial cells in vitro and in rats in vivo, Blood 72 (1988) 1467–1473. [PubMed] [Google Scholar]
- [78].Hallenbeck JM, The many faces of tumor necrosis factor in stroke, Nat Med 8 (2002) 1363–1368. [DOI] [PubMed] [Google Scholar]
- [79].Hu C, Meng X, Huang C, Shen C, Li J, Frontline Science: ATF3 is responsible for the inhibition of TNF-alpha release and the impaired migration of acute ethanol-exposed monocytes and macrophages, J Leukoc Biol 101 (2017) 633–642. [DOI] [PubMed] [Google Scholar]
- [80].Sly LM, Krzesicki RF, Brashler JR, Buhl AE, McKinley DD, Carter DB, Chin JE, Endogenous brain cytokine mRNA and inflammatory responses to lipopolysaccharide are elevated in the Tg2576 transgenic mouse model of Alzheimer’s disease, Brain Res Bull 56 (2001) 581–588. [DOI] [PubMed] [Google Scholar]
- [81].Lourenco MV, Clarke JR, Frozza RL, Bomfim TR, Forny-Germano L, Batista AF, Sathler LB, Brito-Moreira J, Amaral OB, Silva CA, Freitas-Correa L, Espirito-Santo S, Campello-Costa P, Houzel JC, Klein WL, Holscher C, Carvalheira JB, Silva AM, Velloso LA, Munoz DP, Ferreira ST, De Felice FG, TNF-alpha mediates PKR-dependent memory impairment and brain IRS-1 inhibition induced by Alzheimer’s beta-amyloid oligomers in mice and monkeys, Cell Metab 18 (2013) 831–843. [DOI] [PubMed] [Google Scholar]
- [82].Alvarez A, Cacabelos R, Sanpedro C, Garcia-Fantini M, Aleixandre M, Serum TNF-alpha levels are increased and correlate negatively with free IGF-I in Alzheimer disease, Neurobiol Aging 28 (2007) 533–536. [DOI] [PubMed] [Google Scholar]
- [83].Chang R, Yee KL, Sumbria RK, Tumor necrosis factor alpha Inhibition for Alzheimer’s Disease, J Cent Nerv Syst Dis 9 (2017) 1179573517709278. [DOI] [PMC free article] [PubMed] [Google Scholar]
- [84].Ke B, Shen XD, Zhang Y, Ji H, Gao F, Yue S, Kamo N, Zhai Y, Yamamoto M, Busuttil RW, Kupiec-Weglinski JW, KEAP1-NRF2 complex in ischemia-induced hepatocellular damage of mouse liver transplants, J Hepatol 59 (2013) 1200–1207. [DOI] [PMC free article] [PubMed] [Google Scholar]
- [85].Deng C, Sun Z, Tong G, Yi W, Ma L, Zhao B, Cheng L, Zhang J, Cao F, Yi D, alpha-Lipoic acid reduces infarct size and preserves cardiac function in rat myocardial ischemia/reperfusion injury through activation of PI3K/Akt/Nrf2 pathway, PLoS One 8 (2013) e58371. [DOI] [PMC free article] [PubMed] [Google Scholar]
- [86].Shelton LM, Park BK, Copple IM, Role of Nrf2 in protection against acute kidney injury, Kidney Int 84 (2013) 1090–1095. [DOI] [PubMed] [Google Scholar]
- [87].Porritt MJ, Andersson HC, Hou L, Nilsson A, Pekna M, Pekny M, Nilsson M, Photothrombosis-induced infarction of the mouse cerebral cortex is not affected by the Nrf2-activator sulforaphane, PLoS One 7 (2012) e41090. [DOI] [PMC free article] [PubMed] [Google Scholar]
- [88].Kim KH, Jeong JY, Surh YJ, Kim KW, Expression of stress-response ATF3 is mediated by Nrf2 in astrocytes, Nucleic Acids Res 38 (2010) 48–59. [DOI] [PMC free article] [PubMed] [Google Scholar]
- [89].Brown SL, Sekhar KR, Rachakonda G, Sasi S, Freeman ML, Activating transcription factor 3 is a novel repressor of the nuclear factor erythroid-derived 2-related factor 2 (Nrf2)-regulated stress pathway, Cancer Res 68 (2008) 364–368. [DOI] [PubMed] [Google Scholar]


