Abstract
We described an immunoassay for the cardiac marker myoglobin on a thin silver mirror surface using surface plasmon-coupled emission (SPCE). SPCE occurs for fluorophores in proximity (within ~200 nm) of a thin metal film (in our case, silver) and results in a highly directional radiation through a glass substrate at a well-defined angle from the normal axis. We used the effect of SPCE to develop a myoglobin immunoassay on the silver mirror surface deposited on a glass substrate. Binding of the labeled anti-myoglobin antibodies led to the enhanced fluorescence emission at a specific angle of 72°. The directional and enhanced directional fluorescence emission enables detection of myoglobin over a wide range of concentrations from subnormal to the elevated level of this cardiac marker. Utilizing SPCE allowed us also to demonstrate significant background suppression (from serum or whole blood) in the myoglobin immunoassay. We expect SPCE to become a powerful technique for performing immunoassays for many biomarkers in surface-bound assays.
Acute myocardial infarction (AMI) represents the most serious form of cardiovascular diseases, which are the one of the leading causes of mortality in western (developed) countries. Using of various cardiac markers for early diagnostics of AMI is currently actively debated.1–5 Most authors recommend use of a combination of several markers (such as myoglobin (Myo), CK-MB, troponin I, or troponin T), instead of relying on a single marker, and repeating the serum marker testing during several hours after the disease symptom.1,6–9 Cardiac markers have become an important tool in diagnostics, and Myo, although not cardiac specific, is one of the very early markers to increase after acute myocardial infarction.8,10–14 It is important to reliably and quickly detect possibly low concentrations of markers.
Immunoassay based on fluorescence detection is one approach to high sensitivity detection of biomarkers.15–19 Different fluorescence detection approaches include polarization,20–24 resonance energy transfer,25–27 and time-resolved “gated” assays based on long-lived lanthanide emission.28–31 Currently, new approaches to fluorescence immunoassays are being developed, including multiphoton excitation,32–34 with the emphasis on high-throughput immunoassays.35–38
Sensitivity of the fluoroimmunoassays is typically limited by the background fluorescence, which is present in most biological samples, and in the optical elements of the instrumentation. In the present report, we describe a new format for a cardiac marker immunoassay that provides increased sensitivity and background rejection by efficient light collection of emission occurring near the bioaffinity surface.
Our approach is based on the resonance coupling of excited fluorophores with electron oscillations in a thin metal (typically, silver or gold) film. These oscillations are called surface plasmons. Excited fluorophores within ~200 nm of a thin film induce the plasmons, which in turn radiate in the glass substrate.39,40 This radiation occurs at a sharply defined angle and is almost completely p-polarized. This phenomenon is called surface plasmon-coupled emission (SPCE). SPCE is closely related to surface plasmon resonance (SPR).39 The optical properties of surface plasmons and the applications of SPR to measurement of bioaffinity reactions have been described in detail.41–45 Surface plasmons cannot be excited from air by incident light, SPR occurs when light is incident on a metal through a higher refractive index medium, such as glass. The surface plasmons are only excited at a specific angle of incident (θSP) where the reflectivity decreases.
SPCE is similar to SPR in reverse. Instead of illumination through a prism, the metal feels near-field interactions with excited fluorophores, resulting in creation of surface plasmons. These plasmons then radiate into the glass substrate at the surface plasmon angle for the emission wavelength (θF). The plasmons radiate at the plasmon angle because this is needed to match the light and plasmon wavevectors. The plasmons cannot radiate into the sample because the wavevectors cannot be matched.39,42
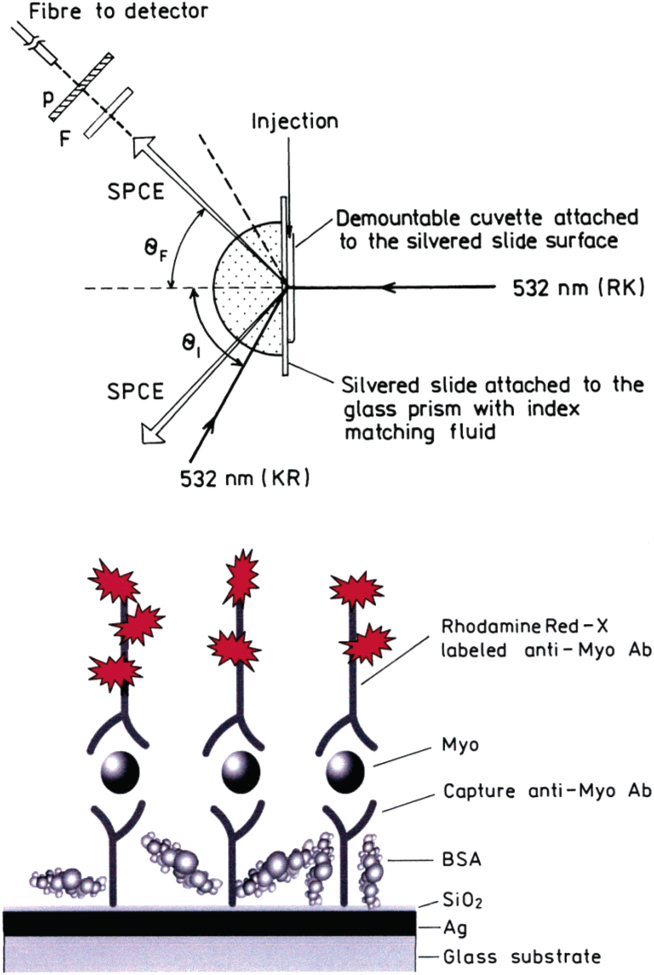
There are two possible configurations for SPCE measurements. The sample can be illuminated from the sample side, in so-called reverse Kretschmann (RK) configuration (Figure 1, top). This excitation cannot create surface plasmons in the metal surface. The excited fluorophores near the metal couple and create plasmons, which emit SPCE into the glass prism. In RK configuration, fluorophores are excited nearly equally across the sample. A small portion of the isotropic far-field (>200 nm) emission from the sample will be transmitted through the metal mirror at the plasmon angle, but most of the far-field radiation will be reflected away from the prism. The transmitted far-field fluorescence overlaps with SPCE. In our immunoassay measurements, we want to detect the fluorescent signal only from fluorophores in proximity to the metal.
Figure 1.
Top: Experimental geometry for measurements of SPCE emission with RK and KR configurations. In RK configuration, the sample is excited directly by 532 nm and the emission out-couples through the prism in a hollow cone at the angle θF. In KR configuration, the excitation is provided by the evanescent field created by the incident light of 532 nm, which enters the system through the prism at the angle of θI. The fluorophores excited by this evanescent field couple to the surface plasmons, and the directional emission out-couples through the prism at the angle θF. The emission is collected by the fiber equipped with the filter (F) and polarizer (P). Bottom: Scheme of the myoglobin immunoassay (sandwich format) on a thin silver mirror slide surface. The drawing is not to the scale. The thickness of the silver layer was 50 nm and SiO2 protective layer 5 nm.
The sample can also be illuminated through the prism at the plasmon angle (θSP), which is called the Kretschmann (KR) configuration (Figure 1, top). When the incident angle θI = θSP, there exists an evanescent field above the metal film in the sample out to ~200 nm. This evanescent field is enhanced ~40-fold (compared to the incident light intensity) by the resonance interaction.46 Hence, KR illumination results in a strong selective excitation near the metal surface. The enhanced field can allow the illumination intensity to be decreased, further reducing the background. In our myoglobin immunoassay, we will use KR configuration.
Recently, we introduced a model immunoassay on a thin silver metal surface utilizing SPCE.47,48 In this report, we used this phenomenon to develop myoglobin capture immunoassay, using fluorescently labeled anti-myoglobin antibodies (Ab’s) in a “sandwich” format (Figure 1, bottom). We demonstrated the surface-bound labeled anti-myoglobin antibody resulted in directional emission into the glass under the metal film and liquid sample. Importantly, the sensitivity of our SPCE immunoassay allowed myoglobin to be detected at a clinically relevant concentration in serum and whole blood.
EXPERIMENTAL PROCEDURES
Reagents and Materials.
Glass microscope slides (Corning) were vapor deposited with continuous 2-nm-thick chromium, 50-nm-thick silver, and 5-nm-thick SiO2 layers by EMF Corp. (Ithaca, NY). Myoglobin (recombinant) and monoclonal anti-myoglobin (anti-Myo) antibodies (capture anti-Myo antibodies clone 2mb-295, reporter anti-Myo antibodies clone 9mb-183r) were from Spectral Diagnostics, Canada. Reporter antibodies were labeled with Rhodamine Red-X using a labeling kit from Molecular Probes; dye/protein ratio was determined spectrophotometrically according to the kit instructions. Buffer components and salts (such as bovine serum albumin, glucose, sucrose, and AgNO3) were from Sigma-Aldrich. Human serum (from male AB plasma, sterile filtered) was from Sigma. HPLC purified and concentrated bovine hemoglobin solution (~17%) was kindly donated by Dr. E. Bucci. Absorbance spectra taken at different dilutions of this hemoglobin solution showed that 1-mm-thick layer of nondiluted solution had an optical density of 3 at 590 nm, the emission maximum of the bound labeled antibodies.
Coating Slides with Capture Antibodies and Myo Antigen.
Slides were noncovalently coated with capture anti-Myo antibodies as follows. Slides were covered with a tape each having one rectangular hole (7 × 15 mm) as a reaction well. Coating solution of anti-myoglobin Ab (25 μg/mL dissolved in sodium phosphate buffer, 50 mM, pH 7.4) was added to each slide (60 μL/well), and slides were incubated for 2–4 h at room temperature in a humid chamber. Slides then were rinsed with water, washing solution (0.05% Tween-20 in water), and water. Blocking to decrease nonspecific binding was performed by adding blocking solution (1% bovine serum albumin, 1% sucrose, 0.05% NaN3, 0.05% Tween-20 in 50 mM Tris-HCl buffer, pH 7.4; 75 μL/well) and incubation at room temperature for 2–4 h (or overnight at +4 °C) in the humid chamber. Slides were rinsed with water, washing solution (0.05% Tween-20 in water), and water. Myoglobin antigen was added at various concentrations (0–1000 ng/mL, dissolved in blocking buffer, 60 μL/well), and slides were incubated at room temperature for 1–2 h, washed as described above, and then covered with blocking buffer and used for end point or kinetic measurements.
End Point Binding Experiments.
Dye-labeled Rhodamine Red-X-anti-Myo Ab (dye/Ab = 2.9 mol/mol; at an immunoglobulin G concentration of [IgG] = 100 nM, or 15 μg/mL, in sodium phosphate buffer, 50 mM, pH 7.4, 60 μL/well) was added to the slide (coated with capture Ab’s and Myo antigen as described above) and the resultant mixture incubated at 37 °C in a humid chamber for 1.5 h. The slide then was rinsed with water, washing solution (0.05% Tween-20 in water), and water. Then, the tape was removed, and a 1-mm-thick demountable quartz cuvette was mounted on the metallic side of the slide over the reaction well. About 0.4 mL of the blocking buffer or a sample background solution (human serum or hemoglobin) was added inside the cuvette, and fluorescence measurements were performed at two different optical configurations (KR and RK).
Kinetic Binding Experiments.
A 1-mm-thick demountable cuvette was mounted on the metallic side of the slide (coated with capture Ab’s and Myo antigen as described above). About 0.4 mL of the Rhodamine Red-X-anti-Myo Ab (dye/Ab = 2.9 mol/mol; at [IgG] = 100 nM, or 15 μg/mL, in sodium phosphate buffer, 50 mM, pH 7.4) was added inside the cuvette using a needle. Kinetics was immediately monitored at room temperature (20 °C).
Spectroscopic Measurements.
Absorption spectra were measured on a Hewlett-Packard model 8543 spectrophotometer using 1-cm cuvettes. Emission measurements in cuvettes were performed using a Varian Eclipse spectrofluorometer.
Fluorescence measurements on microscope slides were performed using index-matching fluid to attach the slide to a hemicylindrical prism made of BK7 glass and positioned on a precise rotary stage equipped with the fiber-optics mount on a 15-cm-long arm.40 This configuration allowed fluorescence observation at any angle relative to the incident angle. The output of the fiber was connected to an Ocean Optics SD2000 spectrofluorometer for emission spectra. The excitation was from the second harmonic (532 nm) of the diode-pumped Nd:YVO4 laser (compact laser pointer design, maximal output power 30 mW). The emission was observed through a 550-nm-long wave-pass filter. We used 532-nm excitation to achieve better wavelength separation between excitation and emission: not even at the excitation maximum (~570 nm) was the signal strong enough to collect the data.
RESULTS AND DISCUSSION
The angle of directional SPCE can be readily calculated from the equations describing the reflectance of the multilayer system.49–53 These equations are provided in the section Theoretical Basis in Supporting Information.
The schematic for the SPCE Myo immunoassay is shown in Figure 1 (top). The protein-coated silver surface is illuminated at the surface plasmon angle through the glass prism, which is called the Kretschmann configuration. The free-space emission can be observed normal to the sample surface. SPCE is observed on the prism side of the sample, at the plasmon angle through a long-pass filter. The sample can also be excited through the aqueous phase, which is called the reverse Kretschmann configuration. In RK excitation there is considerably more free-space emission. Both, KR and RK configurations result in SPCE at the same angle, θF.
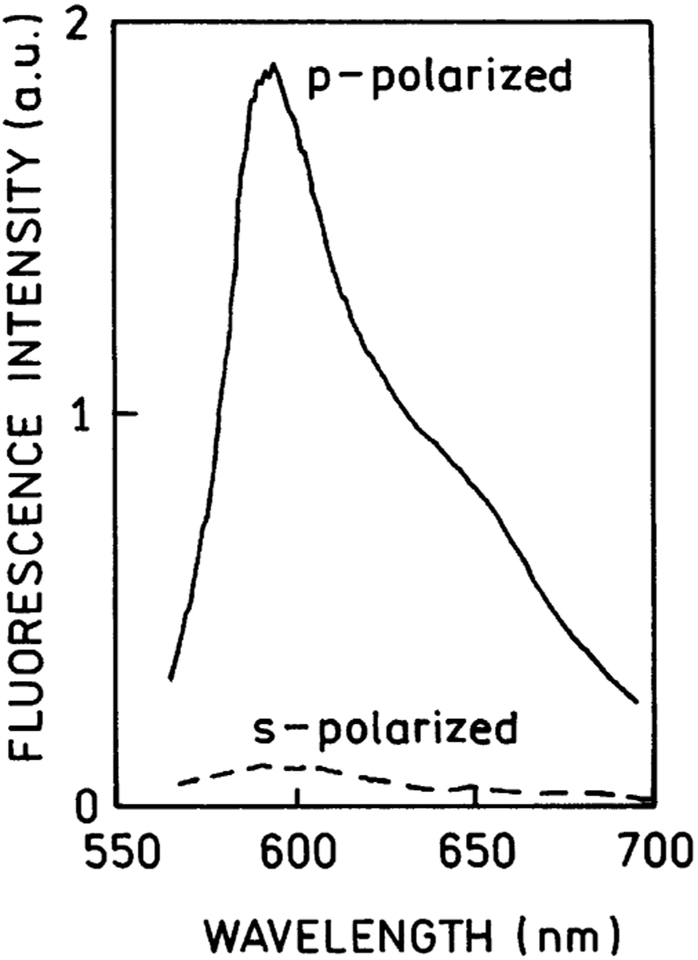
In the end point experiments, Rhodamine-X-Red-labeled Ab was bound to immobilized Myo near the silver surface (Figure 1, bottom). The emission spectrum of the RK/SPCE was characteristic of the Rhodamine-Red-X probe (Figure 2). A remarkable characteristic of SPCE is almost complete polarization in the p-direction, meaning the electric vector is oriented parallel to the plane of incidence. Figure 2 shows the emission spectra collected through an emission polarizer (oriented p or s). The orientation of the excitation polarizer did not significantly affect these intensities. This p-polarization proves that the emission is due to surface plasmons, which under these conditions cannot emit s-polarized light. An emission polarizer in the p-orientation can be used to suppress part of the free space emission that is transmitted through the metal film.
Figure 2.
Polarized fluorescence spectra of the Rhodamine Red-X-labeled anti-myoglobin antibodies bound to the captured myoglobin observed at 72° in RK/SPCE configuration (see Figure 1, top).
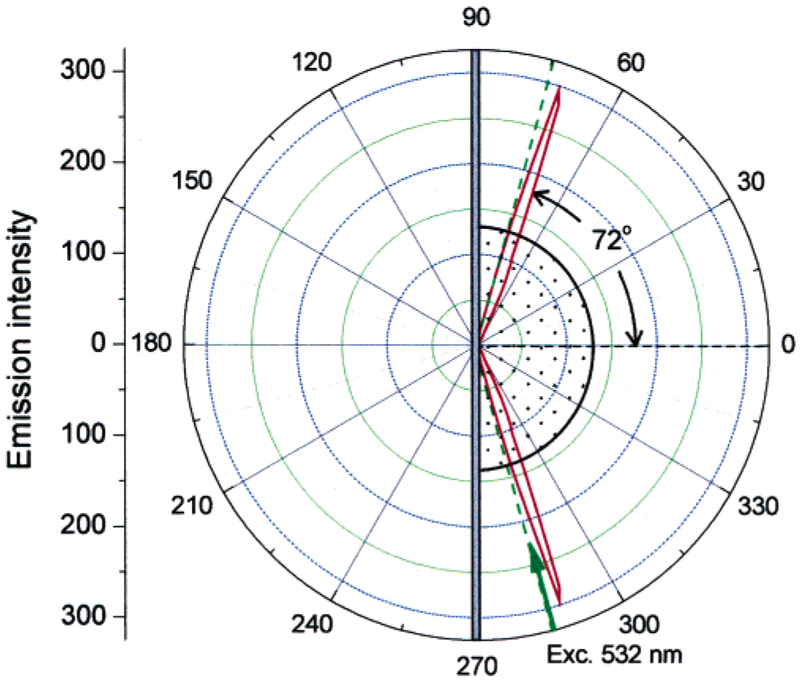
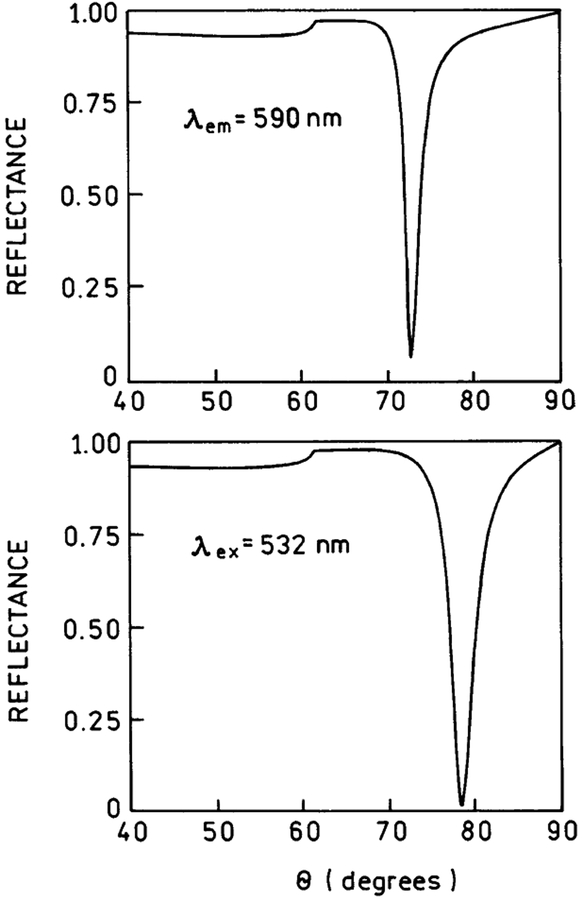
We measured the sample emission with the KR configuration, which creates surface plasmons in response to the incident light (Figure 3). The 532-nm excitation was at an angle of 74.5°, which we found to yield the highest SPCE fluorescence. The spectrum of Rhodamine Red-X-labeled Ab was the same as measured with RK/SPCE configuration. We found the emission to be strongly directional at the angle ±72° (Figure 3), which is close to the angle of ±71°, observed for directional SPCE of Rhodamin-Red-X-labeled anti-rabbit IgG bound to the antigen immobilized on the similar silver surface.48 The SPCE angle is also in agreement with the theoretic calculations. Earlier, we found close agreement between the calculated reflectivity minimums for the emission wavelength and the observed SPCE angles.39,40 The reflectivity curves can be calculated using web-based software54 or commercial software (TFCalc., Software Spectra, Inc., Portland, OR), which we found to yield equivalent results. The TFCalc. Software contains a useful library of dielectric constants for metals and dielectric coatings. We assume the protein layer to be ~18 nm thick, taking into account the dimensions of IgG of 12 × 9 nm (native IgG) or 8.5 × 6 nm (crystallographic data),55 and myoglobin monolayer of 8.7 nm56 (we assume there is no large increase in the total sandwich layer from the myoglobin itself, which is mostly inside the IgG binding pocket). We have calculated reflectivity curves for 532 (excitation) and 590 nm (detection wavelength) and found the reflectivity calculated minimums to be at 78.5° for 532 nm and at 72.5° for 590 nm, respectively (Figure 4).
Figure 3.
Angular distribution of the 590-nm fluorescence emission of Rhodamine Red-X-labeled anti-myoglobin antibodies bound to the myoglobin captured on the 50-nm silver mirror surface. The measurements were done in KR configuration with the excitation angle θI = 74.5°.
Figure 4.
Calculated reflectivity curves for a 50-nm silver film on BK7 glass (np = 1.52). The sample (protein layers) was assumed to be 18 nm thick (ns = 1.50). The buffer thickness was taken as infinite with nw = 1.33. For silver phase we used ϵm532 = −11.5 + 0.3i, and ϵm590 −15.0 + 0.4i.
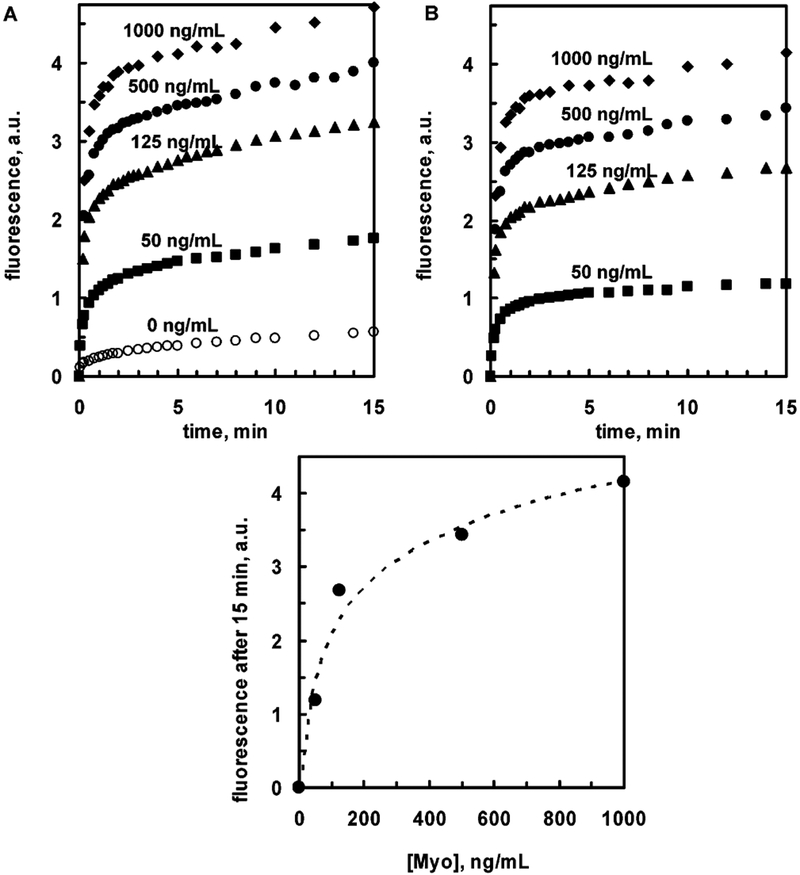
Next, we measured the binding kinetics of the Rhodamine Red-X-labeled anti-Myo Ab’s to the surface-bound Myo (at various Myo concentrations) by detecting of SPCE signal. Figure 5 shows the SPCE emission intensities after adding labeled antibody. The signal rapidly increases during first few minutes and grows slowly during next tens of minutes. Background signal (Figure 5A, top), representing nonspecific binding, is definitely much lower than for the lowest Myo concentration used, 50 ng/mL, which is below the clinical cutoff Myo concentration of 90 ng/mL for healthy patients.
Figure 5.
Top: Kinetics of binding of the Rhodamine Red-X-labeled anti-myoglobin antibodies to myoglobin (0–1000 ng/mL) captured on the 50-nm silver mirror surface observed with KR/SPCE configuration: A, noncorrected data; B, data after subtraction of background. Bottom: Dependence of SPCE signal (after 15 min) on the Myo concentration. Dashed line represents the log trend (linear at log Myo concentration scale).
Analytical assay characteristics such as precision, accuracy, specificity, detection limit, limits of quantization, and linearity may depend on numerous factors: analyte-antibody characteristics (such as Myo concentration and antibody affinity), assay conditions (such as temperature and incubation time), and such characteristics as slide substrate (metal layer coverage and protective SiO2 layer) property variations. In this report, we demonstrate the applicability of SPCE technology to a real immunoassay within a clinically important cardiac marker concentration range; optimization of the assay was not performed and is the topic of further investigations. However, the accuracy part of the SPCE assay related solely to the signal detection can be estimated. The variation in the Myo concentration determination (resulting from the signal detection accuracy, which is 2% or better) at [Myo] of 50 and 125 ng/mL is less than 5%, and at [Myo] of 500 and 1000 ng/mL less than 10%, based on the semilog trend line covering full range of [Myo] concentration studied (Figure 5, bottom).
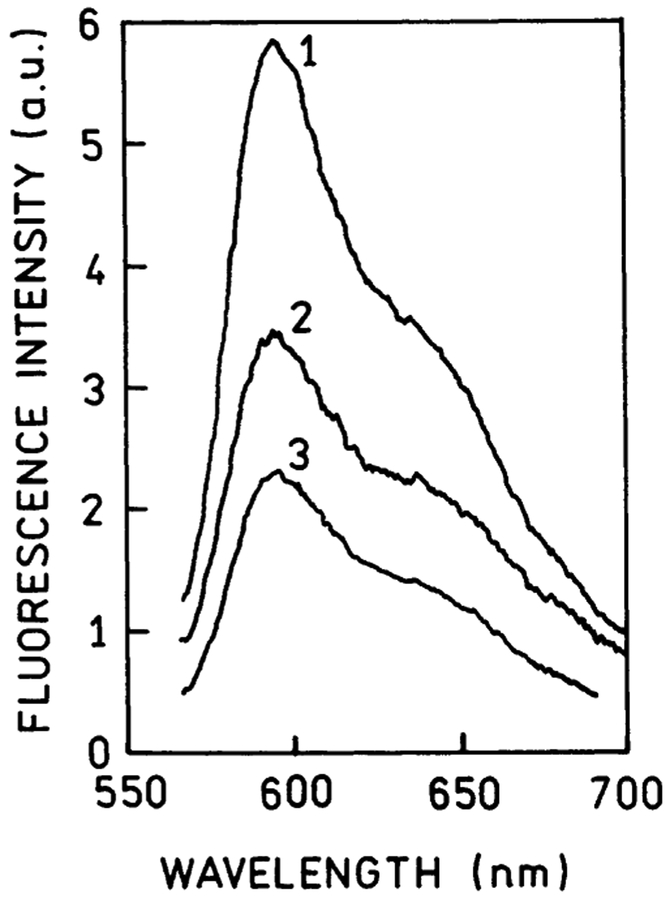
In medical diagnostics, it is often desirable to perform immunoassays without separation steps, sometimes in sample matrixes such as blood serum or whole blood. We expected that SPCE signal should be detectable in optically dense media because this signal arises from the sample within only ~200 nm of the surface. We have examined the effect of the human serum. To mimic whole blood, we added 17% bovine hemoglobin solution, which had an optical density of 3 at 590 nm. In a 1.0-mm-thick sample, this optical density would attenuate the signal about a 1000-fold. Using SPCE, the signal was attenuated less than 2-fold in a human serum medium and less than 3-fold in a hemoglobin solution (Figure 6); a subclinical myoglobin concentration at 50 ng/mL was readily detectable in the serum and hemoglobin solution.
Figure 6.
Fluorescence spectra of the Rhodamine Red-X-labeled anti-myoglobin antibodies bound to the captured myoglobin (at [Myo] = 50 ng/mL) observed with KR/SPCE configuration: 1, in blocking buffer solution; 2, in human serum solution; 3, in 17% bovine hemoglobin solution.
In our experiment, we applied a most commonly used immunoassay protocol (2 stages): 1–2-h binding of the myoglobin sample to capture antibodies and then monitoring a fast binding of the secondary antibody to the sample. Since the myoglobin binding is fast, it is possible to shorten the incubation step, or convert the assay from 2-stage to 1-stage, by adding the mixture of myoglobin sample and reporter antibodies to the slide before monitoring the signal (which is part of the assay optimization). We believe that the SPCE-based immunoassay can be converted to a very short-time test (5 min or less) and will not require any washing steps.
CONCLUSIONS
In this report, we presented our first results that show high potential of metal-enhanced fluorescence for developing a universal platform for cardiac marker detection. The initial results for myoglobin immunoassay show that it is possible to detect myoglobin concentrations below 50 ng/mL, which is lower than clinical cutoff for myoglobin in healthy patients. The SPCE-based assays are easy to perform and can be done in the presence of dense matrix background, such as whole blood. The existing highly sensitive methods for Myo detection (with sensitivity such as 2–5 ng/mL57,58 or even 0.8 ng/mL59) require washing steps and a duration time of ~20 min per test. Our results show the potential of using SPCE in optically dense sample matrixes, without any washing steps.
Supplementary Material
ACKNOWLEDGMENT
This work was supported by the National Center for Research Resource (RR-08119) and Philip Morris USA, Inc. The authors are grateful to Dr. Garth Styba and the company Spectral Diagostics, Inc. (Canada) for the kind gift of the recombinant myoglobin and anti-myoglobin antibodies.
Footnotes
SUPPORTING INFORMATION AVAILABLE
Theoretical basis (equations explaining the calculations of the angle of directional SPCE from the reflectance of the multilayer system). This material is available free of charge via the Internet at http://pubs.acs.org.
References
- (1).Ellenius J; Groth T; Lindahl B; Wallentin L Clin. Chem 1997, 43, 1919–1925. [PubMed] [Google Scholar]
- (2).Malasky BR; Alpert JS Cardiol. Rev 2002, 10, 306–317. [DOI] [PubMed] [Google Scholar]
- (3).Panteghini M Am. J. Clin. Pathol 2002, 118, 354–361. [DOI] [PubMed] [Google Scholar]
- (4).Di Serio F; Antonelli G; Trerotoli P; Tampoia M; Matarrese A; Pansini N Clin. Chim. Acta, 2003, 333, 185–189. [DOI] [PubMed] [Google Scholar]
- (5).Gibler WB; Blomkalns AL; Collins SP Rev. Cardiovasc. Med 2003, 4, S47–S55. [PubMed] [Google Scholar]
- (6).Karras DJ; Kane DL Emergency Med. Clin. North Am 2001, 19, 321–337. [DOI] [PubMed] [Google Scholar]
- (7).Newby LK; Storrow AB; Gibler WB; Garvey JL; Tucker JF; Kaplan AL; Schreiber DH; Tuttle RH; McNulty SE; Ohman EM Circulation 2001, 103, 1832–1837. [DOI] [PubMed] [Google Scholar]
- (8).Storrow AB; Gibler WB Clin. Chim. Acta 1999, 284, 187–196. [DOI] [PubMed] [Google Scholar]
- (9).McCord J; Nowak RM; Hudson MP; McCullough PA; Tomlanovich MC; Jacobsen G; Tokarski G; Khoury N; Weaver WD Ann. Emergency Med 2003, 42, 343–350. [DOI] [PubMed] [Google Scholar]
- (10).Panteghini M; Apple FS; Christenson RH; Dati F; Mair J; Wu AH Clin. Chem. Lab. Med 1999, 37, 687–693. [DOI] [PubMed] [Google Scholar]
- (11).Woo J; Lacbawan FL; Sunheimer R; LeFever D; McCabe JB Am. J. Clin. Pathol 1995, 103, 725–729. [DOI] [PubMed] [Google Scholar]
- (12).Tucker JF; Collins RA; Anderson AJ; Hess M; Farley IM; Hagemann DA; Harkins HJ; Zwicke D Ann. Emergency Med 1994, 24, 704–708. [DOI] [PubMed] [Google Scholar]
- (13).Montague C; Kircher T Am. J. Clin. Pathol 1995, 104, 472–476. [DOI] [PubMed] [Google Scholar]
- (14).Kilpatrick WS; Wosornu D; McGuinness JB; Glen AC Ann. Clin. Biochem 1993, 30, 435–438. [DOI] [PubMed] [Google Scholar]
- (15).Gordon Malan P In The Immunoassay Handbook, 2nd ed; Wild D, Ed.; Nature Publishing Group: New York, 2001; pp 229–239. [Google Scholar]
- (16).Gosling JP Clin. Chem 1980, 36, 14808–1427. [Google Scholar]
- (17).Van Dyke K, Van Dyke R, Eds. Luminescence Immunoassay and Molecular Applications; CRC Press: Boca Raton, FL, 1990. [Google Scholar]
- (18).Hemmila IA Applications of Fluorescence in Immunoassays; John Wiley & Sons: New York, 1991. [Google Scholar]
- (19).Vo-Dinh T; Sepaniak MJ; Griffin GD; Alarie JP Immunomethods 1993, 3, 85–92. [Google Scholar]
- (20).Dandliker WB; de Saussure VA Immunochemistry 1970, 7, 799–828. [DOI] [PubMed] [Google Scholar]
- (21).Fiore M; Mitchell J; Doan T; Nelson R; Winter G; Grandone C; Zeng K; Haraden R; Smith J; Harris K; Leszczynski J; Berry D; Safford S; Barnes G; Scholnick A; Ludington K Clin. Chem 1988, 34, 1726–1732. [PubMed] [Google Scholar]
- (22).Klein C; Batz H-G; Draeger B; Guder H-J; Herrmann R; Josel H-P,; Nagele U; Schenk R; Bogt B In Fluorescence Spectroscopy: New Methods and Applications; Wolfbeis OS, Ed.; Springer-Verlag: Berlin, 1993; pp 245–258. [Google Scholar]
- (23).Nasir MS; Jolley ME Comb. Chem. High Throughput Screen 1999, 2, 177–190. [PubMed] [Google Scholar]
- (24).Gomez-Hens A; Aguilar-Caballos MP Comb. Chem. High Throughput Screen 2003, 6, 177–182. [DOI] [PubMed] [Google Scholar]
- (25).Morrison LE Anal. Biochem 1988, 174, 101–120. [DOI] [PubMed] [Google Scholar]
- (26).Ullman EF; Schwarzberg M; Rubenstein KE J. Biol. Chem 1976, 251, 4172–4178. [PubMed] [Google Scholar]
- (27).Qin QP; Peltola O; Pettersson K Clin. Chem 2003, J49, 1105–1113. [DOI] [PubMed] [Google Scholar]
- (28).Soini E In Monoclonal Antibodies and New Trends in Immunoassays; Bizollon Ch. A., Ed.; Elsevier Science Publishers: New York, 1984; pp 197–208. [Google Scholar]
- (29).Diamandis EP Clin. Biochem 1988, 21, 139–150. [DOI] [PubMed] [Google Scholar]
- (30).L’vgren T; Pettersson K In Luminescence Immunoassay and Molecular Applications; Van Dyke K, Van Dyke R, Eds.; CRC Press: New York, 1990; pp 234–250. [Google Scholar]
- (31).Mathis G Clin. Chem 1993, 39, 1953–1959. [PubMed] [Google Scholar]
- (32).Baker GA; Pandey S; Bright FV Anal. Chem 2000, 72, 5748–5752. [DOI] [PubMed] [Google Scholar]
- (33).Waris ME; Meltola NJ; Soini JT; Soini E; Peltola OJ; Hanninen PE Anal. Biochem 2002, 309, 67–74. [DOI] [PubMed] [Google Scholar]
- (34).Hanninen P; Waris M; Kettunen M; Soini E Biophys. Chem 2003, 105, 23–28. [DOI] [PubMed] [Google Scholar]
- (35).Ekins RP; Chu FW Clin. Chem 1991, 37, 1955–1967. [PubMed] [Google Scholar]
- (36).Bernard A; Michel B; Delamarche E Anal. Chem 2001, 73, 8–12. [DOI] [PubMed] [Google Scholar]
- (37).Schobel U; Coille I; Brecht A; Steinwand M; Gauglitz G Anal. Chem 2001, 73, 5172–5179. [DOI] [PubMed] [Google Scholar]
- (38).Eggeling C; Brand L; Ullmann D; Jager S Drug Discovery Today 2003, J8, 632–641. [DOI] [PubMed] [Google Scholar]
- (39).Lakowicz JR Anal. Biochem 2004, 324, 153–169. [DOI] [PMC free article] [PubMed] [Google Scholar]
- (40).Gryczynski I; Malicka J; Gryczynski Z; Lakowicz JR Anal. Biochem 2004, 324, 170–182. [DOI] [PMC free article] [PubMed] [Google Scholar]
- (41).Raether H In Physics of Thin Films, Advances in Research and Development; Hass G, Francombe MH, Hoffman RW, Eds.; Academic Press: New York, 1977; Vol. 9, pp 145–261. [Google Scholar]
- (42).Raether H Surface Plasmons on Smooth and Rough Surfaces and on Gratings; Springer-Verlag: New York, 1988. [Google Scholar]
- (43).Salamon Z; MacLeod HA; Tollin G Biochim. Biophys. Acta 1997, 1331, 117–129. [DOI] [PubMed] [Google Scholar]
- (44).Malmqvist M Biochem. Soc. Trans 1999, 27, 335–340. [DOI] [PubMed] [Google Scholar]
- (45).Mullett WM; Lai EP; Yeung JM Methods 2000, 22, 77–91. [DOI] [PubMed] [Google Scholar]
- (46).Liebermann T; Knoll W Colloids Surf., A 2000, 171, 115–130. [Google Scholar]
- (47).Matveeva E; Gryczynski Z; Gryczynski I; Lakowicz JR J. Immunol. Methods 2004, 286, 133–140. [DOI] [PMC free article] [PubMed] [Google Scholar]
- (48).Matveeva E; Malicka J; Gryczynski I; Gryczynski Z; Lakowicz JR Biochem. Biophys. Res. Commun 2004, 313, 721–726. [DOI] [PMC free article] [PubMed] [Google Scholar]
- (49).MacLeod HL Thin Film Optical Filters, 3rd ed.; Institute of Physics Publishing: Bristol, U.K., 2001. [Google Scholar]
- (50).Salamon Z; Tollin G Biophys. J 1996, 71, 848–857. [DOI] [PMC free article] [PubMed] [Google Scholar]
- (51).Salamon Z; MacLeod HA; Tollin G Biophys. J 1997, 73, 2791–2797. [DOI] [PMC free article] [PubMed] [Google Scholar]
- (52).Gryczynski Z; Gryczynski I; Matveeva E; Malicka J; Nowaczyk K; Lakowicz JR In Cytometry, 4th ed.; Darzynkiewicz Z, Roederer M, Tanke H, Eds.; Methods in Cell Biology 75; Academic Press: Boston, 2004; pp 73–104. [DOI] [PubMed] [Google Scholar]
- (53).Calander N Anal. Chem 2004, 76, 2168–2173. [DOI] [PubMed] [Google Scholar]
- (54).Nelson BP; Frutos AG; Brockman JM; Corn RM Anal. Chem 1999, 71, 3928–3934. [Google Scholar]
- (55).Fan FR; Bard AJ Proc. Natl. Acad. Sci. U.S.A, 1999, 96, 14222–14227. [DOI] [PMC free article] [PubMed] [Google Scholar]
- (56).Kent MS; Yim H; Sasaki DY; Majewski J; Smith GS; Shin K; Satija S; Ocko BM Langmuir 2002, 18, 3754–3757. [Google Scholar]
- (57).Zaninotto M; Pagani F; Altinier S; Amboni P; Bonora R; Dolci A; Pergolini P; Vernocchi A; Plebani M; Panteghini M Clin Chem 2000, 46, 1631–1637. [PubMed] [Google Scholar]
- (58).Le Moigne F; Beauvieux MC; Derache P; Darmon YM Clin Biochem. 2002, 35, 255–262. [DOI] [PubMed] [Google Scholar]
- (59).Beuerle JR; Azzazy HM; Apple FS; Duh SH; Tan A; Christenson RH Clin Biochem. 2000, 33, 595–598. [DOI] [PubMed] [Google Scholar]
Associated Data
This section collects any data citations, data availability statements, or supplementary materials included in this article.


