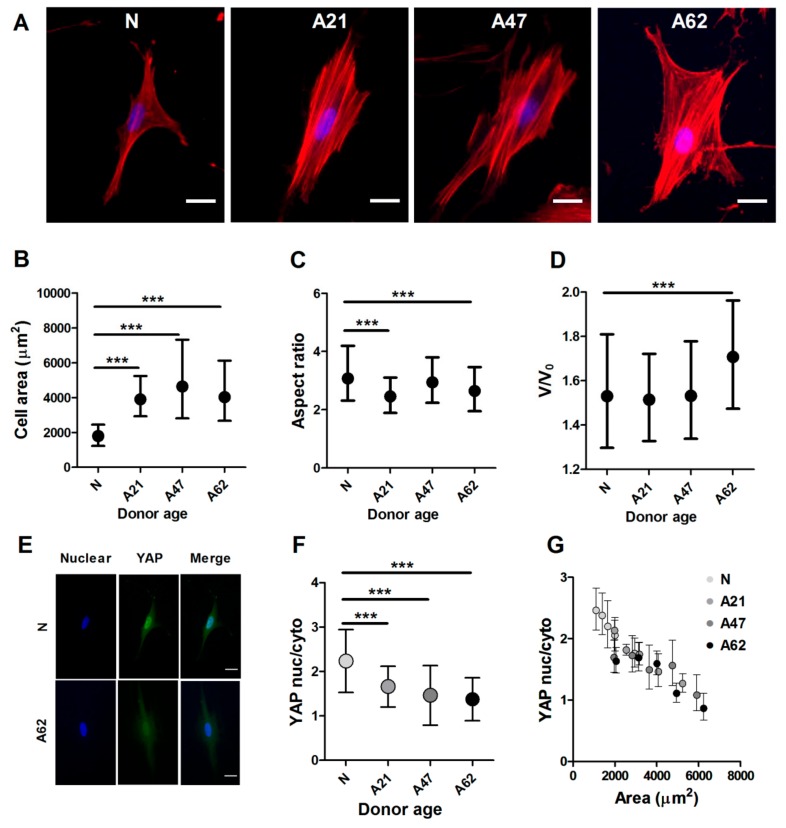
Figure 2.
Cells from aged donors exhibited changes in cellular and nuclear morphology. (A) Represantative epifluorescence images showing increased cell area and F-actin organization of cells from donors at different ages. F-actin labelled with phalloidin (red), nucleus DAPI (blue). Scale bars represent 20 µm. (B) Corresponding plot showing the increased cell area of cells from aged donors compared to neonatal donor. (C) There was a significant decrease in aspect ration of cells from aged donors (*** p < 0.001, Mann–Whitney U test). (D) Nucleus relative volume increased for cells from aged donor (*** p < 0.001, Mann–Whitney U test). Data plotted from at least three independent experiments as geometric mean with quartiles, total cell number varied between 282–620, with ~100 cells per repeat. (E) Representative epifluorescence images of yes-associated protein (YAP) localisation in cells from neonatal and adult donors. Cells are labelled, nucleus DAPI (blue), YAP (green). Scale bars represent 20 µm. (F) Immunostaining analysis showing a significant reduction of ratio of YAP nuclear to cytoplasmic in cells from aged donors. (G) Corresponding plot showing correlation between YAP localisation to cell area. Independently to donor age, in all age groups larger cells have less nuclear YAP. Data are plotted from three independent experiments and presented as mean values with SD (nonparametric one-way ANOVA test, *** p < 0.001). Number of cells ranged between (68–202).

