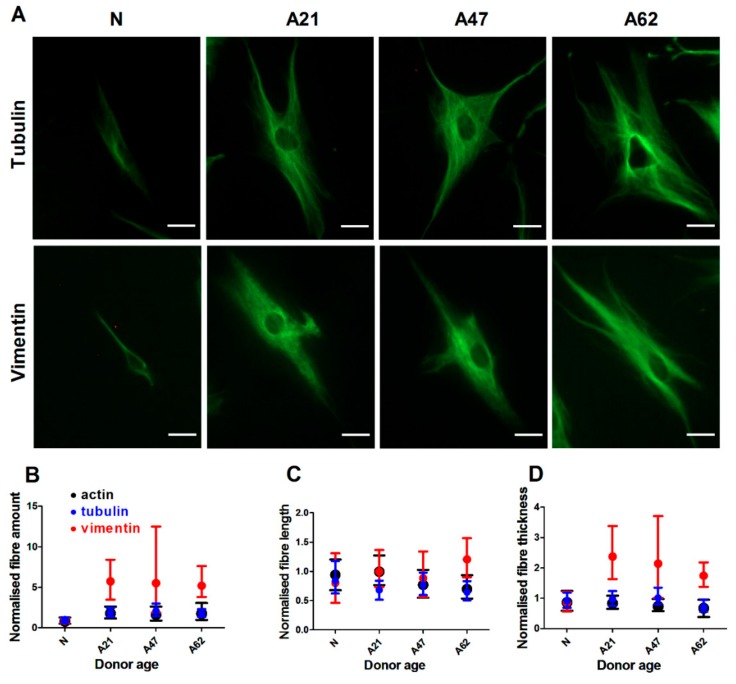
Figure 3.
Age has the highest influence on intermediate filaments. (A) Represantative epifluorescence images showing tubulin and vimentin organization of cells from donors at different age. Fibres labelled ageinst tubulin and vimentin (green). Scale bars represent 20 µm. Corresponding plot of three cytoskeletons showing relative changes in (B) fibre amount, (C) fibre length, and (D) fibre thickness. Vimentin is showing the highest changes compared to F-actin and tubulin. Data are plotted from three independent experiments and normalised to neonatal donor to show the magnitute of changes. The data of all cytoskeletons with real values are presented in Supplementary Figure S5.

