Abstract
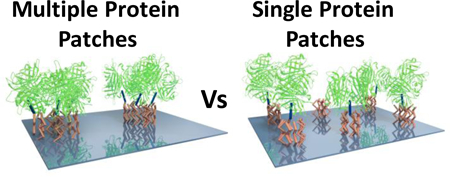
The ability to manipulate single protein molecules on a surface is useful for interfacing biology with many types of devices in optics, catalysis, bioengineering, and biosensing. Control of distance, orientation, and activity at the single molecule level will allow for the production of on-chip devices with increased biological activity. Cost effective methodologies for single molecule protein patterning with tunable pattern density and scalable coverage area remain a challenge. Herein, Hole Mask Colloidal Lithography is presented as a bench-top colloidal lithography technique that enables a glass coverslip to be patterned with functional streptavidin protein onto patches from 15–200 nm in diameter with variable pitch. Atomic force microscopy (AFM) was used to characterize the size of the patterned features on the glass surface. Additionally, single-molecule fluorescence microscopy was used to demonstrate the tunable pattern density, measure binding controls, and confirm patterned single molecules of functional streptavidin.
Keywords: Colloidal lithography, single protein patterning, hole mask, AFM, SM-TIRF
Graphical Abstract
Precise control over protein placement and orientation on a substrate offers great promise for a wide variety of applications, such as biosensing,1–3 drug screening,4–6 bio-catalysis,7,8 probing optical properties of the proteins,9–11 probing protein function,12–14 and probing biomolecular interactions.15–17 Proteins possess superior catalytic activity, electron charge transfer, and selectivity of substrate over synthetic counterparts, particularly under mild conditions.18–20 Thus, incorporating proteins into new materials and devices will allow for unsurpassed capabilities. Techniques that can pattern single molecules reduces sample consumption and waste, produce devices with more specificity and sensitivity, and allows for the possibility for multiplexing.21–24 Patterning single protein molecules also enables a wider range of single-molecule biophysical studies, which often reveal important information traditional ensemble measurements lack.25,26 Moreover, the ability to control the orientation and environment of individual proteins allows one to tailor and fine tune enzymatic reactions at the atomic level.27,28
Much of the traditional protein patterning methods from the 1990s focused on patterning relatively large spots using photolithography, pin contact printing, or a combination of the two, such as microcontact printing.1,29 These early techniques were limited by the fabrication of small pinheads or the diffraction limit of light.30 Newer techniques based on scanning probes,31 electron beam lithography,32 co-block polymers,25 and DNA origami 33 have allowed patterning of smaller sizes that are capable of accommodating single protein molecules.34 However, these current techniques have intrinsic disadvantages. Scanning probe and electron beam based techniques are time consuming, labor intensive, expensive, and difficult to scale to wafer sizes.35,36 While block copolymers is a cost effective material, their patterns are not easily tunable and can be difficult to implement on different substrates. These patterns are generated from the self-assembly of monomers through complex interactions.37–39 Developing cost-effective and scalable methodologies that can produce patterns on the sub 20 nm scale with tunable densities still remains a challenge.
Hole mask colloidal lithography (HCL)40 provides a possible solution to patterning molecules on small length scales. HCL uses sparsely and stochastically scattered nano- or micro-spheres on a substrate as the patterning mask of a lithography process. First described in 2007, HCL was originally proposed to create >100 nm metallic structures for optical studies.40 Polystyrene and silica spheres (nanoparticles) with exceptionally low polydispersity are most commonly used in HCL. HCL has a few advantages. First, because HCL does not involve packing spheres, it is not limited by the sphere size, which becomes difficult as the sphere size is reduced to the nanometer scale. Second, the density of the patterned structures can be altered by simply changing the concentration of spheres used in the colloidal lithography. Third, HCL offers an inexpensive, benchtop method in which one can achieve patterning on any substrate of choice, such as glass, ITO-glass, silicon, plastic, and metal surfaces. Lastly, HCL offers an alternative that does not require specialized copolymers, rigorous control of temperature and humidity, complex inking solutions and procedures, or slow and expensive electron beams in order to pattern single molecules with tunable pattern density.
Because polystyrene and silica spheres are commercially available in sizes as small as 10 and 15 nm, we sought to extend HCL down to the sub-100 nm scale. Herein, we investigate the use of hole mask colloidal lithography (HCL) as a benchtop, scalable technique that enables the patterning of single-molecule functional streptavidin proteins onto variable pitch 15–200 nm sized patches. The size, height, and density of the protein patterning were confirmed using atomic force microscopy (AFM). In order to verify that indeed a single protein molecule has been patterned in the case of the small spot sizes, the sample were characterized using fluorescence microscopy.
While the work described herein utilizes a glass substrate, HCL can be used to pattern other materials such as plastic or ITO, adding to the utility of the technique. Experimental details have been included in the Supporting Information (SI). Briefly, as shown in Figure S1, the first step of patterning the substrate (Figure S1B) was to spin-coat piranha cleaned glass coverslips with polymethylmethacrylate (PMMA). The coverslips were then soft baked for 10 minutes at 180 °C to remove the anisole and fix the polymer to the surface followed by a 5 second oxygen plasma etch to increase the hydrophilicity of the surface.41 Positively charged poly(diallyldimethylammonium chloride) solution (PDDA) was drop coated and rinsed away with DI water (Figure S1C). Carboxylated polystyrene (PS) nanospheres of varying sizes were diluted and drop coated onto the substrate and rinsed with DI water (Figure S1D). The negatively charged PS spheres electrostatically repulse one another to limit aggregation and bind to the positively charged PDDA surface. Next, 5 nm of gold was vapor deposited over the entire surface of the substrate (Figure S1E). Household tape was then applied to the surface and used to strip away the raised PS nanospheres (Figure S1F). Then, a second, longer oxygen plasma etch, removes the exposed PDDA and PMMA, where the PS spheres once were. The areas with gold are protected from the oxygen plasma etching, while the holes become wells extending to the glass substrate (S1G). Thus, a ‘hole mask’ is created, in which defined holes of the desired size, pitch depth, and density on the surface is achieved.
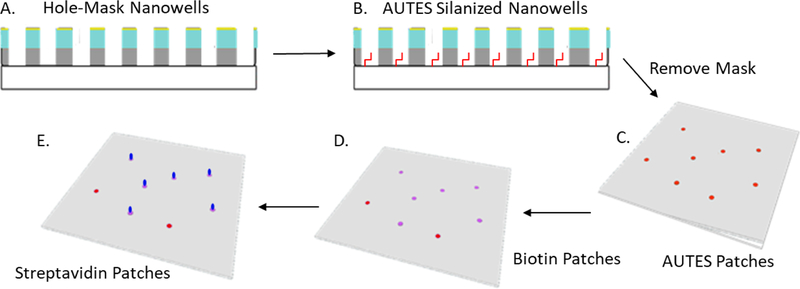
To pattern protein onto the substrate containing the ‘hole mask’, an amine functionalized silane, 11-aminoundecyltriethoxysilane (AUTES) was bound to the exposed glass through either vapor deposition (<64 nm) or in solution (>64 nm) (Scheme 1A). Once the exposed glass (inside the holes) was functionalized with AUTES, the mask consisting of polymers and gold are removed by sonicating in acetone and rinsed with ethanol and Milli Q water (Scheme 2B). The substrate was then dried with nitrogen. Next, biotin-poly(ethylene glycol)(1K)-carboxylic acid is EDC coupled to the amine group of AUTES (Scheme 1C). The biotin-PEG(1K)-COOH : NHS : EDC solution was added to the substrate for 1 hour. After which, the substrate was rinsed with Milli Q water and dried with nitrogen. (Scheme 1D) Finally, 1–10 nM of streptavidin in pH 7 HEPES buffer was added to the substrate, incubated, and rinsed with buffer (Scheme 1E).
Scheme 1.
Schematic of patterning protein using hole mask colloid lithography nanowells. To pattern the hole-mask substrate, the exposed glass of the nanowells (A) is amino silinized with AUTES (B). The hole mask polymers are then removed (C). AUTES is EDC coupled to COOH-Biotin patches (D). Finally, streptavidin is bound to the biotin (F).
A systematic characterization of samples containing various sizes of ‘hole mask’ templates was carried out using atomic force microscopy (AFM). Hole masks with 210 nm, 64 nm, and 15 nm templates were created as shown in the AFM images in Figure 1. In the leftmost AFM images, the gold colored areas are the planar gold film on top of the polymers, while the dark spots are nanowells that have been created from PS sphere removal and oxygen plasma etching. Clearly, the AFM images show that HCL lithography can be used to pattern holes as small as 15 nm. Hole mask templates scale directly with the size of the lithographic PS spheres used in the process and the distribution of the holes are stochastic. In the area with relatively high packing densities, the electrostatic self-repulsion between the PS spheres creates a pattern with relatively narrow distributed inter-sphere distance. However, the strong adsorption force between the substrate and the sphere prevents the formation of the high order close-packing structure.
Figure 1.
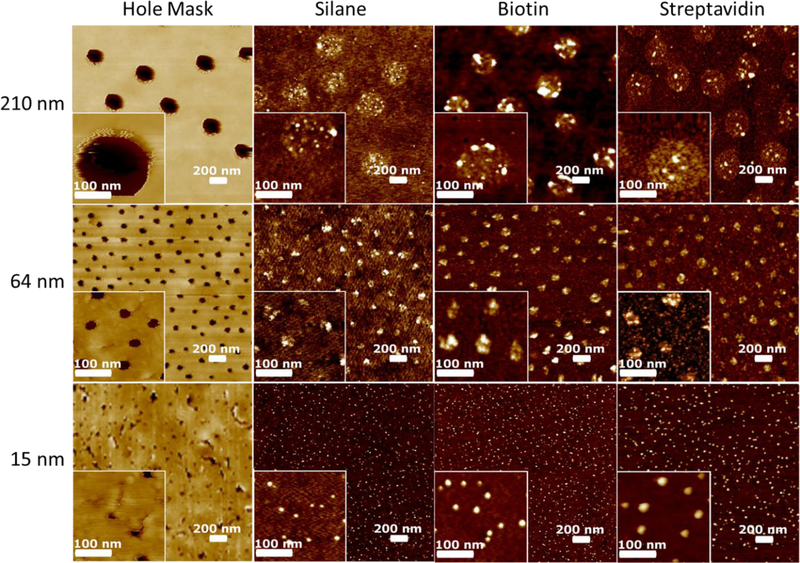
AFM images in descending order of size of the hole mask template. From left to right, the images show the hole mask template after oxygen plasma etching, after silanization, after EDC coupling biotin, and finally after streptavidin binding.
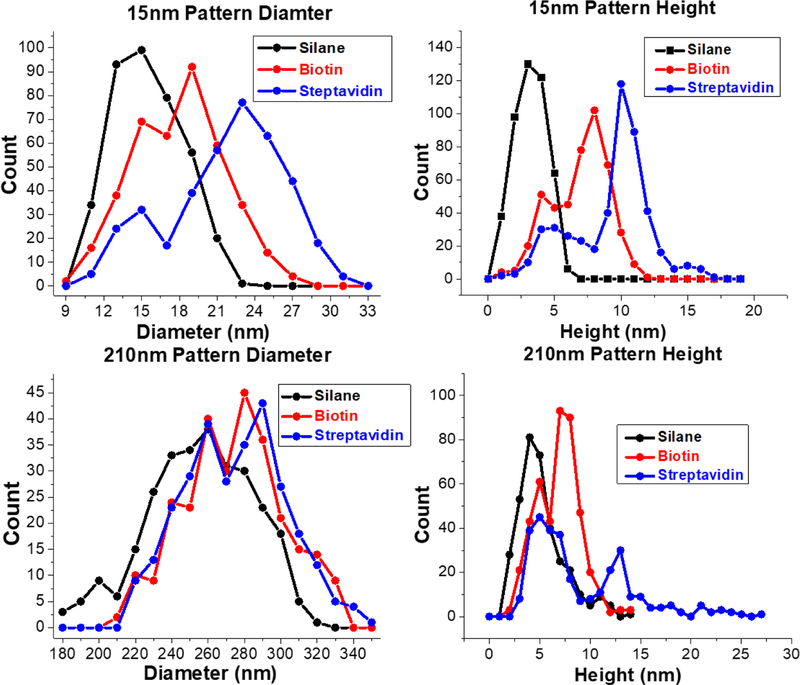
Following the successful fabrication of the hole mask nanowell patterns, the exposed glass at the bottom of the nanowells were amino silanized to create patterned patches of silane molecules (Figure 1, middle left column). In these images, the sacrificial polymers and gold have been removed so the brown colored regions are now the surface of the glass coverslip. Where the dark indented nanowell structures once were, there are now raised white patches of AUTES. The size and shape of the AUTES patches correspond directly with the size of the nanowells created after removing the PS spheres (Figure 1 left column). Particle analysis (Figure 2) reveals that the AUTES diameter of the 15 nm patterns range from 8–23 nm. The most common of which are 16 nm in diameter. The diameter of the 210 nm patterns has a larger range from 180 nm to 330 nm. This larger range is most likely due to the larger distribution of sizes in the 200 nm PS spheres versus the 15 nm PS sphere solutions. Some increase in diameter can also be attributed to the addition of the AUTES; AFM samples are measured dried, so molecules are not expected to be oriented vertically. The heights of AUTES range from 1–7 nm with a distribution centered at 4 nm for the 15 nm samples. For the 210 nm diameter samples the range is 1–14 nm. Not only is the range larger, but the AUTES distribution is bimodal with peaks at 4 and 8 nm. The approximately 4 nm high structures for the AUTES AFM data agrees with previous reports of similar silanes on glass surfaces.42,43 The structures 8 nm in height possibly represent multilayers of AUTES on the surface, which are not present in 15 nm diameter samples. Therefore, the AFM data shows HCL can be used to template molecules such as AUTES, selectively on a substrate. It is worth noting that HCL can be used to pattern other types of molecules such as silanes with different functional groups, thiols, chelators and oxides on a wide variety of substrates in a similar manner to the work reported above.
Figure 2.
Particle analysis of AFM images of 15 nm and 210 nm patterns. Left are the diameter distribution of the AUTES, biotin, and streptavidin patterns for 15 nm and 210 nm. The right side are height distribution of the AUTES, biotin, and streptavidin. Each iterative step of the patterning process results in increases to both diameter and heights. The bin width of the 15 nm diameter histogram is 3 nm. The bin width of the 210 nm diameter histogram is 10 nm. The bin width of both the 15 nm and 210 nm height histograms is1 nm.
With the AUTES successfully patterned on the glass surface, the next step is to couple biotin to the surface for eventual streptavidin binding. This is achieved through the common carbodiimide/EDC reaction. AFM images after biotin conjugation are shown in Figure 1, middle- right column. For the small, 15 nm patterns, Figure 2 shows an increase of 4–5 nm in both diameter and height upon biotin conjugation. The approximately 4–5 nm high structures agree with previous reports for PEG(1K).44,45 For the 210 nm samples, the height also increased 5 nm, but the diameter increased by 20 nm. For both sizes, both the diameter and heights distributions after biotinylation are bimodal with one population from unlabeled AUTES and the other presumably the newly coupled biotin. Interestingly, Figure 1 shows that for the 210 nm patterns, the entire diameter of the pattern of AUTES molecules does not show height changes consistent with biotin binding. This implies an incomplete EDC reaction with the AUTES molecules on the surface, similar to literature reports showing EDC coupling is less efficient on a surface than in bulk solution.46 In combination, the AFM diameter and heights suggest that a part of the AUTES patterns has been successfully biotinylated, while the rest, particularly in the larger patches, is left unreacted. To increase efficiency, multiple EDC reactions could be done successively on the surface. In addition, other silanes with different functionalities could be incorporated on the surface to increase efficiencies, such as click chemistry active azido silanes.
With biotin bound, the next and final step is then to immobilize streptavidin to the patterned area. Upon addition of streptavidin to the substrate containing 15 nm patches, the height increased from approximately 8 nm to 11–12 nm. The diameter matches well with the height change, where both samples increase from 5–10 nm. Distribution is still bimodal with one population similar to AUTES, and the other population, presumably containing biotin, shifting to the right. The size and height distribution conclusively show that the unreacted AUTES does not bind the streptavidin, but the population containing biotin does appear to bind streptavidin quite efficiently, shifting to larger diameter and heights. The increase of 5 nm for single streptavidin molecule patterning matches well with the reported size of a single streptavidin protein.47 Figure 1 supports the notion that as the pattern spot size gets larger, two populations emerge, one with streptavidin bound and the other without. i.e. the images on the bottom right of Figure 1 have two distinct colors. The lighter circular ring is the shorter AUTES, while the brighter smaller spots are streptavidin.
As a whole, the data show systematic changes in height and diameter during each addition of the construct that ends with patterned streptavidin protein molecules. The steps are highly selective and negligible nonspecific binding of the functional molecules is observed. The AFM and particle analysis indicate that AUTES patterns are directly related to the HCL template; changing the size of the template results in different sized patterns. Each additional linkage made on the surface is confined to the location of the original nanowell in the hole mask template. Likewise, each iterative step in patterning biotin and streptavidin results in corresponding increases in diameter and heights. For the 15 nm samples, the size increases (5 nm) match with what one expects for patterns of single-molecule streptavidin because one streptavidin molecule is 4–5 nm in diameter.
In order to confirm the patterning of single, functional streptavidin with binding pocket(s) available for further biosensing applications, we used biotin fluorescently labeled with Cy5 to probe the patterned streptavidin. Fluorescence measurements serve three purposes. First, to determine if functional streptavidin, i.e. streptavidin maintaining a high affinity for biotin, was in fact binding to the surface. Second, to show that the density of protein molecules residing in patches of different size is adjustable. Fluorescence microscopy images also reconfirm that streptavidin binding is directly related to the hole mask template. Lastly, and perhaps most importantly, bleaching step analysis of the fluorescence microscopy data gives insight into the exact number of streptavidin molecules residing in the surface patches. Figure S3 in the Supporting Information section shows that fluoresce is observed upon addition of biotin-Cy5 on the streptavidin bound substrates. Figure S4 in the Supporting Information section also shows that changing the density of the hole mask template directly results in changing the fluorescence density, suggesting that streptavidin is being patterned according to the hole mask template. In addition, Figure S5 of the Supporting Information section illustrates three negative controls for streptavidin binding. The negative controls prove that each iterative step in the process, from AUTES to biotinylation, and streptavidin binding is necessary for biotin-Cy5 to attach. These negative controls also show that background fluorescence is minimal, i.e. there is a lack of fluorescence when one of the linking steps is omitted. Only when biotin is present on the surface is fluorescence from the Cy5 labeled streptavidin observed. Thus, each step is necessary for biotin-Cy5 binding.
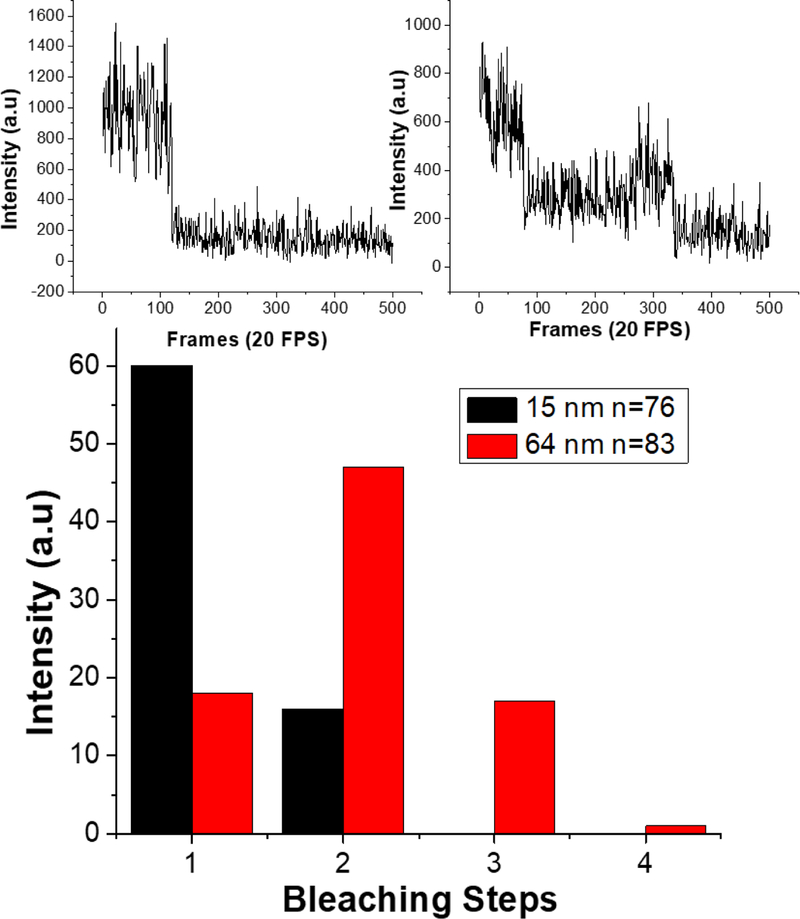
Fluorescence bleaching steps were analyzed for 15 nm and 64 nm streptavidin-biotin-Cy5 patterns. Each fluorescent spot was plotted as intensity versus a number of frames (each frame lasts 50 ms in time). The number of steps until each intensity bleached to the background intensity that was measured in control measurements containing no dye molecules (~100 photocounts). The data shows that the 15 nm patterned spots are mostly single bleaching steps with only a small amount exhibiting 2 steps, and no spots having 3 or greater bleaching steps. Each streptavidin has four binding pockets and at least one has been used to immobilize it onto the patterned substrate. In addition, a low ratio of Cy5-labeled biotin to streptavidin was used when labeling (1:1 ratio of Cy5-labeled biotin to streptavidin), so it is likely less than three biotin binding sites on the protein are filled. Therefore, less than three Cy5 bleaching steps or less than three biotin-Cy5 bound in each spot strongly indicates that each spot contains only one streptavidin protein. Likewise, the spots that contain only a single bleaching step is indisputably indicative of a single protein molecule present. The larger 64 nm patterned spots indicate an overall larger number of bleaching steps, with most spots having 2 bleaching steps and other spots having up to 4 bleaching steps where more than one streptavidin is most likely bound. In contrast, the smaller 15 nm spots contained only 1–2 bleaching steps, indicating only 1 streptavidin protein is present in most if not all of the spots. Thus, the bleaching analysis demonstrates that HCL is capable of patterning single molecules of functional streptavidin.
In summary, we have illustrated for the first time that hole mask colloidal lithography (HCL) can be used as an inexpensive, scalable, rapid technique to pattern single molecules onto a substrate of choice. The AFM and fluorescence microscopy data illustrate that each step of HCL patterning is successful. The HCL patterns are tunable and directly dictate molecular binding locations. Height and diameter changes throughout the patterning protocol match single-molecule streptavidin binding for the samples containing 15 nm patches. This is corroborated by fluorescence bleaching analysis of biotin-Cy5 labeled streptavidin, showing 15 nm spots consisted of mostly single bleaching steps. This proof of concept presented herein should find tremendous use in patterning single biological molecules on-chip for devices associated with biosensing, spectroscopy, catalysis, and optics.
Supplementary Material
Figure 3.
Bleaching steps analysis of 15 and 64 nm hole mask patterns and sample raw bleaching data. Most of the 15 nm spots exhibit only single bleaching steps with a maximum of 2 steps, while the larger 64 nm spots show mostly 2 bleaching steps and a maximum of 4 steps. Example plots of fluorescence intensity versus a number of frames or time are shown above. The upper left plot shows a single bleaching step, indicative of a single fluorophore present, whereas the upper right plot shows multiple bleaching steps.
ACKNOWLEDGEMENTS
Chen and Gautam thank National Human Genome Research Institute of the National Institutes of Health Award Number R15HG009972. The content is solely the responsibility of the authors and does not necessarily represent the official views of the National Institutes of Health. Lum and Sagle thank Dr. Mario Vieweger and Prof. Peixin Guo for their help with initial fluorescence microscopy measurements and controls. The authors also thank Gabrielle Chiong for her assistance in making the TOC graphic.
Footnotes
SUPPORTING INFORMATION
Additional data on sample preparation, characterization, and control experiments are available free of charge via the Internet.
REFERENCES
- 1.Mrksich M and Whitesides GM, Trends Biotechnol, 1995, 13, 228–235. [Google Scholar]
- 2.Howell SW, Inerowicz HD, Fred E A. Regnier and Ron Reifenberger, Langmuir, 2003, 19, 436–439. [Google Scholar]
- 3.Cho EJ, Tao Z, Tehan EC and Bright FV, Anal. Chem, 2002, 74, 6177–6184. [DOI] [PubMed] [Google Scholar]
- 4.Asphahani F and Zhang M, Analyst, 2007, 132, 835–41. [DOI] [PMC free article] [PubMed] [Google Scholar]
- 5.Yu X, Song L, Petritis B, Bian X, Wang H, Viloria J, Park J, Bui H, Li H, Wang J, Liu L, Yang L, Duan H, McMurray DN, Achkar JM, Magee M, Qiu J and LaBaer J, Theranostics, 2017, 7, 4057–4070. [DOI] [PMC free article] [PubMed] [Google Scholar]
- 6.You C and Piehler J, Expert Opin. Drug Discov, 2016, 11, 105–119. [DOI] [PubMed] [Google Scholar]
- 7.Mateo C, Palomo JM, Fernandez-Lorente G, Guisan JM and Fernandez-Lafuente R, Enzyme Microb. Technol, 2007, 40, 1451–1463. [Google Scholar]
- 8.Wang Q, Lian X, Fang Y, Zhou H-C, Wang Q, Lian X, Fang Y and Zhou H-C, Catalysts, 2018, 8, 166. [Google Scholar]
- 9.Hou J, Li M and Song Y, Angew. Chemie Int. Ed, 2018, 57, 2544–2553. [DOI] [PubMed] [Google Scholar]
- 10.Campagnola PJ and Loew LM, Nat. Biotechnol, 2003, 21, 1356–1360. [DOI] [PubMed] [Google Scholar]
- 11.Qiuming Y and Golden G, Langmuir, 2007, 23, 8659–8662. [DOI] [PubMed] [Google Scholar]
- 12.Neumann L, Wohland T, Whelan RJ, Zare RN and Kobilka BK, ChemBioChem, 2002, 3, 993–998. [DOI] [PubMed] [Google Scholar]
- 13.Hengsakul M and Cass AEG, Bioconjug. Chem, 1996, 7, 249–254. [DOI] [PubMed] [Google Scholar]
- 14.Welch NG, Scoble JA, Muir BW and Pigram PJ, Biointerphases, 2017, 12, 02D301. [DOI] [PubMed] [Google Scholar]
- 15.Olmsted IR, Kussrow A and Bornhop DJ, Anal. Chem, 2012, 84, 10817–10822. [DOI] [PubMed] [Google Scholar]
- 16.Douzi B, in Methods in Molecular Biology, Humana Press, New York, NY, 2017, vol. 1615, pp. 257–275. [DOI] [PubMed] [Google Scholar]
- 17.Uetz P, Giot L, Cagney G, Mansfield TA, Judson RS, Knight JR, Lockshon D, Narayan V, Srinivasan M, Pochart P, Qureshi-Emili A, Li Y, Godwin B, Conover D, Kalbfleisch T, Vijayadamodar G, Yang M, Johnston M, Fields S and Rothberg JM, Nature, 2000, 403, 623–627. [DOI] [PubMed] [Google Scholar]
- 18.Koeller KM and Wong C-H, Nature, 2001, 409, 232–240. [DOI] [PubMed] [Google Scholar]
- 19.Chen P-Y, McKittrick J and Meyers MA, Prog. Mater. Sci, 2012, 57, 1492–1704. [Google Scholar]
- 20.Barber J, Chem. Soc. Rev, 2009, 38, 185–196. [DOI] [PubMed] [Google Scholar]
- 21.Koirala D, Shrestha P, Emura T, Hidaka K, Mandal S, Endo M, Sugiyama H and Mao H, Angew. Chemie Int. Ed, 2014, 53, 8137–8141. [DOI] [PubMed] [Google Scholar]
- 22.Ngo HT, Wang H-N, Burke T, Ginsburg GS and Vo-Dinh T, Anal. Bioanal. Chem, 2014, 406, 3335–3344. [DOI] [PubMed] [Google Scholar]
- 23.Palma M, Abramson JJ, Gorodetsky AA, Penzo E, Gonzalez RL, Sheetz MP, Nuckolls C, Hone J and Wind SJ, J. Am. Chem. Soc, 2011, 133, 7656–7659. [DOI] [PMC free article] [PubMed] [Google Scholar]
- 24.Lau UY, Saxer SS, Lee J, Bat E and Maynard HD, ACS Nano, 2016, 10, 723–729. [DOI] [PMC free article] [PubMed] [Google Scholar]
- 25.Schvartzman M, Palma M, Sable J, Abramson J, Hu X, Sheetz MP and Wind SJ, Nano Lett, 2011, 11, 1306–1312. [DOI] [PMC free article] [PubMed] [Google Scholar]
- 26.Michalet X, Weiss S and Jäger M, Chem. Rev, 2006, 106, 1785–1813. [DOI] [PMC free article] [PubMed] [Google Scholar]
- 27.Kawai S, Koch M, Gnecco E, Sadeghi A, Pawlak R, Glatzel T, Schwarz J, Goedecker S, Hecht S, Baratoff A, Grill L and Meyer E, Proc. Natl. Acad. Sci. U. S. A, 2014, 111, 3968–72. [DOI] [PMC free article] [PubMed] [Google Scholar]
- 28.Ariga K, Ji Q, Mori T, Naito M, Yamauchi Y, Abe H and Hill JP, Chem. Soc. Rev, 2013, 42, 6322. [DOI] [PubMed] [Google Scholar]
- 29.Renault JP, Bernard A, Bietsch A, Michel B, Bosshard HR, Delamarche E, Kreiter M, Hecht B and Wild UP, J. Phys. Chem. B, 2003, 107, 703–711. [Google Scholar]
- 30.Romanov V, Davidoff SN, Miles AR, Grainger DW, Gale BK and Brooks BD, Analyst, 2014, 139, 1303–1326. [DOI] [PubMed] [Google Scholar]
- 31.Kenseth JR, Harnisch JA, Jones VW and Porter MD, Langmuir, 2001, 17, 4105–4112. [Google Scholar]
- 32.Zhang G-J, Tanii T, Zako T, Hosaka T, Miyake T, Kanari Y, Funatsu T and Ohdomari I, Small, 2005, 1, 833–837. [DOI] [PubMed] [Google Scholar]
- 33.Ramakrishnan S, Subramaniam S, Stewart FA, Grundmeier G and Keller A, ACS Appl. Mater. Interfaces, 2016, 8, 31239–31247. [DOI] [PubMed] [Google Scholar]
- 34.Killops KL, Gupta N, Dimitriou MD, Lynd NA, Jung H, Tran H, Bang J and Campos LM, ACS Macro Lett, 2012, 1, 758–763. [DOI] [PubMed] [Google Scholar]
- 35.Kolodziej CM and Maynard HD, Chem. Mater, 2012, 24, 774–780. [Google Scholar]
- 36.Zhang G-J, Tanii T, Zako T, Hosaka T, Miyake T, Kanari Y, Funatsu T and Ohdomari I, Small, 2005, 1, 833–837. [DOI] [PubMed] [Google Scholar]
- 37.Min E, Wong KH and Stenzel MH, Adv. Mater, 2008, 20, 3550–3556. [Google Scholar]
- 38.Kumar N and Hahm J, Langmuir, 2005, 21, 6652–6655. [DOI] [PubMed] [Google Scholar]
- 39.Lee D-E, Ryu J, Hong D, Park S, Lee DH and Russell TP, ACS Nano, 2018, 12, 1642–1649. [DOI] [PubMed] [Google Scholar]
- 40.Fredriksson H, Alaverdyan Y, Dmitriev A, Langhammer C, Sutherland DS, Zäch M and Kasemo B, Adv. Mater, 2007, 19, 4297–4302. [Google Scholar]
- 41.Jokinen V, Suvanto P and Franssila S, Biomicrofluidics, 2012, 6, 16501–1650110. [DOI] [PMC free article] [PubMed] [Google Scholar]
- 42.Chen R, Hunt JA, Fawcett S, D’sa R, Akhtar R and Curran JM, J. Biomed. Mater. Res. Part A, 2018, 106, 1862–1877. [DOI] [PubMed] [Google Scholar]
- 43.Navarre S, Choplin F, Bousbaa J, Bennetau B, Nony L and Aimé J-P, Langmuir, 2001, 17, 4844–4850. [Google Scholar]
- 44.Giamblanco N, Marletta G, Graillot A, Bia N, Loubat C and Berret JF, ACS Omega, 2017, 2, 1309–1320. [DOI] [PMC free article] [PubMed] [Google Scholar]
- 45.Liu C, Leng W and Vikesland PJ, Environ. Sci. Technol, 2018, 52, 2726–2734. [DOI] [PubMed] [Google Scholar]
- 46.Vashist SK, Vashist and Kumar S, Diagnostics, 2012, 2, 23–33. [DOI] [PMC free article] [PubMed] [Google Scholar]
- 47.Caswell KK, Wilson JN, Bunz UHF and Murphy CJ, J. Am. Chem. Soc, 2003, 125, 13914–13915. [DOI] [PubMed] [Google Scholar]
Associated Data
This section collects any data citations, data availability statements, or supplementary materials included in this article.


