Abstract
Background
As the most malignant bone tumor globally, osteosarcoma has drawn increased attention. However, no studies have focused on the association between marital status and survival rate. The objectives of this study were to determine the association between marital and survival rate of osteosarcoma patients based on the SEER database.
Material/Methods
We enrolled a total of 2725 osteosarcoma patients between 1973 and 2015, including 1184 married, 154 divorced/separated, 136 widowed, and 1251 never-married patients. Survival rate was determined based on the Kaplan-Meier method in different marital subgroups. Multivariate Cox regression analysis was performed to explore independent prognostic factors.
Results
The 5-year overall survival (OS) and cancer-specific survival (CSS) rates of the married, separated/divorced, widowed, and never-married subjects were 45.93%, 41.39%, 19.08%, and 57.21% (OS), and 49.97%, 45.85%, 22.14%, and 60.69% (CSS), respectively. The survival outcome among subgroups exhibited a clear difference, with a log-rank test p-value <0.0001. Multivariate Cox regression showed that widowhood served as the independent prognostic factor for decreased OS rather than marriage (HR, 1.246; 95% CI, 1.011–1.536; p-value=0.039) and CSS (HR, 1.34; 95% CI, 1.07–1.68; p-value=0.01). Moreover, the OS and CSS in widowed patients were lower. Additionally, based on the propensity score matching (PSM) method, the prognosis of married patients was better than that of unmarried subjects.
Conclusions
Marital status was correlated with the survival rate, meaning that married patients had higher survival than widowed subjects, who had worse prognoses of osteosarcoma.
MeSH Keywords: Marital Status, Osteosarcoma, SEER Program, Survival Analysis
Background
Osteosarcoma is a common malignant bone tumor derived from primitive bone-formation mesenchymal cells, and is particularly prevalent in teenagers and young adults [1]. Osteosarcoma is an invasive tumor with a tendency to metastasize and invade adjacent tissues. Osteosarcoma accounts for 2.4% of all pediatric cancer patients and approximately 20% of patients with primary bone cancer, making it the 8th most common form of childhood cancer [1]. Age is associated with the survival rate, which is lowest in elderly subjects. Prior to 1970, treatment was mainly surgical resection. However, the prognosis of patients with local osteosarcoma was significantly improved by chemotherapy [2]. Various immunotherapies have been used in osteosarcoma patients since the 1880s, and some patients have shown a response to treatment [3,4]. Despite progress in treatment strategies combining surgery and chemotherapy, the postoperative outcome remains poor for most patients with metastatic or recurrent osteosarcoma [5].
A variety of prognostic variables have been explored for osteosarcoma [6], but the outcomes have not significantly improved. In recent years, marital status has become recognized as an independent prognostic factor for survival; married patients tend to have better survival, including those with epithelial ovarian cancer [7], renal cell cancer [8], and soft tissue sarcoma [9]. Specific interventions should be applied for unmarried subjects to increase their opportunities for early diagnosis of all cancers, which would narrow the health disparities between married and unmarried people [10]. However, there have been no studies on how marital status affects the survival of osteosarcoma patients.
The Surveillance, Epidemiology, and End Results (SEER) database, funded by the National Cancer Institute (NCI), has been broadly applied in cancer research and used to explore developments in rare cancers, secondary malignancies, epidemiology, treatments, and outcomes [11,12]. The incidence, prevalence, and survival information on cancers in the database were collected from U.S. cancer registries, and the database has been utilized for thousands of studies, including those on colorectal cancer [13], non-small cell lung cancer [14], gastric cancer [15], and breast cancer [16]. Recently, it has been reported that marital status can independently predict the survival of patients with various cancers, such as colorectal cancer [17], gastric cancer [18,19], nasopharyngeal carcinoma [20], and liver cancer [21].
The objective of the present study was to investigate the effects of marital status on the survival rates of patients with osteosarcoma based on SEER. The prognostic role played by marital status in osteosarcoma survival was clarified using a comprehensive analysis based on population. We enrolled a total of 2725 osteosarcoma patients between 1973 and 2015, including 1184 married, 154 divorced/separated, 136 widowed, and 1251 never-married patients. The 5-year OS and CSS rates of the married, separated/divorced, widowed, and never-married subjects were 45.93%, 41.39%, 19.08%, and 57.21% for OS and 49.97%, 45.85%, 22.14%, and 60.69% for CSS, respectively. The survival outcome of OS and CSS among the 4 marital subgroups exhibited an obvious difference, with a log-rank test p-value less than 0.0001. Multivariate Cox regression analysis showed that in, comparison with marriage, widowhood can serve as independent predictor of poor OS (HR, 1.246; 95% CI, 1.011–1.536; p-value=0.039) and CSS rate (HR, 1.34; 95% CI, 1.07–1.68; p-value=0.01). Moreover, the OS and CSS of widowed patients in all tumor grade groups were worse than those of other patients. In addition, based on the PSM method, the prognosis exhibited by married patients was still better than that of unmarried patients. Thus, there is a correlation between marital status and survival rates of both OS and CSS in patients with osteosarcoma based on research in a large population. In particular, the married subjects exhibited better postoperative outcomes than the widowed ones.
Material and Methods
Data sources
All data were acquired from the SEER database [22], which is commonly utilized as a collection of the cancer incidence information from population-based registries consisting of approximately 34.6% of the U.S. population from 1973 to 2015. SEER data include patient demographics, primary tumor site, tumor morphology, stage at diagnosis, and follow-up with patients for vital status.
Data screening
The following items were the inclusion criteria: 1) International Classification of Diseases for Oncology, 3rd edition (ICD-O-3): C40.0–C40.3, C40.8–C40.9, C41.0–C41.4, and C41.8–C41.9 between 1973 and 2015; 2) ICCC site recode ICD-O-3/WHO 2008: VIII(a) osteosarcomas; 3) patients no younger than 18 years old when diagnosed; 4) patients with clear marital status; 5) patients with one primary diagnosis only; 6) known survival time longer than 0 months; and 7) known cause of death and vital status. Figure 1 indicates the data screening schemes.
Figure 1.
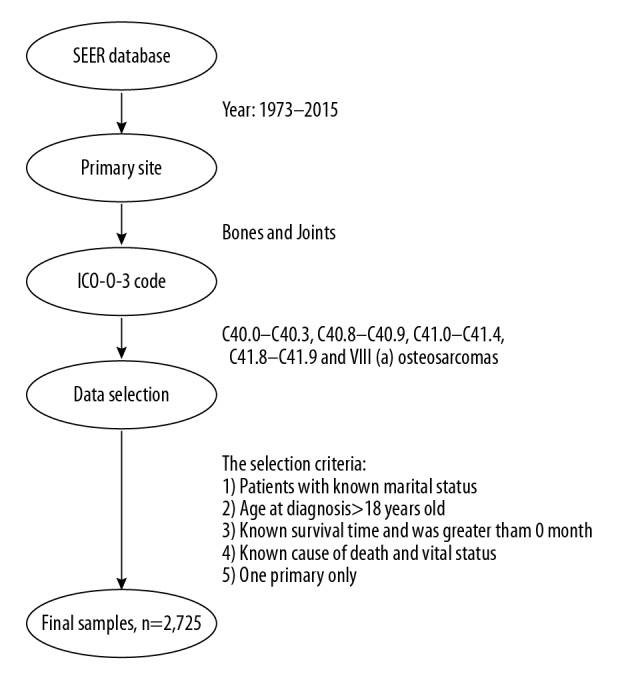
The data selection steps of the present study.
The variables in this research
The following variables were collected from the SEER database: insurance record, marital status, age at diagnosis, race, sex, diagnosis time, pathological grade, TNM phase, SEER stage, conditions of operation, chemotherapy and radiation circumstances, vital status, cause of death, and survival time. In this study, there were 4 types of marital status: married, divorced/separated, widowed, and never-married. We divided patients into 2 groups according to age at diagnosis (<50 and ≥50). There were 4 kinds of race: white, black, unknown race, and other (including Asian/Pacific Islander and American Indian/Alaska Native). Year of diagnosis was grouped into 3 categories (1973–1987, 1988–2001, and 2002–2015). Tumor grade was separated to 5 levels: benign, moderate, poor, undifferentiated, and unknown. SEER stage was described as localized, regional, distant, and unknown.
Statistical analyses
The chi-square test was used to summarize and compare osteosarcoma patients in different marital status groups regarding their baseline characteristics. OS and CSS constituted the endpoints in the study. Kaplan-Meier survival analysis based on the log-rank test was used to identify differences in survival rates. The recognition of prognostic variables for OS and CSS in the subjects relied on the univariate/multivariate Cox regression models, which revealed the hazard ratios (HRs) and exact 95% confidence intervals (CIs). To minimize the differences in covariates between groups, we performed a 1: 1 PSM analysis of married and unmarried patients. The p-value was two-sided, and p<0.05 was deemed as statistical significance. SPSS version 23.0 (SPSS, Inc., Chicago, IL, USA) was utilized for all statistical analyses. All figures were created using R language.
Results
Baseline demographic and clinical characteristics
A total of 2725 osteosarcoma patients from 1973 to 2015 were investigated; 1539 (56.48%) were male and 1186 (43.52%) were female. Among these patients, 1184 (43.45%) were married, 154 (5.65%) were divorced/separated, 136 (4.99%) were widowed, and 1251 (45.91%) were never married. As shown in Table 1, the results summarize each variable as well as the relation between the variable and marital status. Using the chi-square test, we found significant differences in demographics and characteristics among the 4 marital groups. Compared with other marital statuses, widowed patients were more likely to be older than 50 years old (94.12%); however, the majority of the never-married patients were younger than 50 years old (92.33%). The proportion of female patients in the widowed group was 77.21%, and males accounted for 62.19% of the never-married group. Moreover, white patients accounted for a larger proportion in each group, while black patients represented a slightly larger proportion of the never-married group (13.50%) in comparison with others. With respect to the year of diagnosis, patients diagnosed from 2002 to 2015 accounted for the majority of each marital group. The proportion of divorced/separated patients being diagnosed was 23.38% at stage II and 10.39% at stage IV, while the proportion of never-married patients diagnosed was 9.99% at stage I. In addition, other demographics, including tumor grade (p-value <0.001), surgery status (p-value <0.001), chemotherapy (p-value <0.001), and radiotherapy (p-value <0.001), were also statistically significant.
Table 1.
Baseline characteristics of osteosarcoma patients (n, %).
| Characteristics | Total | Married | Divorced/Separated | Widowed | Never married | p-Valuea |
|---|---|---|---|---|---|---|
| Marital status | 2725 (100.00) | 1184 (43.45) | 154 (5.65) | 136 (4.99) | 1251 (45.91) | |
| Age | <.001 | |||||
| <50 | 1929 (70.79) | 687 (58.02) | 79 (51.30) | 8 (5.88) | 1155 (92.33) | |
| ≥50 | 796 (29.21) | 497 (41.98) | 75 (48.70) | 128 (94.12) | 96 (7.67) | |
| Sex | <.001 | |||||
| Male | 1539 (56.48) | 656 (55.41) | 74 (48.05) | 31 (22.79) | 778 (62.19) | |
| Female | 1186 (43.52) | 528 (44.59) | 80 (51.95) | 105 (77.21) | 473 (37.81) | |
| Race | <.001 | |||||
| White | 2100 (77.06) | 952 (80.41) | 117 (75.97) | 115 (84.56) | 916 (73.22) | |
| Black | 381 (13.98) | 115 (9.71) | 29 (18.83) | 17 (12.50) | 220 (17.59) | |
| Othersb | 234 (8.59) | 113 (9.54) | 6 (3.90) | 4 (2.94) | 111 (8.87) | |
| Unknown | 10 (0.37) | 4 (0.34) | 2 (1.30) | 0 (0.00) | 4 (0.32) | |
| Diagnosis year | <.001 | |||||
| 1973–1987 | 428 (15.71) | 221 (18.67) | 23 (14.94) | 40 (29.41) | 144 (11.51) | |
| 1988–2001 | 743 (27.27) | 341 (28.80) | 37 (24.03) | 38 (27.94) | 327 (26.14) | |
| 2002–2015 | 1,554 (57.03) | 622 (52.53) | 94 (61.04) | 58 (42.65) | 780 (62.35) | |
| Insurance status | <.001 | |||||
| Insured | 903 (33.14) | 371 (31.33) | 58 (37.66) | 24 (17.65) | 450 (35.97) | |
| Uninsured | 60 (2.20) | 10 (0.84) | 3 (1.95) | 1 (0.74) | 46 (3.68) | |
| Unknown | 1,762 (64.66) | 803 (67.82) | 93 (60.39) | 111 (81.62) | 755 (60.35) | |
| Grade | <.001 | |||||
| Well | 159 (5.83) | 70 (5.91) | 8 (5.19) | 5 (3.68) | 76 (6.08) | |
| Moderately | 215 (7.89) | 88 (7.43) | 20 (12.99) | 3 (2.21) | 104 (8.31) | |
| Poorly | 500 (18.35) | 221 (18.67) | 24 (15.58) | 25 (18.38) | 230 (18.39) | |
| Undifferentiated | 902 (33.10) | 385 (32.52) | 49 (31.82) | 26 (19.12) | 442 (35.33) | |
| Unknown | 949 (34.83) | 420 (35.47) | 53 (34.42) | 77 (56.62) | 399 (31.89) | |
| TNM stage | 0.004 | |||||
| I | 232 (8.51) | 88 (7.43) | 13 (8.44) | 6 (4.41) | 125 (9.99) | |
| II | 555 (20.37) | 224 (18.92) | 36 (23.38) | 16 (11.76) | 279 (22.30) | |
| III | 20 (0.73) | 10 (0.84) | 1 (0.65) | 0 (0.00) | 9 (0.72) | |
| IV | 238 (8.73) | 94 (7.94) | 16 (10.39) | 13 (9.56) | 115 (9.19) | |
| Unknown | 1680 (61.65) | 768 (64.86) | 88 (57.14) | 101 (74.26) | 723 (57.79) | |
| SEER stage | 0.391 | |||||
| Localized | 113 (4.15) | 51 (4.31) | 4 (2.60) | 4 (2.94) | 54 (4.32) | |
| Regional | 137 (5.03) | 59 (4.98) | 4 (2.60) | 6 (4.41) | 68 (5.44) | |
| Distant | 77 (2.83) | 27 (2.28) | 8 (5.19) | 6 (4.41) | 36 (2.88) | |
| Unknown | 2389 (88.00) | 1,047 (88.43) | 138 (89.61) | 120 (88.24) | 1093 (87.37) | |
| Surgery | <.001 | |||||
| No | 569 (20.88) | 240 (20.27) | 44 (28.57) | 58 (42.65) | 227 (18.15) | |
| Yes | 2119 (77.76) | 923 (77.96) | 105 (68.18) | 75 (55.15) | 1016 (81.22) | |
| Unknown | 37 (1.36) | 21 (1.77) | 5 (3.25) | 3 (2.21) | 8 (0.64) | |
| Chemotherapy | <.001 | |||||
| No | 954 (35.01) | 474 (40.03) | 57 (37.01) | 104 (76.47) | 319 (25.50) | |
| Yes | 1,771 (64.99) | 710 (59.97) | 97 (62.99) | 32 (23.53) | 932 (74.50) | |
| Radiotherapy | <.001 | |||||
| No | 2470 (90.64) | 1046 (88.34) | 139 (90.26) | 117 (86.03) | 1,168 (93.37) | |
| Yes | 255 (9.36) | 138 (11.66) | 15 (9.74) | 19 (13.97) | 83 (6.63) |
The p-values were compared married, divorced/separated, widowed, and never married calculated with the use of a chi-square test;
Other race (American Indian/AK Native, Asian/Pacific Islander).
Role of marital status in the OS and CSS of osteosarcoma
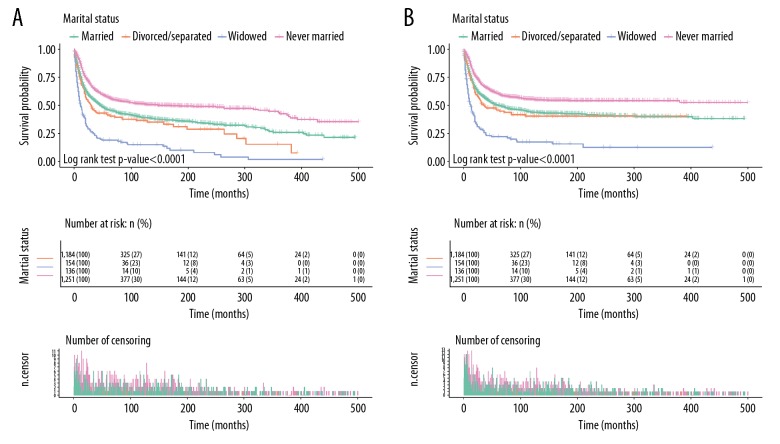
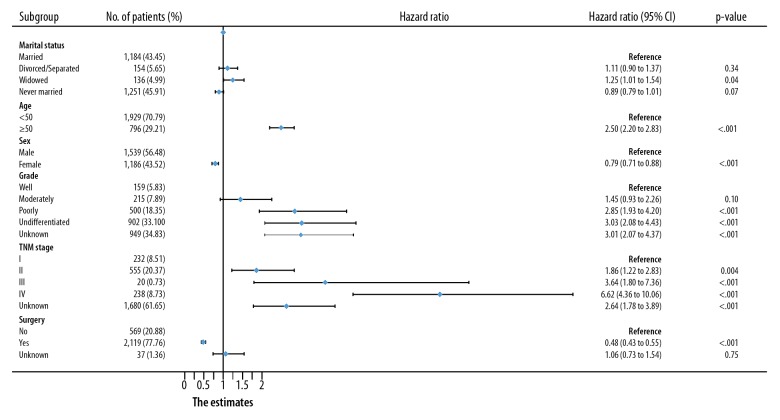
Figure 2 shows the results of OS and CSS of osteosarcoma calculated by Kaplan-Meier analysis. The 5-year OS rate of the married subjects was 45.93%, while the separated/divorced, widowed, and never-married groups had rates of 41.39%, 19.08%, and 57.21%, respectively. As shown in Figure 2A, the survival outcome of OS among the 4 marital subgroups demonstrated a significant difference, with a log-rank test p-value less than 0.0001. Aside from marital status, age, sex, tumor grade, TNM phase, and operation were also proven to be strongly correlated with OS in Kaplan-Meier analysis (Table 2). Multivariate Cox analysis comparing marriage vs. widowhood (HR, 1.246; 95% CI, 1.011–1.536; p-value=0.039) showed that being widowed was an independent prognostic factor for poor OS.
Figure 2.
Kaplan-Meier survival plots exhibited by osteosarcoma patients based on marital status. (A) OS. (B) CSS.
Table 2.
Univariate analyses of overall survival (OS) and cancer-specific survival (CSS).
| Variables | OS | CSS | ||||
|---|---|---|---|---|---|---|
| 5-year OS |(%) | Univariate analysis | 5-year CSS (%) | Univariate analysis | |||
| Log-rank χ2 test | p-Valuea | Log-rank χ2 test | p-Valuea | |||
| Marital status | 179.80 | <.001 | 157.27 | <.001 | ||
| Married | 45.93 | 49.97 | ||||
| Divorced/Separated | 41.39 | 45.85 | ||||
| Widowed | 19.08 | 22.14 | ||||
| Never married | 57.21 | 60.69 | ||||
| Age | 502.70 | <.001 | 359.36 | <.001 | ||
| <50 | 59.58 | 62.30 | ||||
| ≥50 | 24.54 | 29.86 | ||||
| Sex | 14.09 | <.001 | 11.84 | 0.001 | ||
| Male | 46.07 | 50.00 | ||||
| Female | 53.82 | 57.49 | ||||
| Grade | 165.59 | <.001 | 147.19 | <.001 | ||
| Well | 85.35 | 87.31 | ||||
| Moderately | 78.85 | 80.26 | ||||
| Poorly | 48.44 | 53.21 | ||||
| Undifferentiated | 48.11 | 51.48 | ||||
| Unknown | 39.22 | 43.61 | ||||
| TNM stage | 395.76 | <.001 | 395.59 | <.001 | ||
| I | 84.66 | 87.88 | ||||
| II | 59.95 | 63.43 | ||||
| III | 40.53 | 43.42 | ||||
| IV | 9.79 | 11.24 | ||||
| Unknown | 47.79 | 51.79 | ||||
| Surgery | 431.45 | <.001 | 366.54 | <.001 | ||
| No | 21.42 | 25.64 | ||||
| Yes | 57.54 | 60.83 | ||||
| Unknown | 15.24 | 20.86 | ||||
The p-values compared married, divorced/separated, widowed, and never married calculated with the use of a log-rank χ2 test.
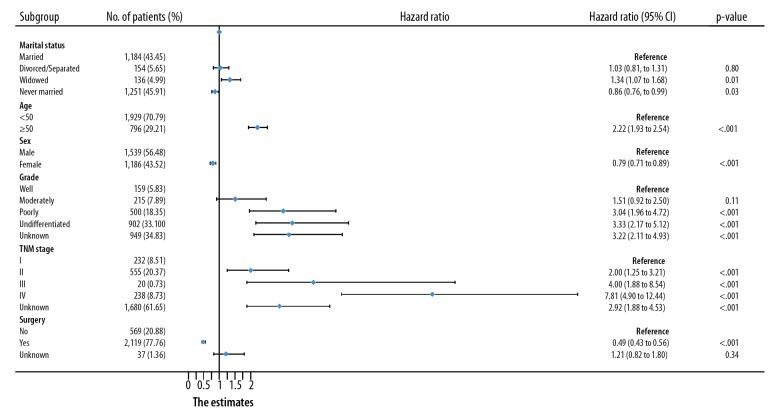
Moreover, the married group exhibited a 5-year CSS rate of 49.97%, while the separated/divorced, widowed, and never-married groups had 5-year CSS rates of 45.85%, 22.14%, and 60.69%, respectively. The survival rate of the widowed subjects was the lowest and the survival time was the shortest (p-value <0.0001, Figure 2B). For CSS, multivariate Cox analysis revealed in that, in contrast with marriage, widowhood (HR, 1.34; 95% CI, 1.07–1.68; p-value=0.01) and spinsterhood (HR, 0.86; 95% CI, 0.76–0.99; p-value=0.03) may be independently predictors of poor prognosis.
In addition, for both OS and CSS, we found the following: the hazard ratio increased with increasing age and tumor grade; the hazard ratio increased with advancing TNM stage at diagnosis; and the prognostic outcomes of subjects undergoing operations were better than that of subjects without surgeries (Figures 3, 4).
Figure 3.
Multivariate Cox analysis of OS in osteosarcoma patients by forest plots. The X-axis shows the hazard ratio and 95% CI of each subgroup, ticks follow the arrangement of 0, 0.25, 0.5, 0.75, 1.0, 1.25, 1.5, 1.75, and 2.0.
Figure 4.
Multivariate Cox analysis of CSS in osteosarcoma patients by forest plots. The X-axis shows the hazard ratio and 95% CI of each subgroup, ticks follow the arrangement of 0, 0.25, 0.5, 0.75, 1.0, 1.25, 1.5, 1.75, and 2.0.
Analyses of subgroups based on tumor grades
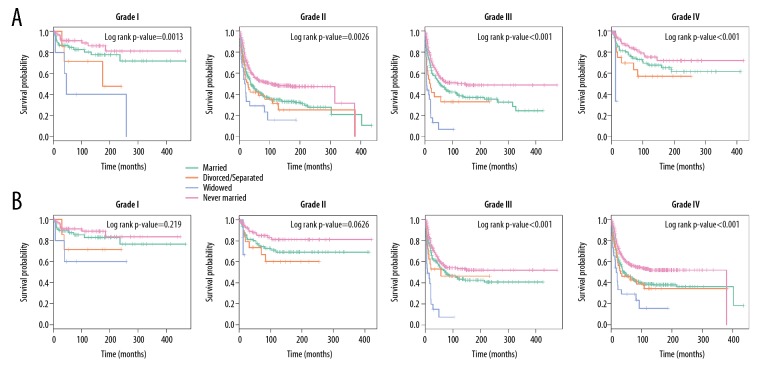
Based on Kaplan-Meier analysis, the OS and CSS of osteosarcoma patients in different tumor-grade subgroups were determined (Figures 5A, 5B), showing that the OS and CSS of widowed subjects in all tumor-grade subgroups were worse than that of others. The mortality rate of widowed patients was the highest for OS and CSS, regardless of tumor grades. For patients who were in grade I, the 5-year OS of widowed patients was remarkably worse than that of married, divorced/separated, and never-married patients (5-year OS rate: 84.76%, 71.43%, 40.00%, and 91.11% for married, divorced/separated, widowed, and never-married subjects, respectively). For grade II, there was a remarkable decrease in the 5-year OS of widowed subjects (5-year OS rate: 75.83%, 69.64%, 33.33%, and 83.93%, respectively). For grade III and IV, widowed subjects also had poor 5-year OS (for grade III, 5-year OS rate: 48.18%, 32.81%, 6.60%, and 54.92%, respectively; for grade IV, 5-year OS rate: 42.99%, 42.04%, 28.99%, and 54.48%, respectively).
Figure 5.
Subgroup analyses on osteosarcoma patients stratified by tumor grade. (A) OS. (B) CSS.
Nevertheless, for grades I and II, there was no conspicuous difference in CSS. However, in grades III and IV, the 5-year OS of widowed subjects was markedly lower compared with others (p-value <0.001 in the log-rank analysis, Figure 5B).
Other subgroup analyses on how marital status affects the OS and CSS of osteosarcoma patients
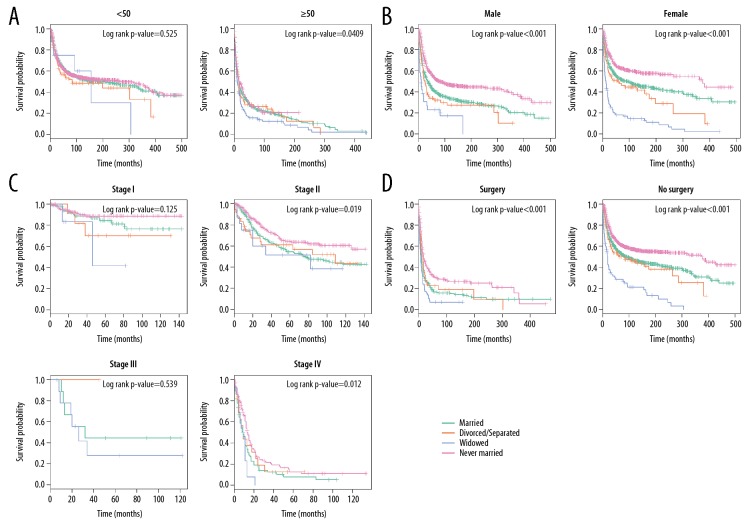
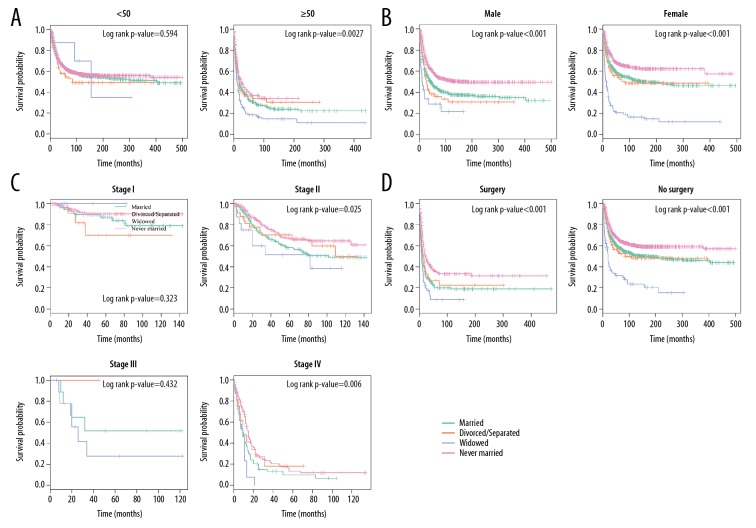
Many variables were identified by multivariate Cox regression model analysis as risk factors for mortality, including age, sex, TNM stage, and surgery. We then further explored how marital status affects the OS and CSS stratified by the above variables. In determining how marital status affects survival in each age subgroup, we observed that, except for patients <50 years old, widowed status remarkably increased mortality rates for both the CSS and OS (Figures 6A, 7A).
Figure 6.
Other subgroup analysis on how marital status affects OS among osteosarcoma patients. (A) Age at diagnosis. (B) Sex. (C) TNM stage. (D) Surgery status.
Figure 7.
Other subgroup analysis of the effects of marital statuses on CSS among osteosarcoma patients. (A) Age at diagnosis. (B) Sex. (C) TNM stage. (D) Surgery status.
Next, we explored the role of sex and found that marital status was closely associated with OS and CSS in both male and female groups (log-rank p-value <0.001, Figures 6B, 7B). As shown in Figures 6C and 7C, in TNM stage II and IV subgroups, marital status influenced OS more strongly than it influenced CSS and showed a stronger effect on surgery status (log-rank p-value <0.001, Figures 6D, 7D).
Propensity score matching and survival analysis
To avoid potential differences in basic characteristics between the married patients and others, and to confirm the reliability and accuracy of this study, propensity score matching (PSM) was conducted in the 1: 1 matched-paired cohort. By performing PSM, a good balance among sex, age, race, insurance, diagnosis year, tumor grade, TNM phase SEER stage, chemotherapy, operation conditions and radiotherapy could be established for the distribution (p-value >0.05 in the Pearson χ2 test). Ultimately, we obtained 1274 patients, including 637 married and 637 unmarried patients. The clinicopathological and demographic characteristics of the groups are displayed in Table 3. In addition to exactly matched covariates with the same value (p-value=1), other factors, including year of diagnosis (p-value=0.998), grade (p-value=0.623), TNM stage (p-value=0.999), SEER stage (p-value=0.915), and chemotherapy (p-value=0.951), did not significantly differ.
Table 3.
Baseline characteristics of osteosarcoma patients by marital status in 1: 1 matched group (n, %).
| Characteristics | Total | Married | Unmarried | p-Valuea |
|---|---|---|---|---|
| Marital status | 1274 (100.00) | 637 (50.00) | 637 (50.00) | |
| Age | 1 | |||
| <50 | 1122 (88.07) | 561 (88.07) | 561 (88.07) | |
| ≥50 | 152 (11.93) | 76 (11.93) | 76 (11.93) | |
| Sex | 1 | |||
| Male | 692 (54.32) | 346 (54.32) | 346 (54.32) | |
| Female | 582 (45.68) | 291 (45.68) | 291 (45.68) | |
| Race | 1 | |||
| White | 1032 (81.00) | 516 (81.00) | 516 (81.00) | |
| Black | 140 (10.99) | 70 (10.99) | 70 (10.99) | |
| Othersb | 102 (8.01) | 51 (8.01) | 51 (8.01) | |
| Diagnosis year | 0.998 | |||
| 1973–1987 | 182 (14.29) | 91 (14.29) | 91 (14.29) | |
| 1988–2001 | 429 (33.67) | 215 (33.75) | 214 (33.59) | |
| 2002–2015 | 663 (52.04) | 331 (51.96) | 332 (52.12) | |
| Insurance status | 1 | |||
| Insured | 391 (30.69) | 195 (30.61) | 196 (30.77) | |
| Uninsured | 7 (0.55) | 4 (0.63) | 3 (0.47) | |
| Unknown | 876 (68.76) | 438 (68.76) | 438 (68.76) | |
| Grade | 0.623 | |||
| Well | 90 (7.06) | 48 (7.54) | 42 (6.59) | |
| Moderately | 106 (8.32) | 56 (8.79) | 50 (7.85) | |
| Poorly | 233 (18.29) | 107 (16.80) | 126 (19.78) | |
| Undifferentiated | 440 (34.54) | 218 (34.22) | 222 (34.85) | |
| Unknown | 405 (31.79) | 208 (32.65) | 197 (30.93) | |
| TNM stage | 0.999 | |||
| I | 93 (7.30) | 46 (7.22) | 47 (7.38) | |
| II | 274 (21.51) | 137 (21.51) | 137 (21.51) | |
| III | 6 (0.47) | 3 (0.47) | 3 (0.47) | |
| IV | 76 (5.97) | 39 (6.12) | 37 (5.81) | |
| Unknown | 825 (64.76) | 412 (64.68) | 413 (64.84) | |
| SEER stage | 0.915 | |||
| Localized | 67 (5.26) | 33 (5.18) | 34 (5.34) | |
| Regional | 59 (4.63) | 27 (4.24) | 32 (5.02) | |
| Distant | 29 (2.28) | 14 (2.20) | 15 (2.35) | |
| Unknown | 1119 (87.83) | 563 (88.38) | 556 (87.28) | |
| Surgery | 1 | |||
| No | 182 (14.29) | 91 (14.29) | 91 (14.29) | |
| Yes | 1085 (85.16) | 543 (85.24) | 542 (85.09) | |
| Unknown | 7 (0.55) | 3 (0.47) | 4 (0.63) | |
| Chemotherapy | 0.951 | |||
| No | 384 (30.14) | 191 (29.98) | 193 (30.30) | |
| Yes | 890 (69.86) | 446 (70.02) | 444 (69.70) | |
| Radiotherapy | 1 | |||
| No | 1192 (93.56) | 595 (93.41) | 597 (93.72) | |
| Yes | 82 (6.44) | 42 (6.59) | 40 (6.28) |
The p-values compared married, divorced/separated, widowed, and never married calculated with the use of a chi-square test;
Other race (American Indian/AK Native, Asian/Pacific Islander).
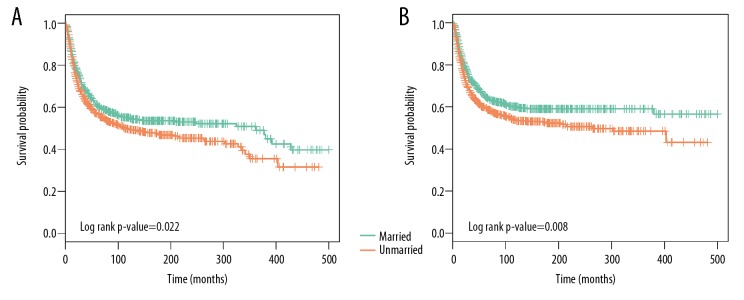
Survival analysis indicated that surgeries for married patients were more effective than for unmarried ones. Figure 8A shows that the 5-year OS rate of the married subjects was 61.22% and that of the unmarried group was 56.66% (p-value=0.022 in log-rank analysis). Similarly, married patients had a 5-year CSS rate of 65.47%, while unmarried patients had a 5-year CSS rate of 59.57% (log-rank p-value=0.008, Figure 8B).
Figure 8.
Kaplan-Meier survival curves exhibited by the osteosarcoma patients based on marital status after PSM. (A) OS. (B) CSS.
To verify the data reliability, we performed multivariate Cox proportional hazards regression analysis. Although the parameters in the 2 groups were similar (Table 4) spinsterhood independently affects both CSS (HR: 1.307, 95% CI: 1.093–1.562, p-value=0.003) and OS (HR: 1.254, 95% CI: 1.064–1.479, p-value=0.007).
Table 4.
multivariate Cox proportional hazards regression analysis of OS and CSS for patients after PSM.
| Variables | OS | CSS | ||||
|---|---|---|---|---|---|---|
| 5-year OS (%) | HR (95% CI) | p-Value | 5-year CSS (%) | HR (95% CI) | p-Value | |
| Marital status | ||||||
| Married | 61.22 | Reference | 65.47 | Reference | ||
| Unmarried | 56.66 | 1.254 (1.064–1.479) | 0.007 | 59.57 | 1.307 (1.093–1.562) | 0.003 |
Discussion
We assessed the prognostic significance of marriage status on the survival rate of osteosarcoma patients according to integrated population-based analysis using the SEER database. Four marital subgroups exhibited distinct survival performances of OS and CSS. Multivariate Cox regression analysis showed that, in contrast to being married, widowhood is an independent predictor of poor OS and CSS. Additionally, the OS and CSS of widowed subjects in all tumor- grade subgroups were significantly lower compared to others. In addition, based on the PSM method, the prognosis of married patients was still better than that of unmarried patients. Consequently, marital status was associated with both OS and CSS in osteosarcoma.
It has recently been reported in many studies that marital status independently predicts the survival of patients with various cancers. For example, Wang et al. [7] explored the relationship between marital status and survival performance by investigating the epithelial ovarian cancer data acquired from the SEER database. In the study, 10 905 epithelial ovarian cancer (EOC) patients were extracted from 2004 to 2012. The chi-square test was used to identify the relationship between marital status and other clinical parameters. The Kaplan-Meier test was used to compare survival curves of different groups. According to the above results, marital status is an independent predictor of OS and CSS. The prognosis of widowed patients was worse than that of other groups under most conditions. In an esophageal cancer study [23] of patients diagnosed from 1973 to 2013 Cox regression analysis suggested in, in comparison with the married groups, there were higher risks of death for the unmarried, divorced/separated, and widowed groups for all aspects. In another study of astrocytoma based on SEER, Xie et al. [24] indicated that the OS and CSS of married patients tended to be the highest, while for other subgroups, divorced/separated or widowed patients had worse CSS. Furthermore, according to the subgroup analyses, there was no significant difference in the CSS between the single and married women. Miao et al. investigated 112 860 patients with kidney cancer diagnosed from 2004 to 2013 to explore the association of marital status with survival rates of patients [25]. They found that the 5-year OS and CSS of married patients were better than those of widowed, divorced/separated, and single patients. The OS and CSS of unmarried patients were much higher, especially compared to those of widowed patients. There are many similar reports in the recent literature regarding several other types of cancers, such as chondrosarcoma [26], oral cavity squamous cell carcinoma [27], gastric cancer [28], breast cancer [29], testicular cancer [30], and nasopharyngeal carcinoma [31].
Our findings are in part consistency with previous findings in other types of cancers. Specifically, widowed subjects were proven to exhibit worse survival than others, and the 5-year OS and CSS in the widowed group were only 19.08% and 22.14%, respectively. The multivariate Cox analysis showed that, in contrast to married patients, widowed status is an independent potential indicator for poor OS and CSS. Nevertheless, compared to other research, widowed status is an independent prognostic variable for poor OS and CSS only based on multivariate Cox analysis.
Never-married patients were most likely to be male (62.19%), and widowed patients were most likely to be female (77.21%). Interestingly, the 5-year OS and CSS were the highest in married patients, and were slightly higher than those of never-married patients. This finding was also reported in another study [7]. This result emerged because the majority of the never-married group were below are 50 years (92.33%), which is the age at which any signs of illness should be fully visible. In subgroup analysis, different survival outcomes of OS were observed in all tumor grades; however, significant differences were only observed in grades III and IV of CSS. The most important reason may be that the cause of death in grade I and II patients may not be directly due to cancer. In addition, significantly different survival outcomes of OS and CSS were found in subgroups of patients older than 50 years, as well as those in stage II and IV. The major reasons may be the limited sample sizes of patients <50 years old and in stage III.
There may be various underlying mechanisms by which marital status affects patient survival. Generally, differences in access to medical treatment may be the biggest reason. Marriage, which is a main source of social support, can make patients more likely to seek medical treatments [32]. Individuals who report higher social support satisfaction are at lower risk than individuals with lower reported satisfaction [33]. The psychological distress of cancer patients may also play an important role. It has been demonstrated that emotional burdens tend be shared for married subjects, which can lead to better survival [8,34].
Although it this is not the first study analyzing differences in survival rates of cancers between patients with different marital statuses, it is the first such study in patients with osteosarcoma. Moreover, we have not simply replicated previous studies. A variety of analytical methods, including chi-square test, univariate and multivariate Cox regression, subgroup analysis, and PSM analysis, were utilized in this study to determine the relationship between marital status and prognosis of osteosarcoma patients. We found a clear correlation between marital status and OS and CSS in osteosarcoma patients. We also assessed the published literature on marital status and survival and compared it with our results (Supplementary Table 1).
The SEER database allowed us to perform large-scale studies based on a large population. However, it is necessary to address some important limitations. First, further analysis is needed to assess the role played by marital status in osteosarcoma survival after diagnosis because causality cannot be inferred since the study was based on observation. Second, some patients have a long follow-up period, so marital status may change during the study period.
In conclusion, marital status was associated with OS and CSS among osteosarcoma patients in this large population-based study. How marital status affects osteosarcoma survival highlights the importance of social support in improving outcomes in this population.
Conclusions
Marital status showed an association with survival (both OS and CSS) among osteosarcoma patients in this large population-based study. Importantly, married patients had better survival outcomes, while widowed patients tended to have worse osteosarcoma prognosis.
Supplementary Data
Supplementary Table 1.
The comparisons of published literatures about marital status in survival and the existing paper.
| Cancer type | Sample size | Methods | Reference |
|---|---|---|---|
| Osteosarcoma | 2 725 | chi-square tests, univariate and multivariate Cox regression, subgroup analysis, and PSM analysis | This study |
| Epithelial ovarian cancer | 10 905 | chi-square tests, multivariate Cox regression, and subgroup analysis | Wang et al. |
| Renal cell carcinoma | 97 662 | chi-square tests, univariate and multivariate Cox regression, and subgroup analysis | Li et al. |
| Soft tissue sarcoma | 18 013 | chi-square tests, univariate and multivariate Cox regression, subgroup analysis, and PSM analysis | Zhang et al. |
| Rectal cancer | 27 498 | chi-square tests, univariate and multivariate Cox regression, and subgroup analysis | Wang et al. |
| Non-small cell lung cancer | 70 006 | chi-square tests, univariate and multivariate Cox regression, and subgroup analysis | Wu et al. |
| Oral cavity squamous cell carcinoma | 11 022 | chi-square tests, univariate and multivariate Cox regression, subgroup analysis, and PSM analysis | Shi et al. |
| Chondrosarcoma | 4 502 | chi-square tests, univariate and multivariate Cox regression, and subgroup analysis | Gao et al. |
| Astrocytoma | 43 324 | chi-square tests, univariate and multivariate Cox regression, and subgroup analysis | Xie et al. |
Acknowledgement
We gratefully thank the Department of Orthopedics of the First Hospital of China Medical University for technical assistance. We thank American Journal Experts (https://www.aje.cn/) for editing this manuscript.
Footnotes
Conflicts of interest
None.
Source of support: This work was supported by the Natural Science Foundation of China (grants 81271939 and 81472044)
References
- 1.Ottaviani G, Jaffe N. The epidemiology of osteosarcoma. Cancer Treat Res. 2009;152:3–13. doi: 10.1007/978-1-4419-0284-9_1. [DOI] [PubMed] [Google Scholar]
- 2.Isakoff MS, Bielack SS, Meltzer P, Gorlick R. Osteosarcoma: Current treatment and a collaborative pathway to success. J Clin Oncol. 2015;33(27):3029–35. doi: 10.1200/JCO.2014.59.4895. [DOI] [PMC free article] [PubMed] [Google Scholar]
- 3.Miwa S, Shirai T, Yamamoto N, et al. Current and emerging targets in immunotherapy for osteosarcoma. J Oncol. 2019;2019 doi: 10.1155/2019/7035045. 7035045. [DOI] [PMC free article] [PubMed] [Google Scholar]
- 4.Zhang Y, Yang J, Zhao N, et al. Progress in the chemotherapeutic treatment of osteosarcoma. Oncol Lett. 2018;16(5):6228–37. doi: 10.3892/ol.2018.9434. [DOI] [PMC free article] [PubMed] [Google Scholar]
- 5.Li Z, Dou P, Liu T, He S. Application of long noncoding RNAs in osteosarcoma: Biomarkers and therapeutic targets. Cell Physiol Biochem. 2017;42(4):1407–19. doi: 10.1159/000479205. [DOI] [PubMed] [Google Scholar]
- 6.Zamborsky R, Kokavec M, Harsanyi S, Danisovic L. Identification of prognostic and predictive osteosarcoma biomarkers. Med Sci (Basel) 2019;7(2) doi: 10.3390/medsci7020028. pii: E28. [DOI] [PMC free article] [PubMed] [Google Scholar]
- 7.Wang X, Li X, Su S, Liu M. Marital status and survival in epithelial ovarian cancer patients: A SEER-based study. Oncotarget. 2017;8(51):89040–54. doi: 10.18632/oncotarget.21648. [DOI] [PMC free article] [PubMed] [Google Scholar]
- 8.Li Y, Zhu MX, Qi SH. Marital status and survival in patients with renal cell carcinoma. Medicine (Baltimore) 2018;97(16):e0385. doi: 10.1097/MD.0000000000010385. [DOI] [PMC free article] [PubMed] [Google Scholar]
- 9.Zhang SL, Wang WR, Liu ZJ, Wang ZM. Marital status and survival in patients with soft tissue sarcoma: A population-based, propensity-matched study. Cancer Med. 2019;8(2):465–79. doi: 10.1002/cam4.1802. [DOI] [PMC free article] [PubMed] [Google Scholar]
- 10.Buja A, Lago L, Lago S, et al. Marital status and stage of cancer at diagnosis: A systematic review. Eur J Cancer Care (Engl) 2018;27(1) doi: 10.1111/ecc.12755. [DOI] [PubMed] [Google Scholar]
- 11.Lloyd S, Park HS, Decker RH, et al. Using the Surveillance, Epidemiology, and End Results database to investigate rare cancers, second malignancies, and trends in epidemiology, treatment, and outcomes. Curr Probl Cancer. 2012;36(4):191–99. doi: 10.1016/j.currproblcancer.2012.03.008. [DOI] [PubMed] [Google Scholar]
- 12.Scosyrev E, Messing J, Noyes K, et al. Surveillance Epidemiology and End Results (SEER) program and population-based research in urologic oncology: An overview. Urol Oncol. 2012;30(2):126–32. doi: 10.1016/j.urolonc.2009.11.005. [DOI] [PubMed] [Google Scholar]
- 13.Daly MC, Paquette IM. Surveillance, Epidemiology, and End Results (SEER) and SEER-Medicare databases: Use in clinical research for improving colorectal cancer outcomes. Clin Colon Rectal Surg. 2019;32(1):61–68. doi: 10.1055/s-0038-1673355. [DOI] [PMC free article] [PubMed] [Google Scholar]
- 14.Wei S, Tian J, Song X, et al. Causes of death and competing risk analysis of the associated factors for non-small cell lung cancer using the Surveillance, Epidemiology, and End Results database. J Cancer Res Clin Oncol. 2018;144(1):145–55. doi: 10.1007/s00432-017-2522-3. [DOI] [PubMed] [Google Scholar]
- 15.Zhang G, Zhao X, Li J, et al. Racial disparities in stage-specific gastric cancer: Analysis of results from the Surveillance Epidemiology and End Results (SEER) program database. J Investig Med. 2017;65(6):991–98. doi: 10.1136/jim-2017-000413. [DOI] [PubMed] [Google Scholar]
- 16.Li Y, Zhang N, Zhang H, Yang Q. Comparative prognostic analysis for triple-negative breast cancer with metaplastic and invasive ductal carcinoma. J Clin Pathol. 2019;72(6):418–24. doi: 10.1136/jclinpath-2018-205544. [DOI] [PubMed] [Google Scholar]
- 17.Li Q, Gan L, Liang L, et al. The influence of marital status on stage at diagnosis and survival of patients with colorectal cancer. Oncotarget. 2015;6(9):7339–47. doi: 10.18632/oncotarget.3129. [DOI] [PMC free article] [PubMed] [Google Scholar]
- 18.Qiu M, Yang D, Xu R. Impact of marital status on survival of gastric adenocarcinoma patients: Results from the Surveillance Epidemiology and End Results (SEER) database. Sci Rep. 2016;6:21098. doi: 10.1038/srep21098. [DOI] [PMC free article] [PubMed] [Google Scholar]
- 19.Shi RL, Chen Q, Yang Z, et al. Marital status independently predicts gastric cancer survival after surgical resection – an analysis of the SEER database. Oncotarget. 2016;7(11):13228–35. doi: 10.18632/oncotarget.7107. [DOI] [PMC free article] [PubMed] [Google Scholar]
- 20.Wu SG, Zhang QH, Zhang WW, et al. The effect of marital status on nasopharyngeal carcinoma survival: A Surveillance, Epidemiology and End Results Study. J Cancer. 2018;9(10):1870–76. doi: 10.7150/jca.23965. [DOI] [PMC free article] [PubMed] [Google Scholar]
- 21.He XK, Lin ZH, Qian Y, et al. Marital status and survival in patients with primary liver cancer. Oncotarget. 2017;8(39):64954–63. doi: 10.18632/oncotarget.11066. [DOI] [PMC free article] [PubMed] [Google Scholar]
- 22.Cronin KA, Ries LA, Edwards BK. The Surveillance, Epidemiology, and End Results (SEER) Program of the National Cancer Institute. Cancer. 2014;120(Suppl 23):3755–57. doi: 10.1002/cncr.29049. [DOI] [PubMed] [Google Scholar]
- 23.Du L, Kim JJ, Chen B, et al. Marital status is associated with superior survival in patients with esophageal cancer: A Surveillance, Epidemiology, and End Results study. Oncotarget. 2017;8(56):95965–72. doi: 10.18632/oncotarget.21609. [DOI] [PMC free article] [PubMed] [Google Scholar]
- 24.Xie JC, Yang S, Liu XY, Zhao YX. Marital status is associated with survival of patients with astrocytoma. J Clin Neurosci. 2018;56:79–87. doi: 10.1016/j.jocn.2018.07.005. [DOI] [PubMed] [Google Scholar]
- 25.Miao T, Li Y, Sheng X, Yao D. Marital status and survival of patients with kidney cancer. Oncotarget. 2017;8(49):86157–67. doi: 10.18632/oncotarget.21029. [DOI] [PMC free article] [PubMed] [Google Scholar]
- 26.Gao Z, Ren F, Song H, et al. Marital status and survival of patients with chondrosarcoma: A population-based analysis. Med Sci Monit. 2018;24:6638–48. doi: 10.12659/MSM.911673. [DOI] [PMC free article] [PubMed] [Google Scholar]
- 27.Shi X, Zhang TT, Hu WP, Ji QH. Marital status and survival of patients with oral cavity squamous cell carcinoma: A population-based study. Oncotarget. 2017;8(17):28526–43. doi: 10.18632/oncotarget.16095. [DOI] [PMC free article] [PubMed] [Google Scholar]
- 28.Zhang J, Gan L, Wu Z, et al. The influence of marital status on the stage at diagnosis, treatment, and survival of adult patients with gastric cancer: A population-based study. Oncotarget. 2017;8(14):22385–405. doi: 10.18632/oncotarget.7399. [DOI] [PMC free article] [PubMed] [Google Scholar]
- 29.Liu L, Chi YY, Wang AA, Luo Y. Marital status and survival of patients with hormone receptor-positive male breast cancer: A Surveillance, Epidemiology, and End Results (SEER) population-based study. Med Sci Monit. 2018;24:3425–41. doi: 10.12659/MSM.910811. [DOI] [PMC free article] [PubMed] [Google Scholar]
- 30.Abern MR, Dude AM, Coogan CL. Marital status independently predicts testis cancer survival – an analysis of the SEER database. Urol Oncol. 2012;30(4):487–93. doi: 10.1016/j.urolonc.2010.03.005. [DOI] [PubMed] [Google Scholar]
- 31.Xu C, Liu X, Chen YP, et al. Impact of marital status at diagnosis on survival and its change over time between 1973 and 2012 in patients with nasopharyngeal carcinoma: A propensity score-matched analysis. Cancer Med. 2017;6(12):3040–51. doi: 10.1002/cam4.1232. [DOI] [PMC free article] [PubMed] [Google Scholar]
- 32.Boen CE, Barrow DA, Bensen JT, et al. Social relationships, inflammation, and cancer survival. Cancer Epidemiol Biomarkers Prev. 2018;27(5):541–49. doi: 10.1158/1055-9965.EPI-17-0836. [DOI] [PMC free article] [PubMed] [Google Scholar]
- 33.Pfaendler KS, Wenzel L, Mechanic MB, Penner KR. Cervical cancer survivorship: Long-term quality of life and social support. Clin Ther. 2015;37(1):39–48. doi: 10.1016/j.clinthera.2014.11.013. [DOI] [PMC free article] [PubMed] [Google Scholar]
- 34.Goldzweig G, Andritsch E, Hubert A, et al. Psychological distress among male patients and male spouses: what do oncologists need to know? Ann Oncol. 2010;21(4):877–83. doi: 10.1093/annonc/mdp398. [DOI] [PubMed] [Google Scholar]
Associated Data
This section collects any data citations, data availability statements, or supplementary materials included in this article.
Supplementary Materials
Supplementary Table 1.
The comparisons of published literatures about marital status in survival and the existing paper.
| Cancer type | Sample size | Methods | Reference |
|---|---|---|---|
| Osteosarcoma | 2 725 | chi-square tests, univariate and multivariate Cox regression, subgroup analysis, and PSM analysis | This study |
| Epithelial ovarian cancer | 10 905 | chi-square tests, multivariate Cox regression, and subgroup analysis | Wang et al. |
| Renal cell carcinoma | 97 662 | chi-square tests, univariate and multivariate Cox regression, and subgroup analysis | Li et al. |
| Soft tissue sarcoma | 18 013 | chi-square tests, univariate and multivariate Cox regression, subgroup analysis, and PSM analysis | Zhang et al. |
| Rectal cancer | 27 498 | chi-square tests, univariate and multivariate Cox regression, and subgroup analysis | Wang et al. |
| Non-small cell lung cancer | 70 006 | chi-square tests, univariate and multivariate Cox regression, and subgroup analysis | Wu et al. |
| Oral cavity squamous cell carcinoma | 11 022 | chi-square tests, univariate and multivariate Cox regression, subgroup analysis, and PSM analysis | Shi et al. |
| Chondrosarcoma | 4 502 | chi-square tests, univariate and multivariate Cox regression, and subgroup analysis | Gao et al. |
| Astrocytoma | 43 324 | chi-square tests, univariate and multivariate Cox regression, and subgroup analysis | Xie et al. |


