

Summary
There are wide reports of advances in the timing of spring migration of birds over time and in relation to rising temperatures, though phenological responses vary substantially within and among species. An understanding of the ecological, life‐history and geographic variables that predict this intra‐ and interspecific variation can guide our projections of how populations and species are likely to respond to future climate change.
Here, we conduct phylogenetic meta‐analyses addressing slope estimates of the timing of avian spring migration regressed on (i) year and (ii) temperature, representing a total of 413 species across five continents. We take into account slope estimation error and examine phylogenetic, ecological and geographic predictors of intra‐ and interspecific variation.
We confirm earlier findings that on average birds have significantly advanced their spring migration time by 2·1 days per decade and 1·2 days °C−1. We find that over time and in response to warmer spring conditions, short‐distance migrants have advanced spring migratory phenology by more than long‐distance migrants. We also find that larger bodied species show greater advance over time compared to smaller bodied species. Our results did not reveal any evidence that interspecific variation in migration response is predictable on the basis of species' habitat or diet.
We detected a substantial phylogenetic signal in migration time in response to both year and temperature, suggesting that some of the shifts in migratory phenological response to climate are predictable on the basis of phylogeny. However, we estimate high levels of species and spatial variance relative to phylogenetic variance, which is consistent with plasticity in response to climate evolving fairly rapidly and being more influenced by adaptation to current local climate than by common descent.
On average, avian spring migration times have advanced over time and as spring has become warmer. While we are able to identify predictors that explain some of the true among‐species variation in response, substantial intra‐ and interspecific variation in migratory response remains to be explained.
Keywords: arrival date, bird migration timing, climate change, migratory phenology, plasticity
Advances in avian migration phenology over time and with rising temperatures exhibit substantial intra‐ and interspecific variation. The authors conduct an extensive phylogenetic meta‐analysis allowing us to identify key predictors and variance components of the phenological response, and whether this sensitivity to temperature increase may be phylogenetically conserved.

Introduction
Changes in the timing of seasonal events are one of the most conspicuous biotic impacts of global climate change (Walther et al. 2002; Parmesan & Yohe 2003; Root et al. 2003). Rising global temperatures have generally resulted in an earlier onset of spring in extra‐tropical regions (Thackeray et al. 2016), including earlier flowering and leafing of plants (Fitter & Fitter 2002), emergence of insects (Roy & Sparks 2000), and breeding of amphibians and birds (Crick et al. 1997; Li, Cohen & Rohr 2013). As a result of high levels of interest from professionals and citizen scientist ornithologists, temporal shifts in the timing of spring avian migration due to climate change have been especially extensively recorded over time and space (BirdLife International & National Audubon Society 2015). These studies reveal a general trend of advancement in spring arrival and passages dates towards the present and with increasing temperatures (Lehikoinen, Sparks & Zalakevicius 2004; Lehikoinen et al. 2010). However, there is considerable variation in the slope around the average, with different species or even populations of the same species exhibiting both earlier and later timings of spring migration over time and with respect to temperature change (Miller‐Rushing, Primack & Stymeist 2008; Hurlbert & Liang 2012). Such variation in phenological response has potentially severe consequences on mean population fitness if migratory birds arrive at breeding grounds too early or late relative to peak resource availability, resulting in mismatch of trophic interactions (Both et al. 2009; Thackeray et al. 2010) or stronger competition for finding optimal breeding sites or high‐quality mates (Alatalo, Lundberg & Glynn 1986; Smith & Moore 2005). Indeed, there is some evidence that migrant bird species are declining by more than residents (Both et al. 2006; Møller, Rubolini & Lehikoinen 2008), with mistiming of breeding among the potential explanations.
What factors might cause populations and species to vary in their phenological response? Comparative analyses can be used to reveal the factors that explain trait variation among (Harvey & Pagel 1991) or within (Stone, Nee & Felsenstein 2011) species. Previous comparative studies addressing avian migratory responses have found that short‐distance migrants are more responsive to spring temperatures than long‐distance migrants (e.g. Butler 2003; Lehikoinen, Sparks & Zalakevicius 2004; Rubolini et al. 2007). This pattern may be explained if conditions in the non‐breeding and passage ranges of short‐distance migrants are more predictive of conditions on the breeding grounds than is the case for long‐distance migrants. In contrast, long‐distance migrants overwintering further away from the breeding grounds may rely on circannual, endogenous mechanisms to time their migration rather than external cues (Gwinner 1996). However, although a difference in response according to migration distance has been widely reported, the pattern has been far from universal (Jonzén et al. 2006; Zalakevicius et al. 2006).
Other ecological traits that have recently been suggested to predict phenological response to climate change include species' habitat and diet type. In particular, the timing of leaf out in temperate forests has advanced substantially in response to rising spring temperatures, which in turn impacts on the timing of the peak availability of some herbivorous invertebrates (Visser & Both 2005). Forest habitats may be more highly seasonal in phytophageous invertebrate availability than other habitats such as marsh/reeds: In the former, invertebrate availability is restricted to before the production of secondary plant compounds (Feeny 1970; Southwood et al. 2004), whereas in the latter, reed continues to grow during the spring and summer, and hence invertebrate availability may be less seasonally peaked (Halupka, Dyrcz & Boroweic 2008). It follows therefore that migrants that feed these highly seasonal resources to offspring may experience strong selection to track environmental changes (Visser et al. 1998; Both et al. 2010). Similarly, if species that are specialists in terms of diet, habitat or climatic niche experience stronger selection on migration timing then they may have steeper phenological responses (Both et al. 2010). Running counter to this prediction, however, previous comparative studies have found that generalist species are more responsive than specialists to climate change (Végvári et al. 2010; Moussus et al. 2011; Hurlbert & Liang 2012). Additionally, body size is expected to be negatively correlated with the magnitude of advance in spring migratory phenology, as migration in larger birds is hypothesized to be more time‐canalized due to longer moulting times and slower migration speeds (Hedenström 2006, 2008).
The timing of migration is expected to affect fitness, and a change in phenology over time may be due to either a response to selection or phenotypic plasticity. However, few studies present compelling evidence for microevolution of phenology in response to recent climate change [see Franks, Sim & Weis (2007) for a plant flowering time example], and most recent changes in migratory phenology are thought to be attributable to phenotypic plasticity (reviewed in Charmantier & Gienapp 2014). However, it is quite possible that microevolution in the form of local adaptation contributes to among‐species and population variation in the plastic response to spring temperatures. We predict that, even in the absence of among‐site or among‐species variation in the plastic response to temperature, geographic variation in the rate of temperature increase will generate geographical variation in the average phenological response. Consistent with this prediction, there is evidence that the magnitude of change in migratory phenology varies latitudinally and is steepest for high latitude areas that have experienced the greatest temperature increases (Sparks & Braslavská 2001; Parmesan 2006; but see Rubolini et al. 2007). More generally, studies conducted in the northern hemisphere have reported differences in slope of migratory response between continents, reflecting regional differences in climatic change (Bitterlin & Van Buskirk 2014).
Previous comparative studies addressing avian migratory phenology have been restricted to the northern hemisphere (e.g. Rubolini et al. 2007; Végvári et al. 2010; Bitterlin & Van Buskirk 2014), although there has been a recent increase in studies of southern hemisphere species (reviewed in Chambers, Beaumont & Hudson 2014). Beyond simply correcting for phylogenetic non‐independence (Felsenstein 1985), most phylogenetic comparative studies now estimate phylogenetic signal, i.e., the extent to which close relatives share similar traits (Freckleton, Harvey & Pagel 2002; Blomberg, Garland & Ives 2003). This can be useful as a predictive tool, as a strong phylogenetic signal implies that we might predict the phenological responses of species not included in the study based on the responses of their close relatives. Of the avian studies that have incorporated phylogeny, two report the phylogenetic signal to be low (Végvári et al. 2010; Bitterlin & Van Buskirk 2014), while one reports the signal to be high (Rubolini et al. 2007). However, these studies ignore measurement error in slope estimates, meaning that the residual variance in the slopes is likely to be inflated and the phylogenetic signal underestimated.
Here we conduct a phylogenetic meta‐analysis of avian migratory phenology on a global‐scale, with the aim of identifying key predictors of global variation in slope of (i) the temporal phenological trend and (ii) the phenological response to temperature, while controlling for aspects of study methodology. Specifically, on the basis of previous evidence and theory outlined above, we hypothesize steeper slopes for migrants that (i) are short‐distance migrants, (ii) rely on forest breeding and passage habitats and (iii) have an invertebrate‐dominated diet. We also hypothesize that (iv) greater species' generalism in terms of habitat and diet will give rise to shallower slopes, (v) body size will correlate negatively with phenological trends, such that the smallest species advance by most, and (vi) the magnitude of the slopes will increase with latitude. Finally, we hypothesize that (vii) phenological responses will be phylogenetically conserved.
Materials and methods
Data selection and criteria
We conducted a systematic literature search in order to locate relevant studies, by following the PRISMA (Preferred Reporting Items for Systematic reviews and Meta‐analyses) statement (http://www.prisma-statement.org). We searched for studies by using key words ‘avian’ or ‘bird’ with ‘migration phenology’, ‘arrival date’ or ‘timing of migration’ on ISI Web of Science and Scopus. To each combination of the search string, we added regional terms including ‘Southern hemisphere’, ‘Africa’, ‘Asia’, ‘South America’, ‘Antarctic’ or ‘Australia’, with the aim of increasing the representation of species from these regions given a predominance of migration studies from North American and European localities. Additionally, searches were carried out on Google Scholar to locate missing publications and ‘grey‐literature’ (e.g. unpublished material and dissertations). All searches were carried out between January and October 2015.
We extracted data from studies reporting changes in spring migratory phenology over time or with respect to temperature. Specifically, we extracted data from studies reporting either the slope and standard error from a simple linear regression of a measure of spring migration timing against year (days year−1) or temperature (days °C−1). Where studies did not report the standard error but reported the slope, sample size and P‐value of the linear regression analysis, we calculated an upper estimate of the standard error by (i) calculating the t‐value (where P was reported as <0·05 or <0·01 we used 0·05 or 0·01 respectively) and (ii) dividing the slope by the t‐value. Where studies did not report the above, we contacted authors for data sets, from which slopes and standard errors were extracted using linear regression. In a few cases, upon contact, authors supplied us with additional data sets. For papers where the requisite data were presented in graphical format, we extracted data points using WebPlotDigitizer v3.9 (Rohatgi 2015; http://arohatgi.info/WebPlotDigitizer) and re‐analysed the data using linear regression. Finally, we included reports that presented annual bird arrival dates to the breeding or passage grounds but did not estimate a trend over time, by calculating this using linear regression.
We included studies that reported changes in first arrival dates (FADs) or mean/median arrival dates (MADs) to the breeding or passage grounds. For temperature response slopes, we included changes in spring migratory phenology with respect to temperature changes at breeding, passage or non‐breeding sites. Where a study had considered temperature across multiple time periods for a population, we included only the highest R 2 correlate for each temperature location. All studies used in the meta‐analysis are provided in the Data Sources section. The full data set can be accessed from the Dryad Digital Repository: http://dx.doi.org/10.5061/dryad.mb4nd. In general, the slope estimates we obtained from the literature assume that the migration time within a year is known without error. We anticipate that ignoring such error will not bias slope estimates based on mean/median but will lead to underestimation of the standard error associated with a slope. However, ignoring this source of uncertainty may bias slopes estimated from first dates if either abundance or recorder effort has changed over time and/or with temperature.
Location and species traits
We collected data on geographic and species' ecological and life‐history traits that have been suggested to influence the strength of phenological response of birds to climate change (see Introduction). For each study, we defined geographic factors by the latitude, longitude, country and continent of the study site. In cases where data were collected on a regional scale, we calculated the mid‐point coordinates for the study site.
At the population‐level, we classified bird migration distances as either short‐ or long‐distance migrants, on the basis of statements made by authors of the studies. Due to intraspecific differences in species' migration distances, we only assigned migration distances to migrants when this was reported in papers for the population under study. Where studies referred to a population as medium‐distance migrants, these were reclassified as short‐distance migrants if their breeding and non‐breeding grounds were within the same continent. Species‐level data on habitat was obtained from BirdLife International (2015). We constructed a binary classification of species as having ‘forest’ or ‘other’ habitat, depending on whether species used forest habitats as a suitable breeding or passage habitat or not. Habitat generalism was quantified as the number of different suitable breeding and passage habitats (at the highest level in the IUCN Habitats classification scheme; http://www.iucnredlist.org/technical-documents/classification-schemes/habitats-classification-scheme-ver3) used by a species. Habitat types comprised forest, shrubland, grassland, wetland, marine, savanna, desert, rock, cave, and artificial aquatic and terrestrial habitats. Data on species' diet were obtained from Wilman et al. (2014), with diet categories comprising invertebrates, fish, reptiles and amphibians, mammals and birds, general or unknown vertebrates, fruits, seeds, nectar and pollen, other plant materials or carrion. We classified species as ‘invertebrate‐dominated’ where invertebrates comprised a majority (≥50%) of the diet, with the remainder classified as ‘other’. Additionally, we scored diet generalism for each species by counting the number of food types that built up a substantial (≥20%) component of a species' diet. We also obtained data on the mean body mass (g) for each species, as reported in Dunning (1992) and Wilman et al. (2014).
Statistical analysis
We examined signs of publication bias (the preferential publication of statistically significant results) in the data set indirectly by visualization of funnel plots. If there is no bias, plotting slope estimates against a measure of precision (inverse of the standard error) should show a symmetrical and inverted funnel, with smaller studies showing larger variance (Egger et al. 1997). Where present, publication bias can generate unreliable meta‐analytical results (Sterne & Egger 2001).
For analysis of slopes and standard errors, we adopted a mixed effects phylogenetic meta‐analytic approach, in which effects of multiple fixed and random effects can be specified in a single model (Hadfield & Nakagawa 2010; Nakagawa & Santos 2012). Analyses were implemented in a Bayesian setting using the package MCMCglmm (Hadfield 2010) in R (R Development Core Team 2014). We sampled 100 sample trees from a pseudo‐posterior distribution of species‐level bird phylogenies (Jetz et al. 2012) from BirdTree.org (http://www.birdtree.org). Trees were based on the Hackett et al. (2008) backbone. We fitted phylogeny, species, study and location as random effects (eqn 1).
| (eqn 1) |
The Gaussian trait, y (estimate of the slope of phenology regressed on year or temperature), of species i is given by the grand mean (μ) plus the influence of fixed effects (βx i), and random effects due to phylogeny (a i), species (s i), study (t i), location (l i), each species by location combination (s i : l i), residual (e i) and measurement error (m i). All random effects were assumed to follow normal distributions and their variances were estimated (with the exception for m i for which variance was fixed at 1). As arrival data from studies included in this meta‐analysis originated from various sources (citizen scientist observations; ornithological club reports; observatory observations; standardized capture and ringing at observatories; non‐standardized field studies; and standardized field studies), we allowed for heterogeneity in residual variance across these data types to control for variance in the quality of data in all our models. Therefore, the residual variance for each data type reveals how much the slope estimates depart from the average slope obtained for population i. We calculated the per cent variance for each random effect component by dividing estimates of each variance component by total variance (calculated as the sum of phylogeny, species, study, location, species by location and the mean of the residual variance terms).
Fitting phylogeny as a random effect accounts for non‐independence among species due to shared history under the Brownian motion model of trait evolution. We assume that different metrics (e.g., FAD and MAD) share the same phylogenetic signal. Measurement error variance, defined as the squared standard error of the slope estimate for migration regressed on year or temperature, ensured that more reliable estimates were given more weight in the model. By repeating the analyses across 100 trees, the combined posterior distribution for fixed and random effects capture both model and phylogenetic uncertainty (Pagel & Lutzoni 2002). We estimated the phylogenetic heritability (H 2), which is mathematically equivalent to calculating pedigree‐based heritability in quantitative genetics (Hadfield & Nakagawa 2010), as:
| (eqn 2) |
where is phylogenetic variance and is species variance. For each type of slope estimate (year and temperature), we constructed three main types of models: (i) a null model – with the objective of estimating the global mean advance in migration timing, (ii) a basic model – with the objective of estimating sources (e.g. spatial, species, phylogenetic) of variance in true migration slopes around the global mean while controlling for aspects of study methodology and (iii) an ecological model – with the objective of identifying ecological predictors of migration trends and temperature sensitivity.
In addition to the above random effects (eqn 1), the basic models included the following fixed effects to control for aspects of study methodology: the metric for monitoring spring migration timing (FAD or MAD), location of migrants' arrival (breeding or passage ground), location of temperature data (breeding, passage or non‐breeding ground) and the midyear decade in which the study was conducted. Midyear decade was included in the year response models to account for imbalance in data coming from different periods and to control for any tendency in the slope to steepen in decades that experienced greater directional temperature change. The ecological models included, in addition to the fixed terms included in the basic model, the continent of the study site; an interaction between hemisphere and latitude of the study site; migration distance category; invertebrate diet binary score; diet generalism; forest habitat binary score; habitat generalism; and ln body mass. Preliminary analysis revealed a strong correlation between location of migrants' arrival and location of temperature data, and between continental and latitudinal effects, and thus we considered these predictors in separate models. We also included the source of data as a fixed effect, to allow for a bias in slope estimates for first dates if recorder effort has changed over time.
MCMCglmm models were run for 200 000 iterations on each tree, discarding the first 150 000 iterations as burn‐in, and sampling every 500 iterations. For random effects, an inverse Wishart prior with V = 1 and nu = 0·02 was specified (Gelman & Hill 2007). We viewed trace plots for fixed and random effects to ensure appropriate sampling of the posterior distribution and ensured that effective sample sizes for all parameters exceeded 1000. We deemed fixed effects to be statistically significant when 95% credible intervals (CIs) did not span zero.
Results
Data set coverage and bias
Our final data set consisted of 2976 slope estimates, comprising 1816 year slopes and 1160 temperature slopes obtained from 73 published studies. Observations spanned a period of 265 years from 1749 to 2014, with most studies focusing on migration trends in the past 50 years. Observation duration ranged from 5 to 72 years, with a mean duration of 38·1 years. The data set included 413 species representing 28 orders, with Passerines comprising 73·9% of the total data set (Table S1, Supporting Information). Substantial geographic bias was evident, with data from North America and Europe accounting for 52·8% and 28·3% of the overall data set, while the southern hemisphere accounted for just 3·9% (Table S2). Notably, none of the southern hemisphere studies reported temperature response slopes. Visual examination of funnel plots suggested no evidence of publication bias in either the year or the temperature slopes (Fig. 1).
Figure 1.

Funnel plots of slope estimates plotted against the inverse of standard errors (SE) obtained (a) over time (days year−1) and (b) with respect to temperature (day °C−1). Vertical lines represent the average effect size (solid) for the slope of spring migration timing and the associated lower and upper 95% CIs (dashed), as estimated using a mixed model meta‐analysis that included phylogeny, species, study and location as random effects and the grand mean as the sole fixed effect.
Correlates of year response
We found a highly significant trend for earlier spring migration timing over time (Fig. 1a). Overall, the global average advance in migration timing estimated by the null model was −2·1 (95% CI: −2·9 to −1·4) days per decade. In all models, this advance in migration timing was significantly steeper in MADs than for FADs (Fig. 2a; Table S3). Furthermore, in all models, the advance in migration timing varied among decades, being steepest in the 1920s and 1990s (Table S3). Advance in migration timing did not differ significantly between arrival at breeding or passage grounds, or between different data types.
Figure 2.
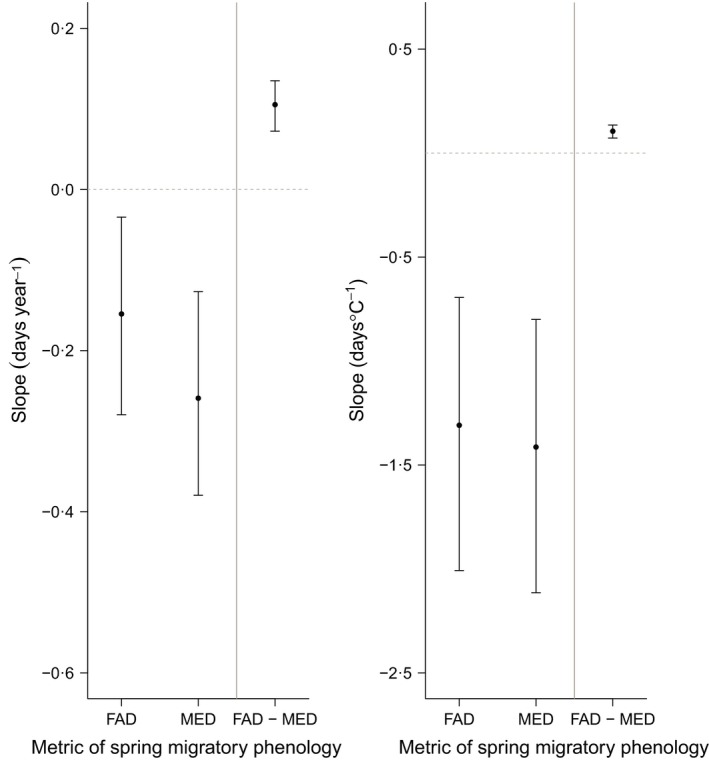
Posterior median advances (and associated 95% CIs) in spring migration timing (a) over time (days year−1) and (b) with respect to temperature (day °C−1) for different metrics of monitoring migration timing, as estimated under the basic model. Estimates are for arrival to the breeding ground as reported by standardized field studies, with year response estimates representing advances in the decade 1980. Note that although CIs of the FAD and MAD slope estimates overlap each other, the 95% CI for the difference in slope between FADs and MADs as estimated directly from the basic models (plotted to the right of the grey vertical line) does not overlap zero and is significant.
The basic model revealed a significant phylogenetic signal, H 2 = 0·672 (95% CI: 0·321 to 0·942). Phylogeny and species contributed around 11·4% and 5·6% (i.e. 17·0% among‐species variance) of total variance in the slope, respectively, with the lower CI close to zero for both components. Intraspecific variance, captured by location and species by location variance accounted only for around 5·3% and 3·8% (i.e. 9·1% within‐species variance) of total variance, respectively, with again the lower CI close to zero for both components (Table S3). Among‐study and mean residual variance accounted for around 27·6% and 46·4% of total variance, respectively, and were significant sources of variation (Table S3). The magnitudes of variance components were qualitatively similar for models that included ecological and life‐history correlates as fixed effects.
Under the ecological models, we found no significant latitudinal trends in year slopes (Fig. 3) or differences among continents. We found that short‐distance migrants have advanced their migration timing by significantly more than long‐distance migrants, although long‐distance migrants still showed a significant advance in most decades (Fig. 4a). Additionally, the magnitude of the negative slope was found to increase very slightly with species' body size. From the ecological model including latitude, we estimate that with an increase in body mass from 10 to 1000 g, the slope steepens by 0·04 days year−1. We found no significant effect of habitat, diet or either index of species' generalism (Table S3).
Figure 3.

Predicted effects of latitude on changes in mean/median arrival dates over time in the Northern and Southern Hemispheres. Grey circles represent temporal slope estimates. Black lines represent the latitudinal predictions in the Northern and Southern Hemispheres, as estimated under the ecological model with latitude as a predictor. Estimates are for short‐distance migrants; migrants that do not rely on forest habitats during breeding and passage; migrants with a predominantly invertebrate diet; habitat and diet specialists; body size of 10 g; arrival data as reported by standardized field studies; and the decade 1980.
Figure 4.

Posterior median advances (and associated 95% CIs) in mean/median arrival dates for different migration distance classes (a) over time (day year−1) and (b) with temperature (days °C−1) at the mean latitude of the data set in the Northern Hemisphere (46·1°N), as estimated under our ecological models. Unclassified migrants refer to migrants that were not assigned migration distances in the original studies. Estimates are for migrants that do not rely on forest habitats during breeding and passage; migrants with a predominantly invertebrate diet; habitat and diet specialists; body size of 10 g; arrival data as reported by standardized field studies; and the decade 1980 for year slope estimates. The difference in slope between short‐ and long‐distance migrants as estimated directly from our ecological models (plotted to the right of the grey vertical line) does not overlap zero and is significant.
Correlates of temperature response
We found a highly significant trend for earlier spring migration at higher temperatures under the null model (Fig. 1b). Overall, the posterior median advance in migration timing was −1·2 (95% CI: −1·7 to −0·9) days °C−1. While this appears substantially more negative than the mean of the funnel plot, this can be attributed to random effects relating to region and study. In all models, the advance in migration timing was significantly steeper in MADs compared to FADs (Fig. 2b). The slope of response did not vary depending on whether temperatures were representative of changes at breeding, passage or non‐breeding sites, whether arrival was to the breeding or passage grounds, or across different data types (Table S4).
We detected a significant phylogenetic signal in temperature slopes (H 2 = 0·468 [95% CI: 0·140 to 0·984]). In our basic model, phylogeny and species accounted for around 13·0% and 14·6% (i.e. 27·6% among‐species variance, as estimated from our basic model; Table S4) of total variance in the slope of phenology on temperature, respectively, with lower CI close to zero for species variance. Intraspecific variance, captured by location and species by location components accounted for 29·6% and 1·7% (i.e. 31·3% within‐species variance) of total variance in the slope, respectively, with lower CI for both components close to zero. Among‐study and mean residual variance accounted for around 19·2% and 21·9% of total variance, respectively, and were significant sources of variation (Table S4). The magnitudes of variance components were qualitatively similar across our ecological models with the exception of location variance, which decreased when continent of the study location was included as a correlate, and among‐study variance, which, as a percentage of total variance in the slope, decreased in all ecological models (Table S4).
Under the ecological model, we found no significant latitudinal trends in the temperature slope (Table S4). As with the year response meta‐analysis, short‐distance migrants showed significantly more negative responses as compared with long‐distance migrants, although long‐distance migrants still showed a significant response overall (Fig. 4b). We found no significant effect of body size, habitat, diet or either index of species' generalism (Table S3).
Discussion
We present the most phylogenetically and geographically extensive meta‐analysis to date on changes in avian spring migratory phenology. Our results agree with previous findings that in recent decades, the average avian spring migration timing has advanced in response to climate change (Parmesan & Yohe 2003; Root et al. 2003; Lehikoinen, Sparks & Zalakevicius 2004; Lehikoinen et al. 2010), with migrants arriving at their breeding grounds on average 2 days per decade earlier. This estimate of migration phenology is in broad agreement with estimates derived from previous meta‐analyses with partially overlapping data sets (Lehikoinen, Sparks & Zalakevicius 2004; Gienapp, Leimu & Merilä 2007; Rubolini et al. 2007; Bitterlin & Van Buskirk 2014). Our results also confirm that migration timing is temperature sensitive, with migrants arriving around 1 day earlier 1 °C−1 rise in global temperatures. Importantly, however, our results reveal substantial heterogeneity in the true magnitude and sign of phenological response to climate change across phylogeny, species and populations.
Our results highlight species' migration distance as a key correlate of variation in strength of phenological response. Our finding of steeper temporal and temperature slopes for short‐ compared with long‐distance migrants confirms previous findings that the former may be better able to evolve plastic responses that partially track changes in climatic conditions at their breeding grounds (e.g. Butler 2003; Lehikoinen, Sparks & Zalakevicius 2004). We note that long‐distance migrants are also able to significantly adjust their migratory phenology in response to climate change, suggesting that climatic variables used as cues to time migration at their non‐breeding grounds could covary with climatic conditions at the breeding grounds (Gordo et al. 2005; Saino & Ambrosini 2008) and/or that migrants are able to adjust their migration speed in response to warmer conditions during passage (Marra et al. 2005). Life‐history traits that are correlated with body size, such as moulting and migratory speed, have been shown to affect phenological response to climate change including in the most recent meta‐analysis by Bitterlin & Van Buskirk (2014). We also find that body size has a negative relationship with migration time, such that the largest bodied species are advancing most strongly, although this finding is contrary to our expectation that larger birds may be more time constrained in their response to climate change (Hedenström 2006, 2008).
We do not detect differences in response between diet type or habitat generalists and specialists. Although studies conducted in both North America and Europe have revealed stronger responses for species that are more generalist in terms of diet and climatic niche (Végvári et al. 2010; Hurlbert & Liang 2012), our results suggest that generalism is at best a weak correlate of changes in migration phenology. We also do not find a significantly steeper slope for forest inhabiting species or for species with an invertebrate‐dominated diet. We do not rule out the possibility that habitat and diet may still have an effect on species' migration timing, however, and note that other habitat or food types may show similarly peaked seasonal availability. For example, in a study of American migrants, Butler (2003) found that grassland species advanced their spring migration timing the most, perhaps due to earlier snow melt allowing earlier availability of seeds for which most of these migrants rely on.
Although spatial variance in both responses was estimated to be quite large, we find no latitudinal trend in migration slopes, counter to claims of steeper temporal slopes (Sparks & Braslavská 2001; Parmesan 2006) and greater temperature responsiveness with latitude (Both et al. 2004; While & Uller 2014) in the northern hemisphere. However, previous findings from a global meta‐analysis of various plant and animal species have estimated latitude to account for less than 4% of variation in response (Root et al. 2003; Parmesan 2007). As a percentage of total variance, among‐location variance was lower for the year response than the temperature response. We suggest that among‐location variance and among‐study variance may capture similar effects: The summed proportion of location and study variance accounts for 36·7% and 50·5% of total variance in year and temperature slopes respectively. This combined spatial variance component corresponds to 95% of true advances in migration timing varying between −14·0 days per decade and 9·8 days per decade over time and −15·1 days °C−1 and 12·7 days °C−1 with temperature. We find this summed variance to be a significant source of variation in all our year and temperature slope analyses, suggesting that considerable geographical heterogeneity exists for both temporal shifts and temperature sensitivity in migratory phenology. Some of this variation may be attributable to a plastic response to geographical variation in environmental or biotic drivers that we have overlooked (Gordo et al. 2005; Saino & Ambrosini 2008), or due to genetic differences among populations if they are locally adapted in their plastic response to temperature (see also While & Uller 2014).
Our finding of substantial phylogenetic signal in the year and temperature slopes is in contrast to a recent informal meta‐analysis on changes in migratory phenology in the northern hemisphere (Bitterlin & Van Buskirk 2014). Our estimate of significant phylogenetic signal reveals that there may be some phylogenetic constraints to the timing of migration in response to climate, consistent with findings in plants (Willis et al. 2008) and butterflies (Roy et al. 2015). However, high levels of species and spatial variance estimates for the temperature response model are consistent with a scenario where plasticity in response to climate evolves rapidly and is more influenced by adaptation to current local climate than by common descent (Rubolini et al. 2007; Végvári et al. 2010). For this reason, we suggest that phylogenetic relationships are likely to be of little value in predicting the migratory responses of populations of further species.
Finally, as a variety of approaches exist for estimating migration time response, it is desirable to control for these differences and distinguish between true variation in phenological response and artefacts caused by differences in field methodology. Estimates of residual variance components in both year and temperature slopes are large, which suggests considerable heterogeneity in slope estimates arises due to different data collection methods of migrants' arrival dates. We also find differences in response between different metrics of spring migration timing, consistent with the explanation that FADs are subject to biases such as changes in sampling effort and population size, making them less reliable than measures of average arrival dates for estimating population phenological trends (Sparks, Roberts & Crick 2001; Tryjanowski & Sparks 2001; Rubolini, Saino & Møller 2010). We suggest that steeper slopes for changes in MADs compared with FADs may result from a decline in migrant population sizes (Robbins et al. 1989; Sanderson et al. 2006) causing first dates to be delayed relative to MADs. Additionally, we did not find significant differences in migratory phenology to temperature changes at breeding compared to non‐breeding grounds. Unfortunately, studies that consider climatic data from non‐breeding grounds (e.g. from Central and South America) remain scarce relative to those of breeding grounds (comprising just 10·6% of our temperature records).
Our estimate of an average migratory response to temperature of −1·2 days °C−1 is shallower than estimates of the response of lay dates to spring temperatures (Dunn & Møller 2014; Phillimore et al. 2016; Thackeray et al. 2016). If spring temperatures continue to rise, this shallow response of migration time to spring temperature may act as a hard limit on the lay date response to breeding ground temperatures, thus placing migrant species at a disadvantage relative to resident species (Both & Visser 2001). Such demographic consequences have been reported for a Dutch population of pied flycatchers, where population declines have been most severe in areas with an early food peak and for migrants that are least flexible in their response to temperature increases (Both & Visser 2001; Both et al. 2006). In addition, our finding that long‐distance migrants are less responsive to rising temperatures than short‐distance migrants present grounds for concern. If spring temperatures on the breeding ground continue to rise, advances in the timings of plant and invertebrate phenology and optimum lay date are also predicted (Gienapp et al. 2013; Vedder, Bouwhuis & Sheldon 2013).
In this phylogenetic meta‐analysis, we find that the average migratory bird is returning to breeding grounds significantly earlier than in the past and as temperatures rise. Around this mean, we identify substantial variation in the true response of different species and populations. While we identify some ecological predictors of this variation, substantial intra‐ and interspecific variation in migratory response remains to be explained. We note that although our data set is extensive, it is by no means exhaustive, with our meta‐analyses predominantly comprising English‐language literature. By adopting PRISMA procedures, however, we have crucially followed a replicable process in determining which studies are to be included in the meta‐analysis, the importance of which has been stressed in ecological and evolutionary meta‐analyses (Nakagawa & Poulin 2012). We further note that inclusion of spatial random effects in our models as well as use of geographical terms in our search string mitigates spatial bias in our data set. Thus, we have presented here, to our knowledge, the most extensive, formal meta‐analyses of avian migration phenology to date.
Data accessibility
Data available from the Dryad Digital Repository: http://dx.doi.org/10.5061/dryad.mb4nd (Usui, Butchart & Phillimore 2016).
Supporting information
Table S1. Taxonomic coverage of the data set used in meta‐analysis.
Table S2. Geographical coverage of the data set used in meta‐analysis.
Table S3. Model coefficients from the analyses of year slopes (days year−1) in basic and ecological models.
Table S4. Model coefficients from the analyses of temperature slopes (day °C−1) in basic and ecological models.
Authors' contributions
A.B.P. and T.U. conceived ideas and designed methodology; S.B. provided data; T.U. collected and analysed data, and wrote the manuscript. All authors contributed critically to the drafts.
Acknowledgements
We thank the following scientists for generously providing raw data, unpublished information and support upon contact: R.T. Barrett, A. Black, J. van Buskirk, P.A. Cotton, H. Doi, E.R. Ellwood, A.E. Goodenough, A.H. Hurlbert, S‐D. Lee, S. Meiri, R.B. Primack, U. Roll, L.V. Sokolov and T.H. Sparks. We thank the journal editors and two anonymous reviewers for comments that greatly improved this paper. T.U. was funded by the Institute of Evolutionary Biology, University of Edinburgh. A.B.P. was funded by a NERC Fellowship (Ne/I020598/1O). The authors declare no conflict of interest.
References
References
- Alatalo, R.V. , Lundberg, A. & Glynn, C. (1986) Female pied flycatchers choose territory quality and not male characteristics. Nature, 323, 152–153. [Google Scholar]
- BirdLife International . (2015) IUCN Red List for birds. Available at: http://www.birdlife.org, Accessed 1 February 2016.
- BirdLife International & National Audubon Society . (2015) The Messengers: What Birds Tell Us About Threats from Climate Change and Solutions for Nature and People. Cambridge, UK and New York, USA: BirdLife International and National Audubon Society; Available at: http://climatechange.birdlife.org/assets/THE_MESSENGERS_FINAL_WEB.pdf, Accessed 1 November 2015. [Google Scholar]
- Bitterlin, L.R. & Van Buskirk, J. (2014) Ecological and life history correlates of changes in avian migration timing in response to climate change. Climate Research, 61, 109–121. [Google Scholar]
- Blomberg, S.P. , Garland, T. & Ives, A.R. (2003) Testing for phylogenetic signal in comparative data: behavioral traits are more labile. Evolution, 57, 717–745. [DOI] [PubMed] [Google Scholar]
- Both, C. & Visser, M.E. (2001) Adjustment to climate change is constrained by arrival date in a long‐distance migrant bird. Nature, 411, 296–298. [DOI] [PubMed] [Google Scholar]
- Both, C. , Artemyev, A.V. , Blaauw, B. et al (2004) Large‐scale geographical variation confirms that climate change causes birds to lay earlier. Proceedings of the Royal Society of London B, 271, 1657–1662. [DOI] [PMC free article] [PubMed] [Google Scholar]
- Both, C. , Bouwhuis, S. , Lessells, C.M. & Visser, M.E. (2006) Climate change and population declines in a long‐distance migratory bird. Nature, 441, 81–83. [DOI] [PubMed] [Google Scholar]
- Both, C. , Van Asch, M. , Bijlsma, R.G. , Van den Burg, A.B. & Visser, M.E. (2009) Climate change and unequal phenological changes across four trophic levels: constraints or adaptations? Journal of Animal Ecology, 78, 73–83. [DOI] [PubMed] [Google Scholar]
- Both, C. , Van Turnhout, C.A.M. , Bijlsma, R.G. , Siepel, H. , Van Strien, A.J. & Foppen, R.P.B. (2010) Avian population consequences of climate change are most severe for long‐distance migrants in seasonal habitats. Proceedings of the Royal Society B: Biological Sciences, 277, 1259–1266. [DOI] [PMC free article] [PubMed] [Google Scholar]
- Butler, C.J. (2003) The disproportionate effect of global warming on the arrival dates of short‐distance migratory birds in North America. Ibis, 145, 484–495. [Google Scholar]
- Chambers, L.E. , Beaumont, L.J. & Hudson, I.L. (2014) Continental scale analysis of bird migration timing: influences of climate and life history traits – a generalized mixture model clustering and discriminant approach. International Journal of Biometeorology, 58, 1147–1162. [DOI] [PubMed] [Google Scholar]
- Charmantier, A. & Gienapp, P. (2014) Climate change and timing of avian breeding and migration: evolutionary versus plastic changes. Evolutionary Applications, 7, 15–28. [DOI] [PMC free article] [PubMed] [Google Scholar]
- Crick, H.Q.P. , Dudley, C. , Glue, D.E. & Thomson, D.L. (1997) UK birds are laying eggs earlier. Nature, 388, 526–527. [Google Scholar]
- Dunn, P.O. & Møller, A.P. (2014) Changes in breeding phenology and population size of birds. Journal of Animal Ecology, 83, 729–739. [DOI] [PubMed] [Google Scholar]
- Dunning, J.B. (1992) CRC Handbook of Avian Body Masses. CRC Press, Boca Raton, FL, USA. [Google Scholar]
- Egger, M. , Smith, G.D. , Schneider, M. & Minder, C. (1997) Bias in meta‐analysis detected by a simple, graphical test. British Medical Journal, 315, 629–634. [DOI] [PMC free article] [PubMed] [Google Scholar]
- Feeny, P. (1970) Seasonal changes in oak leaf tannins and nutrients as a cause of spring feeding by winter moth caterpillars. Ecology, 51, 565–581. [Google Scholar]
- Felsenstein, J. (1985) Phylogenies and the comparative method. The American Naturalist, 125, 1–15. [DOI] [PubMed] [Google Scholar]
- Fitter, A.H. & Fitter, R.S.R. (2002) Rapid changes in flowering time in British plants. Science, 296, 1689–1691. [DOI] [PubMed] [Google Scholar]
- Franks, S.J. , Sim, S. & Weis, A.E. (2007) Rapid evolution of flowering time by an annual plant in response to a climate fluctuation. Proceedings of the National Academy of Sciences USA, 104, 1278–1282. [DOI] [PMC free article] [PubMed] [Google Scholar]
- Freckleton, R.P. , Harvey, P.H. & Pagel, M. (2002) Phylogenetic analysis and comparative data: a test and review of evidence. The American Naturalist, 160, 712–726. [DOI] [PubMed] [Google Scholar]
- Gelman, A. & Hill, J. (2007) Data Analysis Using Regression & Multilevel/Hierarchical Models. Cambridge University Press, Cambridge, UK. [Google Scholar]
- Gienapp, P. , Leimu, R. & Merilä, J. (2007) Responses to climate change in avian migration time – microevolution versus phenotypic plasticity. Climate Research, 35, 25–35. [Google Scholar]
- Gienapp, P. , Lof, M. , Reed, T.E. , McNamara, J. , Verhulst, S. & Visser, M.E. (2013) Predicting demographically sustainable rates of adaptation: can great tit breeding time keep pace with climate change? Philosophical Transactions of the Royal Society B, 368, 20120289. [DOI] [PMC free article] [PubMed] [Google Scholar]
- Gordo, O. , Brotons, L. , Ferrer, X. & Comas, P. (2005) Do changes in climate patterns in wintering areas affect the timing of the spring arrival of trans‐Saharan migrant birds? Global Change Biology, 11, 12–21. [Google Scholar]
- Gwinner, E. (1996) Circadian and circannual programmes in avian migration. Journal of Experimental Biology, 199, 39–48. [DOI] [PubMed] [Google Scholar]
- Hackett, S.J. , Kimball, R.T. , Reddy, S. et al (2008) A phylogenomic study of birds reveals their evolutionary history. Science, 320, 1763–1768. [DOI] [PubMed] [Google Scholar]
- Hadfield, J.D. (2010) MCMC methods for multi‐response generalized linear mixed models: the MCMCglmm R package. Journal of Statistical Software, 33, 1–22. [PMC free article] [PubMed] [Google Scholar]
- Hadfield, J.D. & Nakagawa, S. (2010) General quantitative genetic methods for comparative biology: phylogenies, taxonomies and multi‐trait models for continuous and categorical characters. Journal of Evolutionary Biology, 23, 494–508. [DOI] [PubMed] [Google Scholar]
- Halupka, L. , Dyrcz, A. & Boroweic, M. (2008) Climate change affects breeding of reed warblers Acrocephalus scirpaceus . Journal of Avian Biology, 39, 95–100. [Google Scholar]
- Harvey, P.H. & Pagel, M.D. (1991) The Comparative Method in Evolutionary Biology. Oxford University Press, Oxford, UK. [Google Scholar]
- Hedenström, A. (2006) Scaling of migration and the annual cycle of birds. Ardea, 94, 399–408. [Google Scholar]
- Hedenström, A. (2008) Adaptations to migration in birds: behavioural strategies, morphology and scaling effects. Philosophical Transactions of the Royal Society B, 363, 287–299. [DOI] [PMC free article] [PubMed] [Google Scholar]
- Hurlbert, A.H. & Liang, Z. (2012) Spatiotemporal variation in avian migration phenology: citizen science reveals effects of climate change. PLoS ONE, 7, e31709. [DOI] [PMC free article] [PubMed] [Google Scholar]
- Jetz, W. , Thomas, G.H. , Joy, J.B. , Hartmann, K. & Mooers, A.O. (2012) The global diversity of birds in space and time. Nature, 491, 444–448. [DOI] [PubMed] [Google Scholar]
- Jonzén, N. , Lindén, A. , Ergon, T. et al (2006) Rapid advance of spring arrival dates in long‐distance migratory birds. Science, 312, 1959–1961. [DOI] [PubMed] [Google Scholar]
- Lehikoinen, E. , Sparks, T.H. & Zalakevicius, M. (2004) Arrival and departure dates. Advances in Ecological Research, 35, 1–31. [Google Scholar]
- Lehikoinen, A. , Saurola, P. , Byholm, P. , Lindén, A. & Valkama, J. (2010) Life history events of the Eurasian sparrowhawk Accipiter nisus in a changing climate. Journal of Avian Biology, 41, 627–636. [Google Scholar]
- Li, Y. , Cohen, J.M. & Rohr, J.R. (2013) Review and synthesis of the effects of climate change on amphibians. Integrative Zoology, 8, 145–161. [DOI] [PubMed] [Google Scholar]
- Marra, P.P. , Francis, C.M. , Mulvihill, R.S. & Moore, F.R. (2005) The influence of climate on the timing and rate of spring bird migration. Oecologia, 142, 307–315. [DOI] [PubMed] [Google Scholar]
- Miller‐Rushing, A.J. , Primack, R.B. & Stymeist, R. (2008) Interpreting variation in bird migration times as observed by volunteers. The Auk, 125, 565–573. [Google Scholar]
- Møller, A.P. , Rubolini, D. & Lehikoinen, E. (2008) Populations of migratory bird species that did not show a phenological response to climate change are declining. Proceedings of the National Academy of Sciences of the USA, 105, 16195–16200. [DOI] [PMC free article] [PubMed] [Google Scholar]
- Moussus, J.‐P. , Clavel, J. , Jiguet, F. & Julliard, R. (2011) Which are the phenologically flexible species? A case study with common passerine birds. Oikos, 120, 991–998. [Google Scholar]
- Nakagawa, S. & Poulin, R. (2012) Meta‐analytic insights into evolutionary ecology: an introduction and synthesis. Evolutionary Ecology, 26, 1085–1099. [Google Scholar]
- Nakagawa, S. & Santos, E.S.A. (2012) Methodological issues and advances in biological meta‐analysis. Evolutionary Ecology, 26, 1253–1274. [Google Scholar]
- Pagel, M. & Lutzoni, R. (2002) Accounting for phylogenetic uncertainty in comparative studies of evolution and adaptation Biological Evolution & Statistical Physics (eds Lässig M. & Valleriani A.), pp. 148–161. Springer‐Verlag, Berlin, Germany. [Google Scholar]
- Parmesan, C. (2006) Ecological and evolutionary response to recent climate change. Annual Review of Ecology, Evolution, & Systematics, 37, 637–669. [Google Scholar]
- Parmesan, C. (2007) Influences of species, latitudes and methodologies on estimates of phenological response to global warming. Global Change Biology, 13, 1860–1872. [Google Scholar]
- Parmesan, C. & Yohe, G. (2003) A globally coherent fingerprint of climate change impacts across natural systems. Nature, 421, 37–42. [DOI] [PubMed] [Google Scholar]
- Phillimore, A.B. , Leech, D.I. , Pearce‐Higgins, J.W. & Hadfield, J.D. (2016) Passerines may be sufficiently plastic to track temperature‐mediated shifts in optimum lay date. Global Change Biology, 22, 3259–3272. [DOI] [PubMed] [Google Scholar]
- R Development Core Team . (2014) R: A Language and Environment for Statistical Computing. R Foundation for Statistical Computing, Vienna, Austria. [Google Scholar]
- Robbins, C.S. , Sauer, J.R. , Greenberg, R.S. & Droege, S. (1989) Population declines in North American birds that migrate to the Neotropics. Proceedings of the National Academy of Sciences of the USA, 86, 7658–7662. [DOI] [PMC free article] [PubMed] [Google Scholar]
- Rohatgi, A. (2015) WebPlotDigitizer. Available at: http://arohatgi.info/WebPlotDigitizer, Accessed 15 October 2015.
- Root, T.L. , Price, J.T. , Hall, K.R. , Schneider, S.H. , Rosenzweig, C. & Pounds, J.A. (2003) Fingerprints of global warming on wild animals and plants. Nature, 421, 57–60. [DOI] [PubMed] [Google Scholar]
- Roy, D.B. & Sparks, T.H. (2000) Phenology of British butterflies and climate change. Global Change Biology, 6, 407–416. [Google Scholar]
- Roy, D.B. , Oliver, T.H. , Botham, M.S. et al (2015) Similarities in butterfly emergence dates amongst populations suggest local adaptation to climate. Global Change Biology, 21, 3313–3322. [DOI] [PMC free article] [PubMed] [Google Scholar]
- Rubolini, D. , Saino, N. & Møller, A.P. (2010) Migratory behaviour constrains the phenological response of birds to climate change. Climate Research, 42, 45–55. [Google Scholar]
- Rubolini, D. , Møller, A.P. , Rainio, K. & Lehikoinen, E. (2007) Intraspecific consistency and geographic variability in temporal trends of spring migration phenology among European bird species. Climate Research, 35, 135–146. [Google Scholar]
- Saino, N. & Ambrosini, R. (2008) Climatic connectivity between Africa and Europe may serve as a basis for phenotypic adjustment of migration schedules of trans‐Saharan migratory birds. Global Change Biology, 14, 250–263. [Google Scholar]
- Sanderson, F.J. , Donald, P.F. , Pain, D.J. , Burfield, I.J. & Van Bommel, F.P.J. (2006) Long‐term population declines in Afro‐Palearctic migrant birds. Biological Conservation, 131, 93–105. [Google Scholar]
- Smith, R.J. & Moore, F.R. (2005) Arrival timing and seasonal reproductive performance in a long‐distance migratory landbird. Behavioural Ecology and Sociobiology, 57, 231–239. [Google Scholar]
- Southwood, T.R.E. , Wint, G.R.W. , Kennedy, C.E.J. & Greenwood, S.R. (2004) Seasonality, abundance, species richness and specificity of the phytophagous guild of insects on oak (Quercus) canopies. European Journal of Entomology, 101, 43–50. [Google Scholar]
- Sparks, T.H. & Braslavská, O. (2001) The effects of temperature, altitude and latitude on the arrival and departure dates of the swallow Hirundo rustica in the Slovak Republic. International Journal of Biometeorology, 45, 212–216. [DOI] [PubMed] [Google Scholar]
- Sparks, T.H. , Roberts, D.R. & Crick, H.Q.P. (2001) What is the value of first arrival dates of spring migrants in phenology? Avian Ecology and Behaviour, 7, 75–85. [Google Scholar]
- Sterne, J.A.C. & Egger, M. (2001) Funnel plots for detecting bias in meta‐analysis: guidelines on choice of axis. Journal of Clinical Epidemiology, 54, 1046–1055. [DOI] [PubMed] [Google Scholar]
- Stone, G.N. , Nee, S. & Felsenstein, J. (2011) Controlling for non‐independence in comparative analysis of patterns across populations within species. Philosophical Transactions of the Royal Society B: Biological Sciences, 366, 1410–1424. [DOI] [PMC free article] [PubMed] [Google Scholar]
- Thackeray, S.J. , Sparks, T.H. , Frederiksen, M. et al (2010) Trophic level asynchrony in rates of phenological change for marine, freshwater and terrestrial environments. Global Change Biology, 16, 3304–3313. [Google Scholar]
- Thackeray, S.J. , Henrys, P.A. , Hemming, D. et al (2016) Phenological sensitivity to climate across taxa and trophic levels. Nature, 535, 241–245. [DOI] [PubMed] [Google Scholar]
- Tryjanowski, P. & Sparks, T.H. (2001) Is the detection of the first arrival date of migrating birds influenced by population size? A case study of the red‐backed shrike Lanius collurio . International Journal of Biometeorology, 45, 217–219. [DOI] [PubMed] [Google Scholar]
- Usui, T. , Butchart, S.H.M. & Phillimore, A.B. (2016) Data from: Temporal shifts and temperature sensitivity of avian spring migratory phenology: a phylogenetic meta‐analysis. Dryad Digital Repository, 10.5061/dryad.mb4nd. [DOI] [PMC free article] [PubMed] [Google Scholar]
- Vedder, O. , Bouwhuis, S. & Sheldon, B.C. (2013) Quantitative assessment of the importance of phenotypic plasticity in adaptation to climate change in wild bird populations. PLoS Biology, 11, e1001605. [DOI] [PMC free article] [PubMed] [Google Scholar]
- Végvári, Z. , Bokóny, V. , Barta, Z. & Kovács, G. (2010) Life history predicts advancement of avian spring migration in response to climate change. Global Change Biology, 16, 1–11. [Google Scholar]
- Visser, M.E. & Both, C. (2005) Shifts in phenology due to global climate change: the need for a yardstick. Proceedings of the Royal Society of London B, 272, 2561–2569. [DOI] [PMC free article] [PubMed] [Google Scholar]
- Visser, M.E. , Van Noordwijk, A.J. , Tinbergen, J.M. & Lessells, C.M. (1998) Warmer springs lead to mistimed reproduction in great tits (Parus major). Proceedings of the Royal Society of B, 265, 1867–1870. [Google Scholar]
- Walther, G.‐R. , Post, E. , Convey, P. et al (2002) Ecological responses to recent climate change. Nature, 416, 389–395. [DOI] [PubMed] [Google Scholar]
- While, G.M. & Uller, T. (2014) Quo vadis amphibia? Global warming and breeding phenology in frogs, toads and salamanders. Ecography, 37, 921–929. [Google Scholar]
- Willis, C.G. , Ruhfel, B. , Primack, R.B. , Miller‐Rushing, A.J. & Davis, C.C. (2008) Phylogenetic patterns of species loss in Thoreau's woods are driven by climate change. Proceedings of the National Academy of Sciences of the USA, 105, 17029–17033. [DOI] [PMC free article] [PubMed] [Google Scholar]
- Wilman, H. , Belmaker, J. , Simpson, J. , de la Rosa, C. , Rivadeneira, M.M. & Jetz, W. (2014) EltonTraits 1.0: species‐level foraging attributes of the world's birds and mammals. Ecology, 95, 2027. [Google Scholar]
- Zalakevicius, M. , Bartkeviciene, G. , Raudonikis, L. & Janulaitis, J. (2006) Spring arrival response to climate change in birds: a case study from Eastern Europe. Journal of Ornithology, 147, 326–343. [Google Scholar]
Data Sources
- Adamík, P. & Pietruszková, J. (2008) Advances in spring but variable autumnal trends in timing of inland wader migration. Acta Ornithologica, 43, 119–128. [Google Scholar]
- Adams, I.S. (1945) Arrival and departure of greater snow geese in Quebec. Bird Banding, 16, 36–37. [Google Scholar]
- Ahola, M. , Laaksonen, T. , Sippola, K. , Eeva, T. , Rainio, K. & Lehikoinen, E. (2004) Variation in climate warming along the migration route uncouples arrival and breeding dates. Global Change Biology, 10, 1610–1617. [Google Scholar]
- Ananin, A.A. & Sokolov, L.V. (2009) Long–term arrival trends of 54 avian species to Barguzinsky Nature Reserve in northeastern Baikal area. Avian Ecology and Behaviour, 15, 33–48. [Google Scholar]
- Askeyev, O.V. , Sparks, T.H. , Askeyev, I.V. , Tishin, D.V. & Tryjanowski, P. (2010) East versus West: contrasts in phenological patterns? Global Ecology and Biogeography, 19, 783–793. [Google Scholar]
- Baerg, W.J. (1930) Bird migration records in northwest Arkansas. The Wilson Bulletin, 42, 45–50. [Google Scholar]
- Barbraud, C. & Weimerskirch, H. (2006) Antarctic birds breed later in response to climate change. Proceedings of the National Academy of Sciences of the USA, 103, 6248–6251. [DOI] [PMC free article] [PubMed] [Google Scholar]
- Barrett, R.T. (2002) The phenology of spring migration to north Norway: there was no evidence of a long–term trend in arrival dates of spring migrants over the last 20 years in north Norway. Bird Study, 49, 270–277. [Google Scholar]
- Barrett, R.T. (2011) Recent responses to climate change among migrant birds in northern Norway. Ringing & Migration, 26, 83–93. [Google Scholar]
- Barrett, R.T. (2014) Has climate change resulted in a mismatch between the spring arrival of the common cuckoo Cuculus canorus and its hosts in North Norway? Ornis Norvegica, 37, 11–14. [Google Scholar]
- Beaumont, L.J. , McAllan, I.A.W. & Hughes, L. (2006) A matter of timing: changes in the first date of arrival and last date of departure of Australian migratory birds. Global Change Biology, 12, 1339–1354. [Google Scholar]
- Bradley, N.L. , Leopold, A.C. , Ross, J. & Huffaker, W. (1999) Phenological changes reflect climate change in Wisconsin. Proceedings of the National Academy of Sciences of the USA, 96, 9701–9704. [DOI] [PMC free article] [PubMed] [Google Scholar]
- Browne, S.J. & Aebischer, N.J. (2003) Temporal changes in the migration phenology of turtle doves Streptopelia turtur in Britain, based on sightings from coastal bird observatories. Journal of Avian Biology, 34, 65–71. [Google Scholar]
- Butler, C.J. (2003) The disproportionate effect of global warming on the arrival dates of short–distance migratory birds in North America. Ibis, 145, 484–495. [Google Scholar]
- Chambers, L.E. , Beaumont, L.J. & Hudson, I.L. (2014) Continental scale analysis of bird migration timing: influences of climate and life history traits – a generalized mixture model clustering and discriminant approach. International Journal of Biometeorology, 58, 1147–1162. [DOI] [PubMed] [Google Scholar]
- Christen, W. (2007) Changes in spring arrival of some migratory bird species in the region of Solothurn, Switzerland. Ornithologischer Beobachter, 104, 53–63. [Google Scholar]
- Cotton, P.A. (2003) Avian migration phenology and global climate change. Proceedings of the National Academy of Sciences of the USA, 100, 11219–12222. [DOI] [PMC free article] [PubMed] [Google Scholar]
- DeLeon, R.L. , DeLeon, E.E. & Rising, G.R. (2011) Influence of climate change on avian migrants' first arrival dates. The Condor, 113, 915–923. [Google Scholar]
- Dolenec, Z. (2012) Non–significant trends towards earlier or later arrival date of the pied wagtail (Motacilla alba L.) in N.W. Croatia. Polish Journal of Ecology, 60, 851–854. [Google Scholar]
- Dolenec, Z. (2013) Implications of temperature change on spring arrival dates of chiffchaff (Pylloscopus collibyta Vieillot) in a site in Croatia. Current Science, 104, 700–702. [Google Scholar]
- Dolenec, Z. & Dolenec, P. (2010) Changes in spring migration of the wood pigeon (Columba palumbus) in northwestern Croatia. Turkish Journal of Zoology, 34, 267–269. [Google Scholar]
- Dolenec, Z. & Dolenec, P. (2010) Response of the blackcap (Sylvia Atricapilla L.) to temperature change. Polish Journal of Ecology, 58, 605–608. [Google Scholar]
- Dolenec, Z. & Dolenec, P. (2011) Spring migration characteristics of the house martin, Delichon urbica (Aves: Hirundinidae) in Croatia: a response to climate change? Zoologia, 28, 139–141. [Google Scholar]
- Dolenec, Z. , Kralj, J. , Sirovina, D. & Novak‐Kiš, D. (2013) Consequences of spring warming for the black redstart (Phoenicurus ochruros) in N.W. Croatia. Pakistan Journal of Zoology, 45, 878–881. [Google Scholar]
- Donnelly, A. , Geyer, H. & Yu, R. (2015) Changes in the timing of departure and arrival of Irish migrant waterbirds. PeerJ, 3, 2726. [DOI] [PMC free article] [PubMed] [Google Scholar]
- Eckert, J. (2014) Arrival dates of migrant bush birds in the Strathalbyn district: a 45 year collaborative study. South Australian Ornithologist, 39, 58–73. [Google Scholar]
- Eddowes, M.J. (2011) Longer term trends in arrival timing of long distance migrants: the influence of abundance and population change. Ringing & Migration, 26, 56–63. [Google Scholar]
- Eddowes, M.J. (2012) Evidence that rates of advancement of long–distance passerine migrant arrival in the UK have been higher among earlier–arriving species. Ringing & Migration, 27, 60–63. [Google Scholar]
- Ellwood, E.R. , Primack, R.B. & Talmadge, M.L. (2010) Effects of climate change on spring arrival times of birds in Thoreau's Concord from 1851 to 2007. The Condor, 112, 754–762. [Google Scholar]
- Foster, C.R. , Amos, A.F. & Fuiman, L.A. (2010) Phenology of six migratory coastal birds in relation to climate change. The Wilson Journal of Ornithology, 122, 116–125. [Google Scholar]
- Goodenough, A.E. , Hart, A.G. & Elliot, S.L. (2011) What prevents phenological adjustment to climate change in migrant bird species? Evidence against the “arrival constraint” hypothesis. International Journal of Biometeorology, 55, 97–102. [DOI] [PubMed] [Google Scholar]
- Goodenough, A.E. , Hart, A.G. & Stafford, R. (2010) Is adjustment of breeding phenology keeping pace with the need for change? Linking observed response in woodland birds to changes in temperature and selection pressure. Climatic Change, 102, 687–697. [Google Scholar]
- Gordo, O. & Doi, H. (2012) Drivers of population variability in phenological responses to climate change in Japanese birds. Climate Research, 54, 95–112. [Google Scholar]
- Green, K. (2010) Alpine taxa exhibit differing responses to climate warming in the Snowy Mountains of Australia. Journal of Mountain Science, 7, 167–175. [Google Scholar]
- Gretch, M. (2008) Spring arrival of tree swallows and eastern phoebe in the Adirondacks. The Kinbird, 58, 230–232. [Google Scholar]
- Gunnarsson, T.G. & Tómasson, G. (2011) Flexibility in spring arrival of migratory birds at northern latitudes under rapid temperature changes. Bird Study, 58, 1–12. [Google Scholar]
- Huin, N. & Sparks, T.H. (1998) Arrival and progression of the swallow Hirundo rustica through Britain. Bird Study, 45, 361–370. [Google Scholar]
- Huin, N. & Sparks, T.H. (2000) Spring arrival patterns of the cuckoo Cuculus canorus, nightingale Luscinia megarhynchos and spotted flycatcher Musciapa striata in Britain. Bird Study, 47, 22–31. [Google Scholar]
- Hüppop, O. & Hüppop, K. (2003) North Atlantic Oscillation and timing of spring migration in birds. Proceedings of the Royal Society of London B, 270, 233–240. [DOI] [PMC free article] [PubMed] [Google Scholar]
- Hüppop, O. & Winkel, W. (2006) Climate change and timing of spring migration in the long–distance migrant Ficedula hypoleuca in central Europe: the role of spatially different temperature changes along migration routes. Journal of Ornithology, 147, 344–353. [Google Scholar]
- Hurlbert, A.H. & Liang, Z. (2012) Spatiotemporal variation in avian migration phenology: citizen science reveals effects of climate change. PLoS ONE, 7, e31662. [DOI] [PMC free article] [PubMed] [Google Scholar]
- Jenkins, D. & Sparks, T.H. (2010) The changing bird phenology of Mid Deeside, Scotland 1974–2010. Bird Study, 57, 401–414. [Google Scholar]
- Jones, G.M. , Zuckerberg, B. & Paulios, A.T. (2012) The early bird gets earlier: a phenological shift in migration timing of the American robin (Turdus migratorius) in the state of Wisconsin. The Passenger Pigeon, 74, 131–142. [Google Scholar]
- Kaňuščák, P. , Hromada, M. , Tryjanowski, P. & Sparks, T.H. (2004) Does climate at different scales influence the phenology and phenotype of the river warbler Locustella fluviatilis? Global Change Biology, 141, 158–163. [DOI] [PubMed] [Google Scholar]
- Khaleghizadeh, A. (2005) Phenology of the common swift Apus apus in the middle east – Tehran, Iran. Sandgrouse, 27, 79–81. [Google Scholar]
- Kolářová, E. & Adamík, P. (2015) Bird arrival dates in central Europe based on one of the earliest phenological networks. Climate Research, 63, 91–98. [Google Scholar]
- Kralj, J. & Dolenec, Z. (2008) First arrival dates of the nightingale (Luscinia megarhynchos) to central Croatia in the early 20th and at the turn of the 21st century. Central European Journal of Biology, 3, 295–298. [Google Scholar]
- Ledneva, A. , Miller‐Rushing, A.J. , Primack, R.B. & Imbres, C. (2004) Climate change as reflected in a naturalist's diary, Middleborough, Massachusetts. The Wilson Bulletin, 116, 224–231. [Google Scholar]
- Lehikoinen, E. , Sparks, T.H. & Zalakevicius, M. (2004) Arrival and departure dates. Advances in Ecological Research, 35, 1–31. [Google Scholar]
- Marra, P.P. , Francis, C.M. , Mulvihill, R.S. & Moore, F.R. (2005) The influence of climate on the timing and rate of spring bird migration. Oecologia, 142, 307–315. [DOI] [PubMed] [Google Scholar]
- Miller‐Rushing, A.J. , Lloyd‐Evans, T.L. , Primack, R.B. & Satzinger, P. (2008) Bird migration times, climate change, and changing population sizes. Global Change Biology, 14, 1959–1972. [Google Scholar]
- Miller‐Rushing, A.J. , Primack, R.B. & Stymeist, R. (2008) Interpreting variation in bird migration times as observed by volunteers. The Auk, 125, 565–573. [Google Scholar]
- Mills, A.M. (2005) Changes in the timing of spring and autumn migration in North American migrant passerines during a period of global warming. Ibis, 147, 259–269. [Google Scholar]
- Møller, A.P. , Flensted‐Jensen, E. & Mardal, W. (2009) Adjustment of the annual cycle to climatic change in a long–lived migratory bird species. Current Zoology, 55, 92–101. [Google Scholar]
- Murphy‐Klassen, H.M. , Underwood, T.J. , Sealy, S.G. & Czyrnyj, A.A. (2005) Long–term trends in spring arrival dates of migrant birds at Delta Marsh, Manitoba, in relation to climate change. The Auk, 122, 1130–1148. [Google Scholar]
- Nakata, M. , Chino, N. , Chiba, A. et al (2011) Chronological trends in the timing of spring bird migration and its relationship with temperature in a coastal forest near the city of Niigata. Japan Journal of Ornithology, 60, 63–72. [Google Scholar]
- Peintinger, M. & Schuster, S. (2005) Changes in first arrival dates of common migratory bird species in southwestern Germany. Vogelwarte, 43, 161–169. [Google Scholar]
- Peñuelas, J. , Filella, I. & Comas, P. (2002) Changed plant and animal life cycles from 1952 to 2000 in the Mediterranean region. Global Change Biology, 8, 531–544. [Google Scholar]
- Ptaszyk, J. , Kosicki, J. , Sparks, T.H. & Tryjanowski, P. (2003) Changes in the timing and pattern of arrival of the white stork (Ciconia ciconia) in western Poland. Journal of Ornithology, 144, 323–329. [Google Scholar]
- Robson, D. & Barriocanal, C. (2011) Ecological conditions in wintering and passage areas as determinants of timing of spring migration in trans–Saharan migratory birds. Journal of Animal Ecology, 80, 320–331. [DOI] [PubMed] [Google Scholar]
- Rubolini, D. , Ambrosini, R. , Caffi, M. , Brichetti, P. , Armiraglio, S. & Saino, N. (2007) Long–term trends in first arrival and first egg laying dates of some migrant and resident bird species in northern Italy. International Journal of Biometeorology, 51, 553–563. [DOI] [PubMed] [Google Scholar]
- Smith, P. & Smith, J. (2012) Climate change and bird migration in south–eastern Australia. Emu, 112, 333–342. [Google Scholar]
- Sokolov, L.V. (2006) Effect of global warming on the timing of migration and breeding of passerine birds in the 20th century. Zoologicheskii Zhurnal, 85, 317–341. [Google Scholar]
- Sokolov, L.V. & Gordienko, N.S. (2008) Has recent climate warming affected the dates of bird arrival to the Il'men Reserve in the southern Urals? Russian Journal of Ecology, 39, 56–62. [Google Scholar]
- Sokolov, L.V. , Shapoval, A.P. & Morozov, Y.G. (2012) Impact of climate change on the timing of migration, dispersal and numbers of the sparrowhawk Accipiter nisus in the Baltic region. Avian Ecology and Behaviour, 22, 3–34. [Google Scholar]
- Sparks, T.H. , Huber, K. , Bland, R.L. et al (2007) How consistent are trends in arrival (and departure) dates of migrant birds in the UK? Journal of Ornithology, 148, 503–511. [Google Scholar]
- Stervander, M. , Lindström, A. , Jonzén, N. & Andersson, A. (2005) Timing of spring migration in birds: long–term trends, North Atlantic Oscillation and the significance of different migration routes. Journal of Avian Biology, 36, 210–221. [Google Scholar]
- Strode, P.K. (2003) Implications of climate change for North American wood warblers (Parulidae). Global Change Biology, 9, 1137–1144. [Google Scholar]
- Swanson, D.L. & Palmer, J.S. (2009) Spring migration phenology of birds in the northern prairie region is correlated with local climate change. Journal of Field Ornithology, 80, 351–363. [Google Scholar]
- Tryjanowski, P. , Sparks, T.H. , Kuźniak, S. , Czechowski, P. & Jerzak, L. (2013) Bird migration advances more slowly in urban environments. PLoS ONE, 8, e63482. [DOI] [PMC free article] [PubMed] [Google Scholar]
- Van Buskirk, J. , Mulvihill, R.S. & Leberman, R.C. (2009) Variable shifts in spring and autumn migration phenology in North American songbirds associated with climate change. Global Change Biology, 15, 760–771. [Google Scholar]
- Weidinger, K. & Kral, M. (2007) Climatic effects on arrival and laying dates in a long–distance migrant, the collard flycatcher Ficedula albicollis . Ibis, 149, 836–847. [Google Scholar]
- Zalakevicius, M. (2002) Biophysical impacts of climate change on bird populations and migration in Lithuania. GeoJournal, 57, 183–193. [Google Scholar]
Associated Data
This section collects any data citations, data availability statements, or supplementary materials included in this article.
Supplementary Materials
Table S1. Taxonomic coverage of the data set used in meta‐analysis.
Table S2. Geographical coverage of the data set used in meta‐analysis.
Table S3. Model coefficients from the analyses of year slopes (days year−1) in basic and ecological models.
Table S4. Model coefficients from the analyses of temperature slopes (day °C−1) in basic and ecological models.
Data Availability Statement
Data available from the Dryad Digital Repository: http://dx.doi.org/10.5061/dryad.mb4nd (Usui, Butchart & Phillimore 2016).