

Abstract
Widespread human action and behavior change is needed to achieve many conservation goals. Doing so at the requisite scale and pace will require the efficient delivery of outreach campaigns. Conservation gains will be greatest when efforts are directed toward places of high conservation value (or need) and tailored to critical actors. Recent strategic conservation planning has relied primarily on spatial assessments of biophysical attributes, largely ignoring the human dimensions. Elsewhere, marketers, political campaigns, and others use microtargeting—predictive analytics of big data—to identify people most likely to respond positively to particular messages or interventions. Conservationists have not yet widely capitalized on these techniques. To investigate the effectiveness of microtargeting to improve conservation, we developed a propensity model to predict restoration behavior among 203,645 private landowners in a 5,200,000 ha study area in the Chesapeake Bay Watershed (U.S.A.). To isolate the additional value microtargeting may offer beyond geospatial prioritization, we analyzed a new high‐resolution land‐cover data set and cadastral data to identify private owners of riparian areas needing restoration. Subsequently, we developed and evaluated a restoration propensity model based on a database of landowners who had conducted restoration in the past and those who had not (n = 4978). Model validation in a parallel database (n = 4989) showed owners with the highest scorers for propensity to conduct restoration (i.e., top decile) were over twice as likely as average landowners to have conducted restoration (135%). These results demonstrate that microtargeting techniques can dramatically increase the efficiency and efficacy of conservation programs, above and beyond the advances offered by biophysical prioritizations alone, as well as facilitate more robust research of many social–ecological systems.
Keywords: conservation marketing, land‐use planning, private lands, resource allocation, return on investment, spatial planning, systematic conservation planning, triage, asignación de recursos, mercadotecnia de la conservación, planeación espacial, planeación sistemática de la conservación, planeación del uso de suelo, protocolo de intervención, retorno de la inversión, tierras privadas, 保护营销学, 土地利用规划, 私有土地, 资源分配, 投资收益, 空间规划, 系统保护规划, 优先等级分类
Short abstract
Article impact statement: Microtargeting boosts conservation impact by finding willing partners and individualizing behavior‐change interventions.
Micro‐focalización para la Conservación
Resumen
Se necesitan acciones humanas diseminadas y un cambio en el comportamiento para lograr muchos objetivos de conservación. Que se logre esto a la escala y al ritmo requerido requerirá de la entrega eficiente de las campañas de participación. Las ganancias de la conservación serán mayores cuando los esfuerzos estén dirigidos hacia sitios con un alto valor (o necesidad) de conservación y estén personalizados para los actores más importantes. La reciente planeación estratégica de la conservación ha dependido principalmente de las evaluaciones espaciales de los atributos biofísicos, ignorando generalmente las dimensiones humanas. En otros ámbitos, los mercadólogos, las campañas políticas, así como otros, usan la micro‐focalización – el análisis predictivo de datos masivos – para identificar a las personas con mayor probabilidad de responder positivamente a mensajes o intervenciones particulares. Los conservacionistas todavía no han capitalizado extensamente estas técnicas. Desarrollamos un modelo de tendencia para predecir el comportamiento de restauración entre 203,645 terratenientes privados en un área de estudio de 5,200,000 ha en la cuenca de la Bahía de Chesapeake (E.U.A.) y así investigar la eficiencia de la micro‐focalización en el aumento de la conservación. Para aislar el valor adicional que puede ofrecer la micro‐focalización más allá de la priorización geoespacial, analizamos un nuevo conjunto de alta resolución de datos sobre la cobertura del suelo y datos catastrales para identificar a los terratenientes privados de áreas ribereñas que necesitan restauración. Después de esto, desarrollamos y evaluamos el modelo de tendencia a la restauración basado en una base de datos de terratenientes que han realizado restauraciones en el pasado y aquellos que no (n = 4,978). La validación del modelo en una base de datos paralela (n = 4,989) mostró que los terratenientes con los puntajes más altos para la tendencia a la restauración (es decir, el decil superior) tenían el doble de probabilidad de haber realizado acciones de conservación que el terrateniente promedio (135%). Estos resultados muestran que las técnicas de micro‐focalización pueden incrementar dramáticamente la eficiencia y la eficacia de los programas de conservación, más allá de los avances ofrecidos sólo por las priorizaciones biofísicas, así como facilitar la investigación más sólida sobre muchos sistemas socio‐ecológicos.
摘要
许多保护目标的实现都需要广泛的行动和行为转变, 要以必要的规模和速度完成这些转变, 则需要有效开展宣传活动。只有在开展工作时针对具有高保护价值 (或需求) 的地区和关键的实践者, 才能取得最大的保护成效。然而, 近期的战略保护规划主要依赖于对生物物理属性的空间尺度评估, 在很大程度上忽略了人类因素。而在如市场营销、政治活动和其它领域常用微目标的方法 (即大数据预测分析) 来识别最有可能对特定信息或干预措施作出积极响应的人群。这样的方法在保护实践者中尚未被广泛采用。为了研究微目标是否有助于保护, 我们开发了一个偏好模型来预测美国切萨皮克海湾流域 (Chesapeake Bay Watershed) 5,200,000公顷的研究区域内, 203,645名私有土地拥有者的生态恢复行为。为了确定在地理空间保护优先级划分之外, 微目标的方法可能提供的额外价值, 我们利用一套新的高精度土地覆盖数据集和地籍数据找出了需要恢复的河岸区域土地拥有者。接下来, 我们开发并评估了一个恢复偏好模型, 该模型是基于曾经进行过恢复的土地拥有者和没有进行过恢复的土地拥有者的数据库 (n = 4,978) 构建的。平行数据库 (n = 4,989) 的模型验证表明, 进行恢复的倾向性得分最高的土地拥有者 ( 前百分之十) 采取恢复行动的可能性是平均得分的土地拥有者的两倍多 (135%) 。这些结果表明, 微目标方法可以大大提高保护项目的效率和效能, 其意义超越单一的生物物理保护优先级划分, 且可以推动许多社会生态系统的有力研究。【翻译: 胡怡思; 审校: 聂永刚】
Introduction
Conservation opportunities are distributed unevenly across landscapes, and spatial prioritization can help maximize returns on investment, especially when they account for social and ecological variability. Yields will be largest in places of high ecological value where people are likely to take conservation action (Fig. 1). Existing efforts to identify areas of high conservation value have relied primarily on biophysical variables (Fig. 1), an important first step for guiding investments (Naidoo et al. 2008; Belote et al. 2017). Conservation, however, is a social endeavor dependent on human decision making and behavior (Mascia et al. 2003; Schultz 2011). Efforts to enhance conservation prioritizations through rigorous integration of social and ecological data have been frustrated by data availability and incompatible resolutions. Biophysical prioritizations are proliferating due to a revolution in remotely sensed data and analysis techniques, and although they are generally limited to coarse spatial scales (e.g., 30 m2) by cost or technology (Kwok 2018), this is changing rapidly as technology advances (e.g., the land‐cover data used in the current study are at 1 m2 resolution). In contrast, estimates of social propensity for conservation behavior (Fig. 1), if considered at all, are generally made for entire populations, doing little to predict conservation action of individuals living in or owning important places. These social data and analysis limitations are especially challenging when prioritizing landscapes with substantial private land ownership where conservation is a collective product of many landowners’ individual management actions.
Figure 1.

Conceptual conservation‐priority space defined by conservation value and social propensity for conservation action (prime prospects, areas where conservation value and social propensity are both high; premium, areas of high value where social propensity is low; trivial, areas with lower conservation value despite likely conservation action; sinks, areas where conservation value and social propensity for action are both low).
Recent advances in consumer data availability and analysis techniques may provide opportunities to predict individuals’ propensities toward conservation behaviors, helping to overcome these challenges and improve the efficiency and efficacy of conservation programs. For example, land trusts could identify landowners more willing to sell or donate conservation easements, reducing recruitment and development costs, or groups promoting proconservation behavior could identify people for whom particular intervention strategies are most likely to succeed, increasing program effectiveness. However, most human dimensions data (e.g., qualitative interviews and quantitative surveys) and analyses, where they exist at all, do not allow characterization of individuals in a population, affording instead only estimates of population‐level trends or parameters. If data were available for every individual in a population, conservationists could deliver individualized content, incentives, or programming and likely increase return on conservation investments (i.e., outcomes per unit invested).
Increasingly, data are in fact available for most individuals in society, but they do not fit the mold of traditional conservation behavior models and thus have largely been overlooked by conservationists. Behavioral theories are extremely useful for understanding the why behind proenvironmental behaviors and for designing effective behavior change interventions. For example, social norms can often strongly influence behavior (Schultz et al. 2018); Ajzen (2012) reasoned action approach has long shown that behaviors are more likely when attitudes toward a behavior are positive (even more so if the behavior is intended); and recent advancements in behavioral economics suggest choice architecture and other biases strongly determine environmental behavior (Sunstein & Reisch 2014). Powerful interventions can be designed using these theories, but despite increasing theoretical sophistication, data are rarely available to identify who within a population is prone to a particular behavior or likely to respond a specific intervention. Consider that even when theory suggests (and survey work or experimentation confirm) landowners with positive attitudes toward wildlife conservation are more likely to donate a conservation easement, there remain no attitudinal data to identify who those individuals are in any given population. In contrast, publicly available consumer data are widely available, and while they rarely include variables relevant to behavioral models, they afford robust pattern‐detection analysis (i.e., analytics) to identify individuals belonging to particular population segments, which can be used to enhance myriad outreach efforts.
Consumer data are widely available and generally include purchasing history and identifying information, although it is often combined with other streams of data such as voting behavior, social media activity, or mobile application use to enable robust pattern detection analyses. Methods for analyzing publicly available consumer data sets have been pioneered in other fields to predict behavioral propensity for each (or most) individuals in many different populations (Berry & Linoff 2004). Marketers, charities, and political campaigns have used such data to microtarget individuals (Fig. 2) and realized profound efficiencies in their operations. For instance, with a small group of past known participants, consumer data can be mined to identify likely future participants from large and otherwise nebulous populations ([i] in Fig. 2). Or, if market segments have been identified through prior analysis, consumer data sets can be mined to estimate which segment each population member is likely to belong ([ii] in Fig. 2). Specific applications of these techniques in other fields include online advertisers who employ “behavioral targeting” to understand users’ preferences (Jaworska & Sydow 2008), political campaigns that use “microtargeting” to differentiate and motivate voters (Murray & Scime 2010), and energy suppliers using “load profiling” to predict household energy demand (Wang et al. 2015). Although microtargeting, or big data analytics, is transforming marketing and other fields (Erevelles et al. 2016), they have received little attention in the conservation realm, with exceptions focusing on consumers of environmentally related products, such as electric vehicles (Eppstein et al. 2011) and green energy (Tabi et al. 2014). Some efforts have moved toward this idea, including social marketing to improve efficiencies in conservation‐outreach programing (McKenzie‐Mohr et al. 2012) and numerous attempts to build conservation‐related typologies of the public (Maibach et al. 2009) or landowners (Metcalf et al. 2016). Still, these marketing‐based approaches inform message development for mass broadcast, contributing little to customized appeals at the individual level.
Figure 2.

Examples of microtargeting use of consumer data to (i) identify likely participants in conservation programs from lists of past known participants and (ii) identify likely members of population segments based on known market segments.
Microtargeting may prove useful in many conservation contexts, including in private land settings where strategic conservation planning based on spatial analysis of biophysical attributes can be directly coupled to individual landowner decisions and behavior. Private lands are critical to many global conservation efforts (Kamal et al. 2015), and propensity models predicting landowner receptivity toward conservation behaviors could help improve return on investments made by outreach agencies and organizations to promote stewardship. Data enabling these analyses are increasingly available, yet often untapped for such purposes. For example, spatial cadastral parcel databases are proliferating in the United States and can be intersected with spatial assessments of conservation value to enumerate owners of priority properties (Ver Planck et al. 2016). Some analyses have used cadastral data to begin generating parcel‐ or property‐level predictive models, but rely solely on biophysical variables. More specifically, some have investigated spatial patterns of ownership and resource parcelization (Kilgore et al. 2013; Zipp et al. 2017), whereas others have ranked priority parcels based on resource location, cost, risk, or other variables (Smith et al. 2016), and a few have predicted land use change based on biophysical variables such as parcel size, shape, proximity to landscape features, or resource co‐occurrence (Nelson et al. 2008). No studies we are aware of have capitalized on widely available consumer data to inform individual‐level propensity models of private lands conservation behavior. A few studies have coupled social and biophysical variables to prioritize landscapes, either by summarizing social receptivity based on qualitative data (Game et al. 2011) or by using coarse‐resolution data over wide extents (Guerrero & Wilson 2017; Karimi et al. 2017). Some have used agent‐based modeling to represent the complexity of social and ecological interrelationships (Miyasaka et al. 2017), and one study by Nielsen et al. (2017) coupled cadastral and forest‐cover data to a national registry of conservation‐program participation, the latter being a data set unique to Denmark and unavailable elsewhere.
Microtargeting techniques adapted for conservation contexts could enable more widespread consideration of variation in social dimensions relevant to conservation objectives and enhance strategic conservation planning as well as implementation. Microtargeting is not a substitute for other human dimensions research, but can instead enhance practical applications of research findings. For example, developing effective behavior change interventions will always require theoretical insight and empirical evaluation, but once effective outreach strategies are identified, microtargeting can help deliver them to the people for whom they are most likely to be effective. Coupling these approaches to spatial prioritizations can help conservation outreach efforts reach the right people in the right places for the least cost.
We explored the potential utility of microtargeting for conservation. The private lands that dominate the Pennsylvania portion of the Chesapeake Bay Watershed (U.S.A.) (see Supporting Information) offered an opportune study area where restoration of riparian areas is needed to achieve water‐quality goals in the Chesapeake Bay (Lowrance et al. 1997). More specifically, Pennsylvania (an area nearly double our study area) seeks to revegetate nearly 55,000 ha of riparian areas to achieve a 3,600,000 kg reduction in nitrogen pollution (M. Keefer, personal communication). Based on the mean size of past restoration projects (1.9 ha), this will require participation of nearly 29,000 landowners across the state. We sought to provide an approach that could enhance restoration efforts in the watershed; demonstrate how consumer data‐driven, individual‐level propensity models can be coupled to strategic conservation planning efforts; begin to quantify the value microtargeting adds, if any, to such geospatial prioritizations; and extend discussions of how marketing methods may be more effectively employed to advance conservation objectives.
Methods
Overview
To understand the value offered by microtargeting above and beyond traditional geospatial prioritizations, we began by developing high‐resolution (1 m2) land‐cover and stream‐network data sets. We used these to assess the condition of riparian buffers (i.e., areas within 11 m of streams) (Natural Resources Conservation Service 2010). We overlaid this biophysical inventory with spatially explicit cadastral data to enumerate the population of riparian buffer gap owners in our study area (i.e., owners of riparian areas within 11 m of streams with nonforest and nonshrubland land cover). We manually searched and reviewed owner records to remove public ownerships (because attribute data did not consistently identify all public lands), thus completing the biophysical portion of our prioritization. Then, to assess the additional value offered by microtargeting, we used a database of known past buffer‐program participants and nonparticipants to build a model that predicts buffer‐restoration program participation (i.e., participation propensity). We evaluated model performance with a similar data set reserved for validation. Finally, we generated a coupled ranking score for 203,645 properties within the study area based on biophysical (i.e., size of buffer gap) and social (i.e., landowner propensity score) variables. Field validation of model performance is underway, including a social marketing campaign (Metcalf et al. 2019) and on‐the‐ground recruitment of landowners into buffer restoration programs. Both are being implemented under experimental designs where response rates and buffer installations will be measured as functions of model propensity scores.
High‐Resolution Land‐Cover Data
Guided by the Chesapeake Bay Program partnership, the Chesapeake Conservancy led the creation of our land‐cover data set. The University of Vermont Spatial Analysis Laboratory (UVM) performed the supervised classification known as object‐based image analysis based on National Agricultural Imagery Program quarter‐quad images from 2013, PA orthophotos from 2003 to 2006, and light detection and ranging (LiDAR) data from 2006 to 2008. Analysts created image stacks where these data sets overlapped geographically and then divided them into homogenous regions based on similarities between neighboring pixels (Blaschke 2010). Using these image objects, analysts identified distinguishing characteristics of regions in a series of if–then rules. For example, water features typically returned low values of near‐infrared radiation, so a rule assigned all image objects with low near‐infrared values to the water bodies class. In this way, rules were used to classify image objects until a desired level of accuracy was achieved. Postclassification, analysts applied manual corrections to improve accuracy and appearance, and incorporated local planimetric data sets where available, such as edge of pavement or roads. Twelve classes of land cover were created: water, wetlands, tree canopy, shrubland, low vegetation, barren, structures, impervious surfaces, impervious roads, tree canopy over structures, tree canopy over impervious surfaces, and tree canopy over impervious roads. The data set is 90% accurate (Pallai & Wesson 2017).
To locate water bodies, and subsequently riparian areas, relative to this new, high‐resolution land‐cover data set, we used a D8 algorithm on LiDAR‐derived digital elevation models to assign flow direction to each pixel according to the direction of steepest descent (O'Callaghan & Mark 1984). Flow was accumulated across the landscape, and pixels that drained more than 24.3 ha were identified as part of the stream network (see Tarboton and Ames [2001] for discussion of challenges with area‐based stream initiation assumptions). We estimated channel widths based on regional curves published by the U.S. Geological Survey (Krstolic & Chaplin 2007). Widened channels were merged with the high‐resolution land‐cover water class to create an enhanced flow path network. We defined riparian buffers as areas within 11 m of the enhanced‐flow path network with buffers composed of tree canopy or shrubland land‐cover classes, and we defined gaps as all other land‐cover types. In total, the data set covered 25,899,881 ha (see Supporting Information for full data set).
Microtargeting Analysis
To develop the predictive model of landowner propensity for buffer restoration, we conducted an analysis of both property and owner attributes with commercially available data. We began with a list of known buffer‐restoration program participants acquired from the Pennsylvania Department of Environmental Protection. This list contained landowners who had partnered with a variety of NGOs and governmental agencies to restore riparian buffer areas on their properties between 2003 and 2015 (initial n = 7440). To contrast these known participants with nonparticipants, we intersected riparian gaps with cadastral data to enumerate the population of gap‐owning landowners, and extracted a simple random sample of landowners with gaps of at least 0.04 ha (initial n = 9400). This was based on the assumption that landowners who had participated in buffer‐restoration programs would no longer have buffer gaps of this size. Instances where this assumption was false would suppress model performance (rather than overestimate). We purchased consumer and property data from a reputable vendor, TargetSmart, for approximately US$2,200 and matched them to the riparian owner population and past participant data sets based on combinations of name and location (e.g., surname and ZIP code). These data contained over 800 variables including demographics (e.g., age and gender), consumer behavior, property‐level attributes (e.g., size, price, and date of last purchase for both land and structures), and many other variables about individuals’ voting history, area of residence, and commercial interests (see Supporting Information for data dictionary). Match rates were 30% for known participants (final n = 2259) and 66% for assumed nonparticipants (final n = 7708). We merged these lists (summed n = 9967) before randomly dividing them in half to create training (n = 4978) and validation (n = 4989) data sets.
We ran a developmental stepwise logistic regression with the training data set to contrast known participants with nonparticipants and then used predictive variables from the output to calculate a propensity score for those landowners in the training, validation, and full riparian‐owner‐population data sets for whom consumer data were available. Our goal for this developmental analysis was to maximize variance explained by the model (without overfitting), rather than to isolate predictive or causal variables, such as those suggested by theory (final model in Supporting Information). We evaluated model performance with a second logistic regression model within the validation data set to test the prediction that propensity score could differentiate between participants and nonparticipants. We grouped propensity scores into deciles and tallied actual participation rates within each decile for both training and validation data sets to facilitate interpretation and communication. We used the product of property riparian buffer gap area and propensity score decile to calculate a coupled ranking score for each parcel (Fig. 3). All research methods were reviewed and approved by the Institutional Review Boards at Penn State University and the University of Montana.
Figure 3.
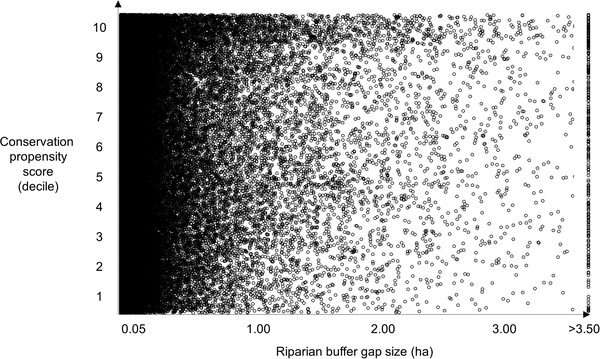
Properties with riparian gaps (i.e., nonforest and nonshrub areas within 11 m of streams) jointly ranked by gap size and owner's score for propensity to participate in conservation (jittered deciles). Properties with gaps >3.50 ha are clustered at 3.50 ha in the figure for clarity.
Results
The study area covered 5,529,100 ha and included over 82,000 km of stream network. All riparian buffer areas totaled 136,028 ha and buffer gaps constituted 38,882 ha (22.2%). Riparian buffer gaps were owned by a total of 201,647 landowners, with an inverse J‐shaped distribution based on hectares of gaps on the property. A plurality of buffer gap hectares were found on properties with large gaps; 19% of all buffer gap hectares were on properties with at least 2 ha of buffer gaps, whereas properties with small gaps (i.e., <0.04 ha) were numerous (n = 106,977) yet accounted for only 1.4% of all buffer gap hectares.
Consumer data were successfully matched to nearly two‐thirds of nonpublic, riparian gap owners (60%). These owners controlled 46% of all buffer gap hectares. A small percentage of owners was classified as public (2.4%) controlling 7.4% of buffer gap hectares; these are minimum estimates because some public owners were likely missed in the manual classification process. Just over 9% of nonpublic owners were unscorable because owner names were businesses, limited liability corporations, trusts, partnerships, associations, or other types of owners that were not compatible with consumer databases. These unscorable owners controlled 18% of buffer gap hectares. About 30% of nonpublic riparian owners were unscored for some other reason (e.g., names misaligned with consumer data due to misspellings or errors, owners unrepresented in consumer data); these unscored owners controlled 29% of buffer gap hectares.
The developmental stepwise logistic regression successfully differentiated between known buffer‐program participants and nonparticipants in the training data set, correctly identifying 79.1% of participants with a cut value of 0.500 (χ 2 = 628.602; df = 11; p < 0.001; Cox and Snell R 2 = 0.119; Nagelkerke R 2 = 0.184). The model performed similarly well in the validation data set, correctly identifying 78.6% of participants (B = –5.913, Wald = 476.563; df = 1; p < 0.001; Cox and Snell R 2 = 0.104; Nagelkerke R 2 = 0.157).
The overall participation rate (percentage of known participants) in the validation data set was 23%. Participation rates were higher within each subsequent propensity score decile, with a participation rate of 3% in the bottom decile and 54% in the top decile (Fig. 4). Thus, the participation rate in the top decile was 2.3 times higher than the average participation rate in the overall validation data set, and 18 times higher than the participation rate in the bottom decile.
Figure 4.

Percentage of known buffer‐restoration program participants in the training and validation data sets by score for propensity to participate in restoration.
Discussion
Conservation requires behavior change (Cinner 2018), yet resources to inspire such change are often limited. Microtargeting can help identify individuals with higher propensity toward particular behaviors, or those for whom particular interventions are more likely to succeed. Applications of these techniques to conservation challenges may help increase the efficiency and effectiveness of conservation programs. Toward efficiency, microtargeting may help conservationists identify individuals most likely to participate in specific programs, or engage in specific behaviors (Fig. 2). To increase efficacy, microtargeting may help deliver customized interventions designed for different market segments of a target population (Fig. 2). Unlike most approaches to conservation behavior change research or interventions, microtargeting employs consumer data that is widely available for most members of population at relatively low cost, enabling individual‐level predictions rather than population‐wide inferences. We found microtargeting successfully differentiated restoration‐program participants from nonparticipants, suggesting its application to program recruitment could dramatically improve conservation returns on investment. There may be myriad opportunities to apply microtargeting techniques to improve conservation outcomes while reducing cost, although much more research is needed on a variety of fronts.
One area where microtargeting may be particularly helpful is strategic conservation planning in landscapes dominated by private land. In these contexts, the management of valued resources is directly tied to individual landowner decisions. Previous studies have sought coupled social–ecological landscape prioritizations, recognizing that the likelihood of conservation success is a function of biophysical as well as human dimensions and dynamics (Game et al. 2011; Guerrero et al. 2013; Karimi et al. 2017; Nielsen et al. 2017). Adapting microtargeting to this particular challenge presents a novel opportunity to prioritize conservation investments by spatially coupling fine‐grain social and ecological data across large extents. This approach is unique in that it enables a social–ecological landscape prioritization for conservation investments by combining a biophysical resource assessment, an enumeration of private resource ownership, and analysis that identifies landowners with high propensity for restoration‐program participation. Our results showed that even after a large investment in biophysical data development and spatial analysis, microtargeting still offered dramatic improvements to the landscape prioritization through fine‐scale consideration of variation in human likelihood to take conservation action (i.e., Fig. 1). In other words, by using these techniques, riparian‐restoration outreach programs could reduce their outreach budgets by over 50% (i.e., spend less to recruit similar numbers of participants), or more than double the impact of existing programs (i.e., spend the same to recruit more participants). With these savings, budgets could be more efficiently allocated toward achieving conservation outcomes (e.g., revegetation costs), rather than recruiting program participants. Future research should strive for a robust accounting of microtargeting costs, savings, and benefits in different contexts.
Beyond efficiency and efficacy enhancement, microtargeting also enables robust evaluations of intervention success. Conservation social science is in need of more experimental design to objectively evaluate and quantify impact (Ferraro & Pattanayak 2006; Baylis et al. 2016) and learn from intervention successes and failures (Veríssimo et al. 2018). Other social marketing efforts prove difficult to evaluate. For example, how does one know whether mass communication campaigns work or how to determine for whom they did not and evolve subsequent efforts? Microtargeting operates at the individual level, so interventions can be strategically deployed under experimental designs with large sample sizes, affording robust evaluation of successes and failures. Further, research of coupled human and natural systems may benefit from the spatially explicit prediction of individual actor behavior, and resource consequences (e.g., in response to social‐ecological change), afforded by these methods.
More generally, marketing tools offer promise for achieving conservation goals, but have been largely ignored, eschewed, or their efficacy questioned (Veríssimo & McKinley 2017). Exceptions do exist and are growing, such as social marketing for environmental protection (McKenzie‐Mohr et al. 2012). Although these broader applications of marketing are extremely valuable, our methodology allows a finer scale assessment of target audiences providing conservation guidance at the individual level without limiting geographic scope. Microtargeting allows conservation interventions to be customized for each person in a population, thus increasing conservation return on investment. In our case study, microtargeted landowners were over twice as likely to have participated in the restoration program. Alternative nonparametric analysis techniques for likelihood estimation (e.g., neural networks, discriminant analysis, machine learning; Vellido 1999) may offer even higher model accuracies and programmatic returns, but further research is needed.
Still, legitimate questions remain about the value of this approach compared with other methods, whether results here will hold when more rigorously evaluated (i.e., based on direct measures of behavior change), and the ethical bounds of utilizing these types of publically available data. There may be other methods for achieving similar outcomes, but more research is needed. For example, propensity models based solely on biophysical or economic data (e.g., land or real estate value) may yield similar results to consumer data analyses in some settings. If and where these contexts exist, they should be evaluated. In other instances, the cost and expertise required to conduct microtargeting may not be worth the savings produced, although consumer data acquisition is relatively low cost and the statistical techniques for analysis are generally accessible (e.g., logistic regression). Despite low costs, the real outcomes generated by these techniques will require field testing (underway in our study area) that take time, resources, and commitment to accomplish. In an evaluation of an initial riparian restoration outreach campaign, we recently demonstrated our microtargeting algorithm could increase engagement among landowners by over half (66%), however continued testing is needed as owners progress from initial engagement to actual buffer installation (Metcalf et al. 2019). Future research should explore the extent and impact of nonindividual owners on the utility of microtargeting application and ways to circumvent this limitation.
In addition to pragmatic questions about effectiveness, conservationists must not ignore the ethical questions raised by microtargeting techniques. For example, big data are used by industry, political campaigns, and others to understand, predict, and manipulate human behavior, raising concerns about privacy, the appropriate methods for inspiring behavior change, and what behaviors ought to be promoted or discouraged. Should consumer data be publically available in the first place? What types of behavior change interventions are appropriate, if any? What are the costs and benefits of methodological transparency? What segments of the population are excluded from these analyses and thus potentially excluded from conservation outreach? The ethical standards for conservationists are unique from marketers, and best management practices for microtargeting should be articulated and closely followed so as to not undermine trust of the stakeholders with whom conservation requires partnership. Behavioral economists view their interventions as “libertarian paternalism,” arguing the beneficial outcomes, and retention of choice, justify their actions (Sunstein & Thaler 2003). Similarly, conservationists may view their efforts as ‘facilitated altruism’ because they encourage (not require) behaviors that produce public goods or protect common resources, but more debate is needed before ethical clarity is achieved (Veríssimo & McKinley 2016).
Our results demonstrated how one conservation program benefited from a coupled social and biophysical prioritization informed by microtargeting. Similar opportunities may exist in areas where digital and spatially explicit parcel ownership data are available to couple ecological to social data based on joint location information. In other contexts, microtargeting could help predict conservation‐related behaviors of other actors (e.g., recreationists, customers, and voters) or identify people most likely to respond to interventions (Fig. 2). More work is needed to understand what efficiencies can be achieved by using these techniques and whether those gains are worth the investments required to conduct consumer data analysis. However these methods advance, the prospects for microtargeting to improve conservation programs are profound.
Supporting information
Study area map (Appendix S1), 1 m2 resolution land‐cover data set (Appendix S2), consumer data dictionary (Appendix S3), and output of developmental regression model (Appendix S4) are available online. The authors are solely responsible for the content and functionality of these materials. Queries (other than absence of the material) should be directed to the corresponding author.
Acknowledgments
This work was generously supported by the RK Mellon Foundation, the USDA Forest Service, the National Park Service, the Chesapeake Bay Program Partnerships, and the Pennsylvania Department of Conservation and Natural Resources.
Article impact statement: Microtargeting boosts conservation impact by finding willing partners and individualizing behavior‐change interventions.
Literature Cited
- Ajzen I. 2012. Martin Fishbein's legacy: the reasoned action approach. The Annals of the American Academy of Political and Social Science 640:11–27. [DOI] [PMC free article] [PubMed] [Google Scholar]
- Baylis K, Honey‐Rosés J, Börner J, Corbera E, Ezzine‐de‐Blas D, Ferraro PJ, Lapeyre R, Persson UM, Pfaff A, Wunder S. 2016. Mainstreaming impact evaluation in nature conservation. Conservation Letters 9:58–64. [Google Scholar]
- Belote RT, Dietz MS, Jenkins CN, McKinley PS, Irwin GH, Fullman TJ, Leppi JC, Aplet GH. 2017. Wild, connected, and diverse: building a more resilient system of protected areas. Ecological Applications 27:1050–1056. [DOI] [PubMed] [Google Scholar]
- Berry MJ, Linoff GS. 2004. Data mining techniques: for marketing, sales, and customer relationship management. John Wiley & Sons, Inc., Hoboken, New Jersey. [Google Scholar]
- Blaschke T. 2010. Object based image analysis for remote sensing. ISPRS Journal of Photogrammetry and Remote Sensing 65:2–16. [DOI] [PMC free article] [PubMed] [Google Scholar]
- Cinner J. 2018. How behavioral science can help conservation. Science 362:889–890. [DOI] [PubMed] [Google Scholar]
- Eppstein MJ, Grover DK, Marshall JS, Rizzo DM. 2011. An agent‐based model to study market penetration of plug‐in hybrid electric vehicles. Energy Policy 39:3789–3802. [Google Scholar]
- Erevelles S, Fukawa N, Swayne L. 2016. Big data consumer analytics and the transformation of marketing. Journal of Business Research 69:897–904. [Google Scholar]
- Ferraro PJ, Pattanayak SK. 2006. Money for nothing? A call for empirical evaluation of biodiversity conservation investments. PLoS Biology 4 (e105) https://doi.org/0040105. [DOI] [PMC free article] [PubMed] [Google Scholar]
- Game ET, Lipsett‐Moore G, Hamilton R, Peterson N, Kereseka J, Atu W, Watts M, Possingham H. 2011. Informed opportunism for conservation planning in the Solomon Islands. Conservation Letters 4:38–46. [Google Scholar]
- Guerrero AM, McAllister RRJ, Corcoran J, Wilson KA. 2013. Scale mismatches, conservation planning, and the value of social‐network analyses. Conservation Biology 27:35–44. [DOI] [PubMed] [Google Scholar]
- Guerrero AM, Wilson KA. 2017. Using a social–ecological framework to inform the implementation of conservation plans. Conservation Biology 31:290–301. [DOI] [PubMed] [Google Scholar]
- Jaworska J, Sydow M. 2008. Behavioural targeting in on‐line advertising: an empirical study Pages 62–76 in International conference on web information systems engineering. Volume 5175 Springer, Berlin, Germany. [Google Scholar]
- Kamal S, Grodzińska‐Jurczak M, Brown G. 2015. Conservation on private land: a review of global strategies with a proposed classification system. Journal of Environmental Planning and Management 58:576–597. [Google Scholar]
- Karimi A, Tulloch AIT, Brown G, Hockings M. 2017. Understanding the effects of different social data on selecting priority conservation areas. Conservation Biology 31:1439–1449. [DOI] [PubMed] [Google Scholar]
- Kilgore MA, Snyder SA, Block‐Torgerson K, Taff SJ. 2013. Challenges in characterizing a parcelized forest landscape: why metric, scale, threshold, and definitions matter. Landscape and Urban Planning 110:36–47. [Google Scholar]
- Krstolic JL, Chaplin JJ. 2007. Bankfull regional curves for streams in the non‐urban, non‐tidal coastal plain physiographic province, Virginia and Maryland. Scientific investigations report 2007–5162. U.S. Geological Survey, Washington, D.C. [Google Scholar]
- Kwok R. 2018. Ecology's remote‐sensing revolution. Nature 556:137–138. [DOI] [PubMed] [Google Scholar]
- Lowrance R, et al. 1997. Water quality functions of riparian forest buffers in Chesapeake Bay Watersheds. Environmental Management 21:687–712. [DOI] [PubMed] [Google Scholar]
- Maibach E, Roser‐Renouf C, Leiserowitz, A . 2009. Global warming's six Americas 2009. George Mason University, Fairfax, Virginia. [Google Scholar]
- Mascia MB, Brosius JP, Dobson TA, Forbes BC, Horowitz L, McKean MA, Turner NJ. 2003. Conservation and the social sciences. Conservation Biology 17:649–650. [Google Scholar]
- McKenzie‐Mohr D, Lee NR, Schultz PW, Kotler PA. 2012. Social marketing to protect the environment: what works. Sage, Thousand Oaks, California. [Google Scholar]
- Metcalf AL, Angle JW, Phelan CN, Muth BA, Finley JC. 2019. More “bank” for the buck: microtargeting and normative appeals to increase social marketing efficiency. Social Marketing Quarterly 25:26–39. [Google Scholar]
- Metcalf AL, Gruver JB, Finley JC, Luloff AE. 2016. Segmentation to focus outreach: behavioral intentions of private forest landowners in Pennsylvania. Journal of Forestry 114:466–473. [Google Scholar]
- Miyasaka T, Bao Q, Toshiya L. 2017. Agent‐based modeling of complex social–ecological feedback loops to assess multi‐dimensional trade‐offs in dryland ecosystem services. Landscape Ecology 32:707–727. [Google Scholar]
- Murray GR, Scime A. 2010. Microtargeting and electorate segmentation: data mining the American National Election Studies. Journal of Political Marketing 9:143–166. [Google Scholar]
- Naidoo R, Balmford A, Costanza R, Fisher B, Green RE, Lehner B, Malcolm TR, Ricketts TH. 2008. Global mapping of ecosystem services and conservation priorities. Proceedings of the National Academy of Sciences 105:9495–9500. [DOI] [PMC free article] [PubMed] [Google Scholar]
- Natural Resources Conservation Service . 2010. Conservation practice standard: riparian forest buffer 391‐1. U.S. Department of Agriculture, Richmond, Virginia. [Google Scholar]
- Nelson E, Polasky S, Lewis DJ, Plantinga AJ, Lonsdorf E, White D, Bael D, Lawler JJ. 2008. Efficiency of incentives to jointly increase carbon sequestration and species conservation on a landscape. Proceedings of the National Academy of Sciences 105:9471–9476. [DOI] [PMC free article] [PubMed] [Google Scholar]
- Nielsen ASE, Strange N, Bruun HH, Jacobsen JB. 2017. Effects of preference heterogeneity among landowners on spatial conservation prioritization. Conservation Biology 31:675–685. [DOI] [PubMed] [Google Scholar]
- O'Callaghan JF, Mark DM. 1984. The extraction of drainage networks from digital elevation data. Computer Vision, Graphics, and Image Processing 27:323–344. [Google Scholar]
- Pallai C, Wesson K. 2017. Chesapeake Bay Program Partnership high‐resolution land cover classification accuracy assessment methodology. Chesapeake Conservancy, Annapolis, Maryland. [Google Scholar]
- Schultz PW. 2011. Conservation means behavior. Conservation Biology 25:1080–1083. [DOI] [PubMed] [Google Scholar]
- Schultz PW, Nolan JM, Cialdini RB, Goldstein NJ, Griskevicius V. 2018. The constructive, destructive, and reconstructive power of social norms. Psychological Science 18:429–433. [DOI] [PubMed] [Google Scholar]
- Smith JT, Evans JS, Martin BH, Baruch‐Mordo S, Kiesecker JM, Naugle DE. 2016. Reducing cultivation risk for at‐risk species: predicting outcomes of conservation easements for sage‐grouse. Biological Conservation 201:10–19. [Google Scholar]
- Sunstein CR, Reisch LA. 2014. Automatically green: Behavioral economics and environmental protection. Harvard Environmental Law Review 38:127–158. [Google Scholar]
- Sunstein CR, Thaler RH. 2003. Libertarian paternalism is not an oxymoron. The University of Chicago Law Review 70:1159–1202. [Google Scholar]
- Tabi A, Hille SL, Wüstenhagen R. 2014. What makes people seal the green power deal?—Customer segmentation based on choice experiment in Germany. Ecological Economics 107:206–215. [Google Scholar]
- Tarboton DG, Ames DP. 2001. Advances in the mapping of flow networks from digital elevation data. The World Water and Environmental Resources Congress 111:166–175. [Google Scholar]
- Vellido A. 1999. Neural networks in business: a survey of applications (1992–1998). Expert Systems with Applications 17:51–70. [Google Scholar]
- Ver Planck NR, Metcalf AL, Finley AO, Finley JC. 2016. Evaluation of the USDA Forest Service National Woodland Owner Survey estimators for private forest area and landowners: a case study of Montana. Forest Science 62:525–534. [Google Scholar]
- Veríssimo D, McKinley E. 2016. Introducing conservation marketing: Why should the devil have all the best tunes? Oryx 50:14. [Google Scholar]
- Veríssimo D, McKinley E. 2017. Understanding conservation marketing and focusing on the best available evidence: a reply to Hobson. Oryx 51:22. [Google Scholar]
- Veríssimo D, Schmid C, Kimario FF, Eves HE. 2018. Measuring the impact of an entertainment‐education intervention to reduce demand for bushmeat. Animal Conservation 21:324–331. [Google Scholar]
- Wang Y, Chen Q, Kang C, Zhang M, Wang K, Zhao Y. 2015. Load profiling and its application to demand response: a review. Tsinghua Science and Technology 20:117–129. [Google Scholar]
- Zipp KY, Lewis DJ, Provencher B. 2017. Does the conservation of land reduce development? An econometric‐based landscape simulation with land market feedbacks. Journal of Environmental Economics and Management 81:19–37. [Google Scholar]
Associated Data
This section collects any data citations, data availability statements, or supplementary materials included in this article.
Supplementary Materials
Study area map (Appendix S1), 1 m2 resolution land‐cover data set (Appendix S2), consumer data dictionary (Appendix S3), and output of developmental regression model (Appendix S4) are available online. The authors are solely responsible for the content and functionality of these materials. Queries (other than absence of the material) should be directed to the corresponding author.