Abstract
Previously, we reported that although the HSPC frequency in bone marrow cells (BMC) was comparable between β2−/− and β2+/+ mice, transplantation of β2−/− BMC into lethally irradiated CD45.1 recipient resulted in more myeloid cell production than β2+/+ BMC. The objective of this study is to address if integrin β2 deficiency skews granulocyte/macrophage progenitor (GMP) proliferation. FACS analysis demonstrated that GMP frequency and cell number were higher and megakaryocyte/erythrocyte progenitor frequency and cell number were lower in β2−/− mice than β2+/+ mice. However, the common myeloid progenitors (CMP) frequency and cell number were similar between the two groups. The increased GMP number was due to GMP proliferation as evidenced by the percentage of BrdU‐incorporating GMP. Whole genome transcriptome analysis identified increased FcεRIα expression in β2−/− CMP compared to β2+/+ CMP. FcεRIα expression on β2−/− GMP was detected increased in β2−/− mice by qRT‐PCR and FACS. Although transplantation of FcεRIαhi GMP or FcεRIαlo GMP into lethally irradiated CD45.1 recipient resulted in comparable myeloid cell production, transplantation of β2 deficient FcεRIαhi GMP generated more myeloid cells than β2+/+ FcεRIαhi GMP. GATA2 expression was increased in β2−/− GMP. Using a luciferase reporter assay, we demonstrated that mutation of the GATA2 binding site in the FcεRIα promoter region diminished FcεRIα transcription. In vitro, the addition of IgE, the ligand of FcεRIα, promoted GMP expansion, which was abrogated by inhibition of JNK phosphorylation. Integrin β2 deficiency promoted GMP proliferation and myeloid cell production, which was mediated via FcεRIα/IgE‐induced JNK phosphorylation in GMP. Stem Cells 2019;37:430–440
Keywords: FcεRIα, GATA2, Granulocyte/macrophage progenitors, Integrin β2, Proliferation
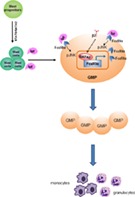
Integrin β2 governs granulocyte/macrophage progenitor (GMP) proliferation under control. β2 deficiency upregulates GATA2/FcεRIα expression in GMP. Binding of IgE to FcεRIα stimulates GMP proliferation which is abrogated by the inhibition of JNK phosphorylation. Ultimately, GMP become constitutively activated for proliferation, leading to myelocytosis.
Significance Statement.
Hematopoietic stem cells activation and sustained granulocyte/macrophage progenitor (GMP) proliferation both contribute to myeloid lineage production. This study demonstrated a novel function for the GATA2/FceRIa/pJNK axis in GMP proliferation. In the absence of integrin ß2, GATA2 expression was increased which could transcriptionally activate its target gene, FceRIa. Binding IgE to FceRIa induced JNK phosphorylation leading to GMP expansion. Ultimately, GMP become constitutively activated for proliferation, leading to myelocytosis.
Introduction
Hematopoietic stem cells (HSC) are the only cell source that generates all types of blood cells in one's life. On the way to blood cell production, HSC will differentiate into common lymphoid progenitors and common myeloid progenitors (CMP). CMP further give rise to megakaryocyte/erythrocyte (MEP) and granulocyte/macrophage progenitors (GMP) 1. Each of these steps is tightly controlled to generate the appropriate number of terminally differentiated cells that could carry out physical function for immune defense, oxygen transportation, and coagulation.
Myeloid progenitors express a series of adhesion receptors including CD44, integrin β1, and CD41 which enable them to adhere to bone marrow (BM) stromal cells 2, 3. Interestingly, blocking of CD44 using anti‐CD44 antibody not only reduced hematopoietic cell adhesion to hyaluronate but also abrogated myelopoiesis, indicating the regulatory role of adhesion receptors in hematopoietic progenitor cell proliferation and/or differentiation 2. In line with these findings, we previously identified integrin β2 expression in hematopoietic stem/progenitor cells (HSPCs) which regulated cell adhesion and migration toward intracellular adhesion molecule‐1. Although the HSPC frequency in BM cells (BMC) was comparable in integrin‐β2 knockout (β2−/−) mice compared with wild‐type mice, transplantation of integrin β2−/− BMC into lethally irradiated CD45.1 recipient resulted in greater white blood cell production compared with transplantation of integrin β2+/+ BMC 4. In unpublished data, we found that the GMP frequency in total BMCs was higher in integrin β2−/− mice than their β2+/+ littermate controls. We thus postulated that integrin β2 deficiency could skew myeloid progenitor proliferation, aside from affecting cell adhesion in BM niche.
To test the hypothesis, we performed genome wide transcriptome studies using microarrays on FACS‐sorted CMPs isolated from integrin β2−/− and integrin β2+/+ mice. We identified that the expression of the Fc epsilon receptor I (FcεRIα), a high affinity receptor for IgE, was increased in β2−/− GMP compared with β2+/+ GMPs. Here, we also describe how the FcεRIα/IgE axis regulated GMP proliferation.
Materials and Methods
Wild‐type C57BL/6J (CD45.2, H‐2 kb) mice, B.6SJL‐PTPRCA (CD45.1), and integrin β2−/− with C57BL/6J background were used at the age of 8–12 weeks. To assess the impact of β2 deficiency on myeloid lineage production, competitive BM transplantation was performed using total BMC, CMP, FcεRIαhi GMP, or FcεRIαlo GMP isolated from β2+/+ and β2−/− mice. Microarray analysis was carried out in β2+/+ and β2−/− CMP. Detailed methods are shown in Supporting Information data.
Results
Integrin β2 Deficiency Associated with GMP Proliferation
We previously reported leukocytosis in integrin β2−/− mice 4. Consistent with the previous study 4, the numbers of granulocytes, monocytes, and lymphocytes were all dramatically increased in the PB of β2−/− mice (Fig. 1A–1C). The absolute number of granulocytes was 2.6‐fold higher in BM of β2−/− mice compared with β2+/+ mice (7.6 ± 1.4 × 10⁶ per mouse vs. 20.0 ± 1.7 × 10⁶ per mouse, p = .0002, n = 6 for each group) (Fig. 1D). Although monocyte number in BM was 28% lower in β2−/− mice than β2+/+ mice, it did not reach statistical significance (12.7 ± 1.9 × 10⁶ per mouse vs. 9.2 ± 4.2 × 10⁶ per mouse, p = .54, n = 6–9 for each group) (Fig. 1D). Although the numbers of HSPCs and CMP did not differ between two groups, GMP frequency and number were higher while MEP frequency and number were lower in β2−/− mice than β2+/+ mice (Fig. 1E). Representative Fluorescence activated cell sorting (FACS) analysis of CMP, GMP and MEP are shown in Supporting Information Figure S1.
Figure 1.
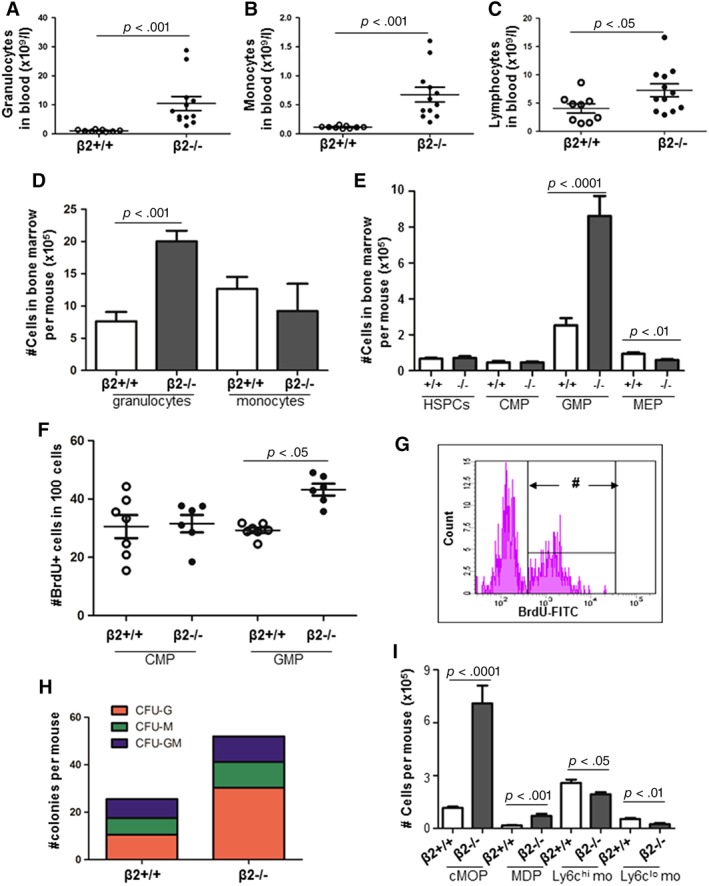
GMP proliferation in integrin β2−/− mice. The absolute number of granulocyte (A), monocyte count (B), and lymphocyte (C) in the PB of integrin β2−/− and wild‐type mice. n = 9–12. (D): Bone marrow cells (BMC) were stained with anti‐CD11b and anti‐Gr‐1. The numbers of GR‐1+ granulocytes and CD11b+ monocytes were shown. n = 7 for each group. (E): BMC were stained with lineage cocktail, anti‐Sca‐1, anti‐cKit, anti‐CD16/32, and anti‐CD34. The numbers of HSPCs, CMP, GMP, and MEP in BMC were obtained. n = 11–13. (F): BMCs were permeabilized and stained with surface markers together with BrdU‐FITC. BrdU‐incorporating CMP and GMP were analyzed by FACS. The percentage of BrdU‐incorporating CMP or GMP within CMP or GMP population was shown. n = 6–7. (G): Representative BrdU+ cells when gated on lineage‐/lowSca‐1−cKit+CD34+CD16/32+ cells, that is, GMP. # denoted BrdU+ cells. (H): Colony‐forming unit assay using 1 × 10⁴ BMC of β2+/+ and β2−/− mice. Ten days after plating, myeloid colonies were counted under light microscope. n = 8–9. (I): BMC were stained with anti‐lineage, anti‐cKit, anti‐CD135, anti‐CD115, anti‐Ly6C, and anti‐CD11b. GMP subpopulations were analyzed by FACS. cMoP: CD117+CD115+CD135+Ly6C+CD11b−lineage−/low; MDP: CD117+CD115+CD135+Ly6C−CD11b−lineage−/low; Ly6Chi monocytes: CD117−CD115+CD135−Ly6Chilineage−/low; and Ly6Clo monocytes: CD117−CD115+CD135−Ly6Clolineage−/low. n = 8 for each group. Abbreviations: BrdU, 5‐bromo‐2‐deoxyuridine; cMoP, common monocyte progenitors; CMP, common myeloid progenitors; FACS, Fluorescence Activated Cell Sorting; FITC, Fluorescein isothiocyanate; GMP, granulocyte/macrophage progenitor; HSPCs, hematopoietic stem/progenitor cells; MDP, monocyte–macrophage DC progenitors; MEP, megakaryocyte/erythrocyte progenitor; PB, peripheral blood.
To dissect whether increased GMP number in BMC was due to enhanced proliferation, BrdU was injected intraperitoneally into mice. FACS analysis illustrated that the percentage of BrdU+ CMP among CMP was similar between the two groups (30.5% ± 10.5% vs. 31.5% ± 7.4%, p = .85). By contrast, BrdU‐incorporating GMP was 26.4% among β2+/+ GMP but increased to 43.2% in β2−/− GMP (p = .022), indicating enhanced GMP proliferation in β2−/− mice (Fig. 1F, 1G).
As GMP are heterogenous fractions, CFU assay was performed to define GMP subfractions. After 10 days of methylcellulose culture, the number of CFU‐G, CFU‐M, and CFU‐GM were all higher in β2−/− mice compared with β2+/+ controls (CFU‐G: 10.5 ± 3.6 vs. 30.3 ± 17.4 per mouse, p = .004; CFU‐M: 7.0 ± 1.8 vs. 10.9 ± 4.5 per mouse, p = .029; CFU‐GM: 8.0 ± 2.1 vs. 10.8 ± 1.5 per mouse, p = .006) (Fig. 1H).
Consistently, when BMC were stained with anti‐lineage, anti‐CD117, anti‐CD115, anti‐CD135, anti‐Ly6c, and anti‐CD11b as described before 5, the percentages of monocyte–macrophage DC progenitors (MDP) and common monocyte progenitors (cMoP) were 5.9‐ and 4.3‐fold greater in β2−/− mice than controls (%MDP: 0.02% ± 0.003% vs. 0.10% ± 0.02%, p = .0002; %cMoP: 0.17% ± 0.01% vs. 0.99% ± 0.14%, p < .0001; n = 8 for each group). Likewise, the absolute numbers of MDP and cMoP were 6.1‐ and 4.2‐fold higher in β2−/− mice than wide type controls (#MDP: 16,123 ± 2,158 per mouse vs. 71,062 ± 10,914 per mouse, p = .0002; #cMoP: 115,741 ± 6,704 per mouse vs. 709,327 ± 101,200 per mouse, p < .0001; n = 8 for each group) (Fig. 1I) (Supporting Information Fig. S3). Nevertheless, the percentages and absolute numbers of Ly6chi monocytes and Ly6clo monocytes were lower in β2−/− mice than controls (%Ly6chi monocytes: 0.37% ± 0.03% vs. 0.27% ± 0.02%, p = .007; %Ly6clo monocytes: 0.08% ± 0.01% vs. 0.03% ± 0.01%, p = .003; #Ly6chi monocytes: 257,377 ± 19,161 per mouse vs. 193,233 ± 11,961 per mouse, p = .013; #Ly6clo monocytes: 51,932 ± 5,854 per mouse vs. 23,997 ± 5,629 per mouse, p = .004; n = 8 for each group) (Fig. 1I) (Supporting Information Fig. S4).
Cytokine Expression Profiles of β2+/+ and β2−/− Mice
IL‐3, IL‐6, Granulocyte‐Macrophage Colony Stimulating Factor (GM‐CSF), tumor necrosis factor‐α (TNF‐α), and S100A8/A9 have been shown to promote myeloid lineage production 6, 7, 8, 9, 10, 11, 12. Quantified by ELISA, neither IL‐3 nor IL‐6 differed in PB and BM fluid of β2+/+ and β2−/− mice (p > .15 for all). Although PB S100A8 levels were higher in β2−/−mice, S100A9, TNF‐α, and GM‐CSF levels in the PB were similar in β2+/+ and β2−/−mice (Fig. 2A–2D). When normalized by total amount of protein, the levels of S100A8, S100A9, TNF‐α, and GM‐CSF in BM fluid were 1.1‐, 1.3‐, 1.4‐, and 1.3‐fold higher in β2−/− mice compared with β2+/+ mice (Fig. 2E–2H). It has previously been reported that binding of S100A8/S100A9 to RAGE elicited GMP proliferation 13. When BMC were stained with antibodies against RAGE and GMP surface markers, the percentage of RAGE+ GMP did not differ between β2+/+ and β2−/− mice (6.14% ± 1.04% vs.4.46% ± 1.1.9%, p = .16).
Figure 2.
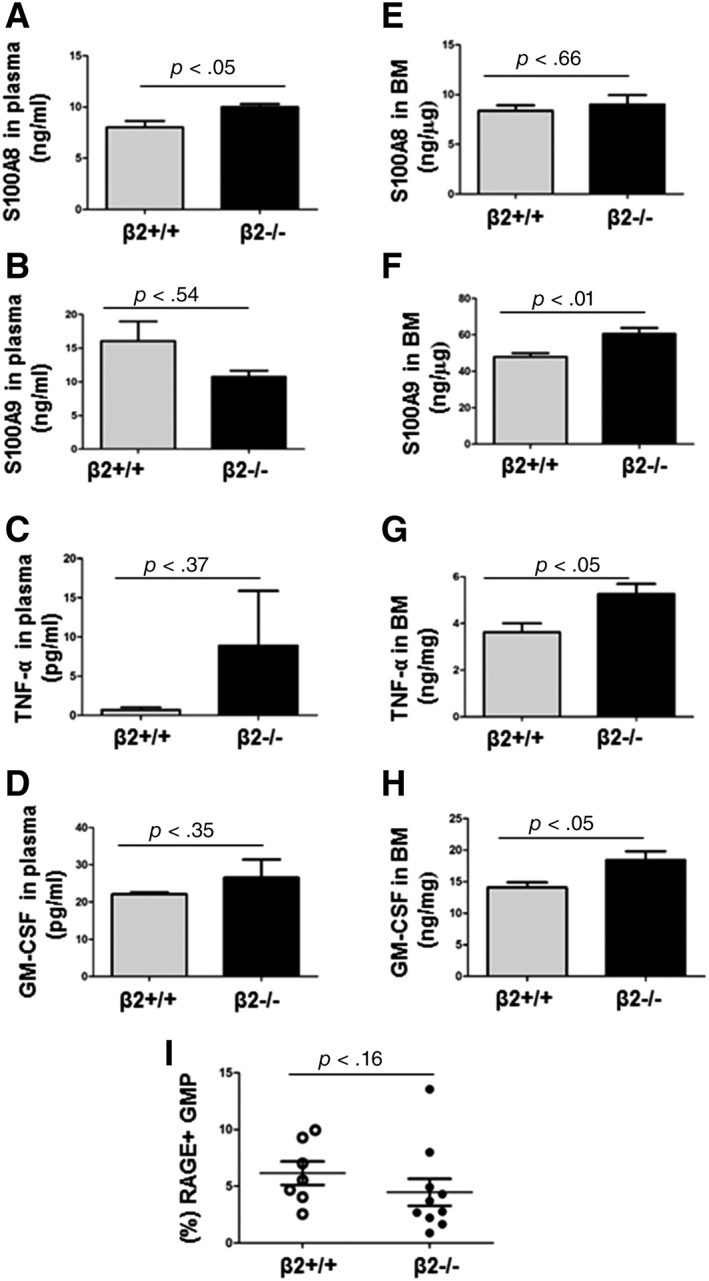
Cytokine expression profiles in β2+/+ and β2−/− mice. (A–D): The levels of S100A8, S100A9, TNF‐α, and GM‐CSF in plasma. n = 4–16. (E–H): The levels of S100A8, S100A9, TNF‐α, and GM‐CSF in BM fluid after being normalized by amount of proteins. n = 7–14. (I): Bone marrow cells were stained with antibody against RAGE together with surface markers of GMP. The percentage of RAGE positive GMP cells was analyzed by FACS. n = 7–10. Abbreviations: BM, bone marrow; CSF, colony stimulating factor; FACS, Fluorescence Activated Cell Sorting; GM, granulocyte‐macrophagea; GMP, granulocyte/macrophage progenitor; RAGE, receptor for advanced glycation endproducts; TNF‐α, tumor necrosis factor‐α.
β2 Deficiency Enhanced Myeloid Lineage Production
Next, we characterized the impact of β2 deficiency on myeloid lineage reconstitution. Equal amounts of integrin β2+/+ BMC or integrin β2−/− BMC were mixed with the same amount of CD45.1 BMC and injected into lethally irradiated CD45.1 recipient. By chimerism analysis, transplantation of integrin β2−/− BMC resulted in greater CD8+ T cells, B220+ B cells, and CD11b+ myeloid cell production after 16 weeks of transplantation (Fig. 3A).
Figure 3.
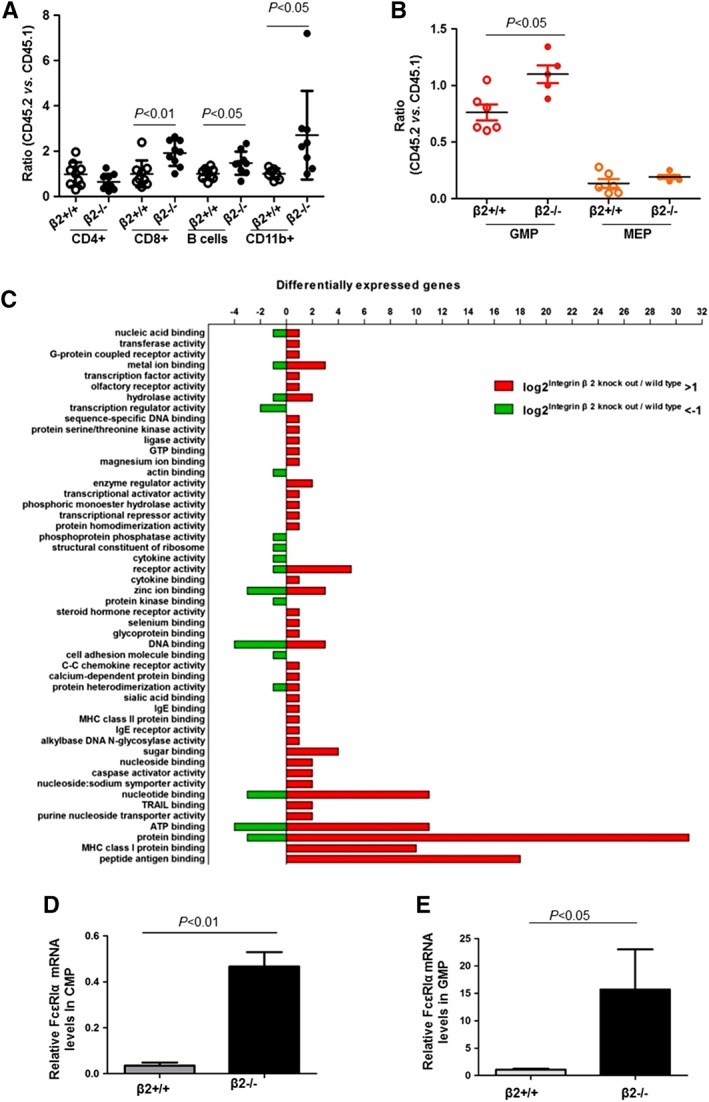
Microarray analysis. (A): Equal amount of integrin β2+/+ bone marrow cells (BMC) or integrin β2−/− BMC was mixed with 1 × 10⁶ CD45.1 BMC and then injected into lethally irradiated CD45.1 recipient. Sixteen weeks after transplantation, blood cells were stained with anti‐CD45.1, anti‐CD45.2, and anti‐CD11b for myeloid lineage production. Likewise, blood cells were stained with anti‐CD45.1, anti‐CD45.2 and anti‐CD4, anti‐CD8 and anti‐B220 for chimerism analysis of lymphoid lineage production by FACS. n = 7–9. (B): β2+/+ and β2−/− CMP were sorted out by FACS and competitive transplantation was performed by injecting 1,000 CMP and 1 × 10⁵ CD45.1 BMC to irradiated CD45.2 recipient. Twelve days after injection, recipient's BMC were stained with anti‐CD45.1, anti‐CD45.2, and GMP markers for chimerism analysis. n = 5–6. (C): CMP were sorted out by FACS and proceeded for microarray analysis. Pathways enriched in β2−/− CMP as compared with β2+/+ CMP were listed by KEGG pathway analysis. n = 3 for each. qRT‐PCR analysis of FcεRIα in CMP (D) and GMP (E). Gene expression was normalized to β‐actin. n = 3–4. Abbreviations: CMP, common myeloid progenitors; FACS, fluorescence activated cell sorting; GMP, granulocyte/macrophage progenitor; MEP, megakaryocyte/erythrocyte progenitor.
To compare the in vivo differentiation potential, β2+/+ and β2−/− CMP were isolated by FACS sorting and injected into irradiated CD45.2 recipients. Chimerism analysis of the recipient BMC indicated that β2−/− CMP gave rise to significantly more GMP than β2+/+ CMP although MEP production was similar between two groups (ratio of CD45.2/CD45.1 for GMP production: 0.76 ± 0.07 vs. 1.10 ± 0.08, p = .011; ratio of CD45.2/CD45.1 for MEP production: 0.13 ± 0.04 vs. 0.19 ± 0.02, p = .24; n = 5–6) (Fig. 3B).
Increased FcεRIα Expression in GMP By Microarray Analysis
To further dissect the mechanism underlying the increased GMP proliferation in β2−/− mice, CMP were sorted by FACS and whole genome transcriptome profiles were obtained by microarray analysis. Differentially expressed genes were filtered out by gene‐set analysis. Pathways enriched in β2−/− CMP as compared with β2+/+ CMP were assessed by KEGG pathway analysis (Fig. 3C). By qPCR, the different expression levels of FcεRIα were confirmed in CMP as well as GMP (Fig. 3D and 3E).
We then validated FcεRIα protein expression on CMP and GMP by FACS. Although FcεRIα expression at the mRNA differed between β2−/− CMP and β2+/+ CMP, the FcεRIαhi CMP subpopulation in total BMC was very small and did not differ between the groups (Fig. 4A) (FcεRIαhi CMP%: 0.012% ± 0.001% vs. 0.014% ± 0.001%; p = .35; #FcεRIαhi CMP: 8,582.0 ± 760.9 cells per mouse vs. 9,223 ± 792.9 cells per mouse, p = .56; n = 12–13). By contrast, FcεRIαhi GMP frequency and absolute number were 3.1‐ and 3.2‐fold increase in β2−/− mice compared with wide type controls (FcεRIαhi GMP%: 0.04% ± 0.01% vs. 0.11% ± 0.02%, p < .0001; #FcεRIαhi GMP: 2.5 × 10⁴ ± 0.5 × 10⁴ per mouse vs. 8.1 × 10⁴ ± 1.1 × 10⁴ per mouse, p < .0001; n = 12–13) (Fig. 4A). Measurement of mean fluorescent intensity (MFI) further confirmed FcεRIα expression levels in CMP and GMP of β2+/+ and β2−/− mice (MFI for CMP: 134.0 ± 9.7 vs. 162.1 ± 20.1, p = .23; MFI for GMP: 248.7 ± 16.0 vs. 330.6 ± 20.2, p = .008).
Figure 4.
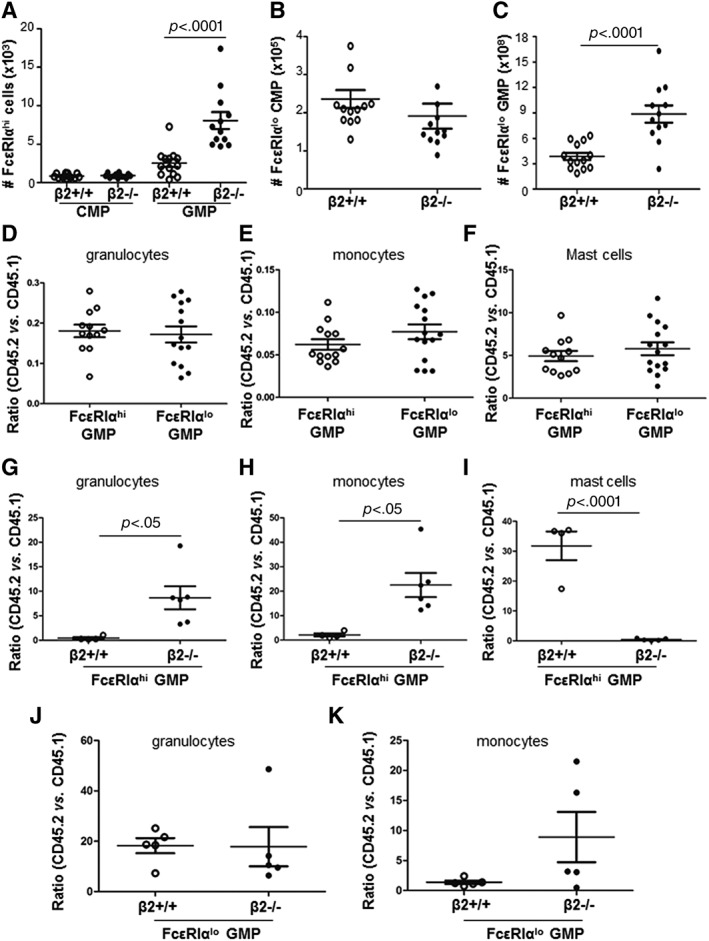
Characterization of FcεRIαhi GMP in myeloid production. (A): The absolute numbers of FcεRIαhi CMP and FcεRIαhi GMP in β2+/+ and β2−/− mice. n = 12–13. (B, C): The absolute numbers of FcεRIαlo CMP and FcεRIαlo GMP in β2+/+ and β2−/− mice. n = 12–13. (D–F): Equal amount of FcεRIαhi GMP or FcεRIαlo GMP were mixed with 1 × 10⁵ CD45.1 bone marrow cells (BMC) and then transplanted to lethally irradiated CD45.2 recipients. Twelve days after transplantation, blood cells were stained with anti‐CD.1, anti‐CD45.2, anti‐CD11b, and anti‐Gr‐1 for chimerism analysis by FACS. n = 12–15. (G‐I): Equal amount of FcεRIαhi GMP from β2+/+ and β2−/− mice were mixed with 1 × 10⁵ CD45.1 BMC and then transplanted to lethally irradiated CD45.2 recipients. Chimerism analysis was performed at 12 days after transplantation. n = 4–5. (J, K): Equal amount of FcεRIαlo GMP from β2+/+ and β2−/− mice were mixed with 1 × 10⁵ CD45.1 BMC and then transplanted to lethally irradiated CD45.2 recipients for chimerism analysis. n = 5 for each group. Abbreviations: CMP, common myeloid progenitors; FACS, fluorescence activated cell sorting; GMP, granulocyte/macrophage progenitor.
The frequency and absolute number of FcεRIαlo CMP was similar between the two groups (FcεRIαlo CMP%: 0.3% ± 0.1% vs. 0.3% ± 0.2%, p = .37; #FcεRIαlo CMP: 2.2 ± 0.2 × 10⁵ per mouse vs. 1.9 ± 0.3 × 10⁵ per mouse, p = .44, n = 12–13) (Fig. 4B). However, the frequency and absolute numbers of FcεRIαlo GMP were 1.9‐ and 2.3‐fold increase in β2−/− mice compared with wide type controls (FcεRIαlo GMP%: 1.2% ± 0.3% vs. 2.4% ± 0.4%, p < .0001; #FcεRIαlo GMP: 3.9 ± 0.4 × 10⁸ per mouse vs. 8.6 ± 1.0 × 10⁸ per mouse, p < .0001, n = 12–13) (Fig. 4C). Thus, there was a discrepancy between mRNA identified by microarray analysis and protein levels defined by FACS. This could be partially explained by the contamination of CMP with GMP during FACS sorting, or different timing of mRNA and protein production during CMP differentiating into GMP. FACS analysis of FcεRIα expression on CMP and GMP of β2+/+ and β2−/− mice is shown in Supporting Information Figure S2.
In Vivo Differentiation Potential of FcεRIα‐Expressing GMP
Because FcεRIα‐expressing GMP were also defined as mast progenitors 14, 15, we examined histamine levels in both mice. The levels of histamine in plasma and BM fluid were also increased in β2−/− mice when compared to their littermate controls (in PB: 84.2 ± 4.79 ng/ml vs. 95.3 ± 2.68 ng/ml, p = .039, n = 15–20; in BM: 0.99 ± 0.19 ng/mg vs. 2.28 ± 0.28 ng/mg, p = .003, n = 9–14). By FACS analysis, CD45+Fcer1a+cKit+ mast cell frequency in PB and BMC were comparable between two groups (PB: 0.22% ± 0.03% vs. 0.17% ± 0.04%, p = .36; BMC: 0.22% ± 0.03% vs. 0.32% ± 0.03%, p = .10; n = 7 for each group). Nevertheless, mast cell number was increased in PB and BM of β2−/− mice compared with wide type controls (PB: 1.2 ± 0.2 × 10⁷/l vs. 3.2 ± 0.8 × 10⁷/l, p = .03; BM: 1.5 ± 0.2 × 10⁵ per mouse vs. 2.3 ± 0.2 × 10⁵ per mouse, p = .08; n = 7 for each group). Thus, the elevated mast cells contributed to the increased histamine levels in β2−/− mice.
When we performed competitive BM transplantation using FcεRIαhi GMP and FcεRIαlo GMP, both types of GMP yielded comparable production of granulocytes, monocytes, and cKit+FcεRIα+CD45 + mast cells (Fig. 4D–4F). But when FcεRIαhi GMP isolated from β2+/+ and β2−/− mice were transplanted into irradiated recipients, β2 deficient FcεRIαhi GMP generated more granulocytes and monocytes but reduced mast cells than β2+/+FcεRIαhi GMP (Fig. 4G–4I). However, transplantation of β2+/+FcεRIαlo GMP and β2−/−FcεRIαlo GMP resulted in similar granulocyte and monocyte production (Fig. 4J, 4K). Mast cell production was too low to be quantified by FACS in the recipients received with either β2+/+ FcεRIαlo GMP or β2−/−FcεRIαlo GMP (data not shown).
Collectively, these data suggest that FcεRIαhi GMP and FcεRIαlo GMP have similar capacity in granulocyte and monocyte production. In the absence of β2, both FcεRIαhi GMP and FcεRIαlo GMP were increased. And β2 deficient FcεRIαhi GMP could differentiate into more granulocytes and monocytes compared with β2+/+ FcεRIαhi GMP.
FcεRIα/IgE‐Induced GMP Proliferation via JNK Phosphorylation
IgE is a well‐known high affinity ligand of FcεRIα. By ELISA, we found that the levels of IgE in plasma and BM fluid were elevated in β2−/− mice (Fig. 5A, 5B). When lineage−/low or sorted GMP cells were allowed to differentiate in the presence or absence of IgE for 5 days in vitro, GMP number was increased by the addition of IgE (Fig. 5C, 5D). To dissect whether IgE acts through FcεRIα in GMP proliferation, FcεRIαhi lineage−/low, and FcεRIαlo lineage−/low cells were sorted out by FACS and cultivated with or without 100 ng/ml IgE for 5 days. FACS analysis confirmed that IgE increased GMP number more dramatically in FcεRIαhi lineage−/low than in FcεRIαlo lineage−/low cells (Fig. 5E).
Figure 5.
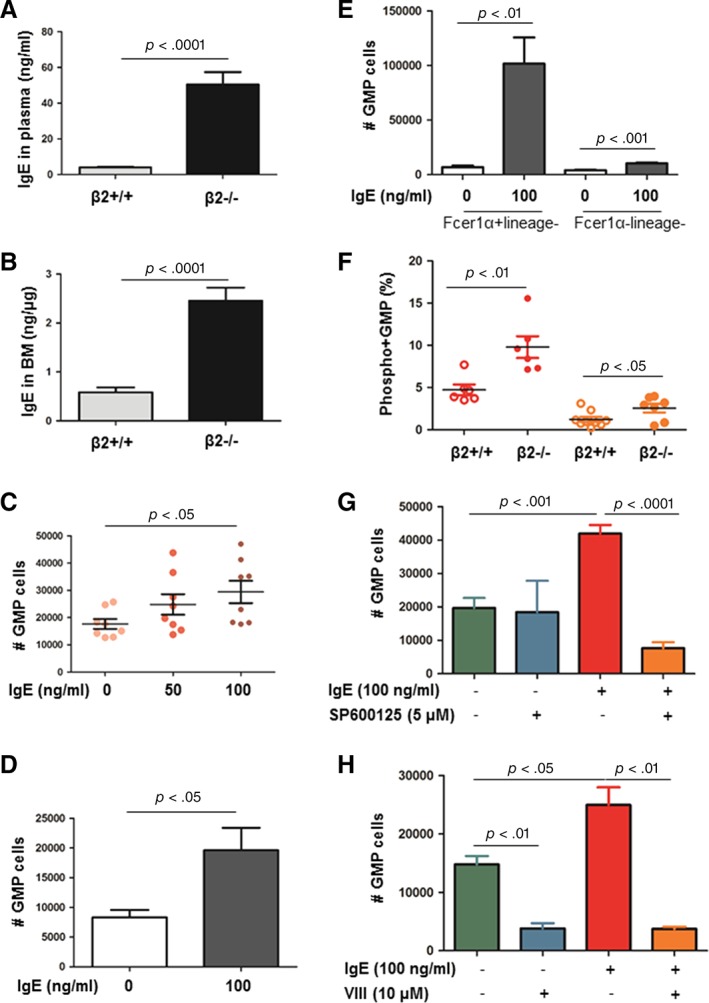
FcεRIα/IgE‐induced GMP proliferation via JNK phosphorylation. (A, B): The levels of IgE in plasma and bone marrow detected by ELISA. n = 9–14. (C–E): Lineage−/low cells (C), FACS‐sorted GMP (D), and FACS‐sorted FcεRIαhilineage− cells and FcεRIα−lineage− cells (E) were cultivated in vitro in the presence of IgE (0–100 ng/ml) for 5 days. Cells were harvested, numerated, and stained with GMP surface markers for FACS analysis. GMP number was computed by GMP proportion multiplied by cell number. n = 4–8. (F): Freshly isolated β2+/+ and β2−/− bone marrow cells were permeabilized and stained with anti‐phosphoAkt (or phosphor‐JNK) together with surface markers for GMP. pAkt+ GMP and pJNK+ GMP were quantified by FACS. n = 6–8. (G, H): Lineage−/low cells were cultivated with IgE in the presence or absence of pAkt inhibitor VIII (10 μM) or pJNK inhibitor SP600125 (5 μM). GMP number after cultivation was assessed as described above. n = 4–5. Abbreviations: BM, bone marrow; FACS, fluorescence activated cell sorting; GMP, granulocyte/macrophage progenitor.
To investigate how IgE/FcεRIα induced GMP proliferation, fresh BMC of β2+/+ and β2−/− mice were permeabilized and stained with GMP markers together with antibody against phospho‐ERK, phospho‐Akt, or phosphor‐JNK. FACS analysis did not reveal any difference in the percentage of pERK+ GMP between β2+/+ and β2−/− GMP cells (1.77% ± 0.43% vs. 2.91% ± 0.62%, p = .14). However, the percentages of pAkt+ GMP and pJNK+ GMP were both 2.1‐fold higher in β2−/− GMP compared with β2+/+ GMP (Fig. 5F).
To further testify whether Akt or JNK phosphorylation was required for IgE‐induced GMP proliferation, lineage−/low cells were stimulated with 100 ng/ml IgE in the presence or absence of Akt inhibitor VIII or JNK inhibitor SP600125 for 5 days. Inhibition of pJNK significantly abrogated the elevated GMP number induced by IgE without affecting GMP levels at basal condition. Nevertheless, inhibition of Akt phosphorylation reduced GMP number at both basal and IgE condition (Fig. 5G, 5H). Put together, these data hint that the elevation of GMP proliferation induced by IgE is mediated via phospho‐JNK.
Regulation of FcεRIα Expression By GATA2
Previous data have shown that GATA1 and GATA2 are required for regulating FcεRIα mRNA and protein expression in mast cells 16. We then tested if FcεRIα expression in GMP was also regulated by GATA2. β2+/+ and β2−/− GMP were sorted by FACS. qPCR data demonstrated that GATA2 was more highly expressed while GATA1 was less expressed in β2−/− GMP compared with β2+/+ GMP (Fig. 6A, 6B). When protein lysates of CMP or GMP were subjected for capillary western blot, GATA1 expression was reduced in both β2−/− CMP and β2−/− GMP compared with their correspondent controls (Fig. 6C, 6D). GATA2 expression was increased in β2−/− GMP but not in β2−/ CMP when compared with their correspondent controls (Fig. 6E).
Figure 6.
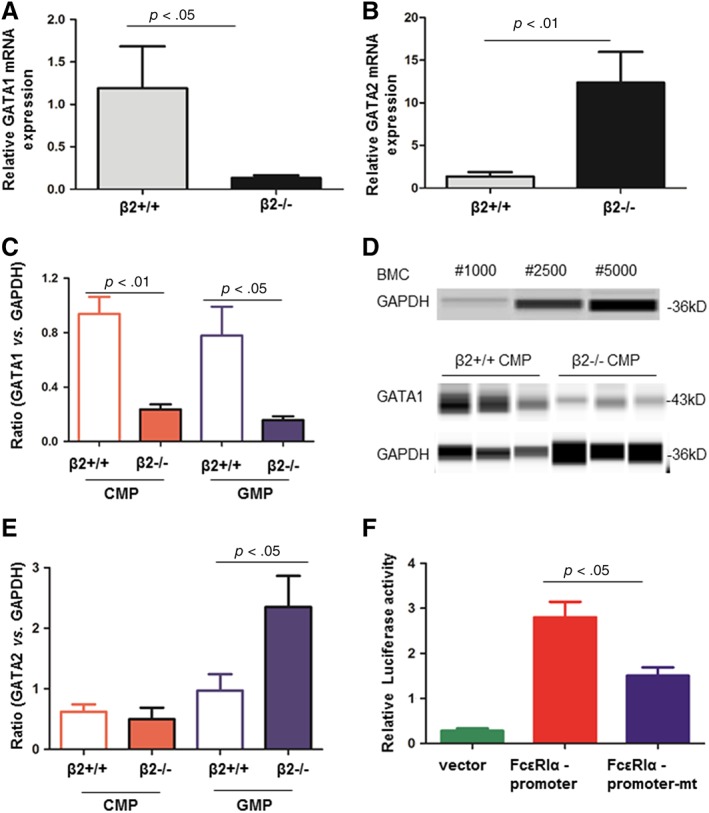
Transcriptional regulation of FcεRIα by GATA2. GMP were sorted out by FACS. After extracting RNA, qRT‐PCR analysis the change of GATA1 (A, n = 3–5) and GATA2 (B, n = 6–9) in GMP cells. Gene expression was normalized to β‐actin. (C–E): β2+/+ and β2−/− CMP and GMP were isolated by FACS sorting. They were lysed for protein extraction. After protein concentration determination, equal amount of proteins was separated by capillary western blot. GATA1, GATA2, and GAPDH expression were studied. Each sample was pooled from 2 to 4 mice. n = 3–6. (F): Dual luciferase reporter gene assay to analysis that whether GATA2 could be combined with FcεRIα. For FcεRIα promoter‐mutant (mt) plasmid, the binding sequence of GATA2 on FcεRIα promoter region was mutated. Firefly luciferase activity was normalized to Renilla luciferase activity. n = 4. Abbreviations: BMC, bone marrow cells; CMP, common myeloid progenitors; FACS, fluorescence activated cell sorting; GMP, granulocyte/macrophage progenitor.
To elucidate the transcriptional regulation of GATA2, HEK293 cells were co‐transfected with a plasmid containing GATA2 cDNA and plasmid containing the FcεRIα promoter with luciferase as a reporter. Quantified by luciferase assay, FcεRIα promoter activity was increased. By contrast, when the binding sequences of GATA2 in the FcεRIα promoter region were mutated, transcription activity was dramatically decreased, suggesting direct regulation of GATA2 on FcεRIα (Fig. 6F).
Discussion
Maintenance of the blood system is a tightly controlled process which involves differentiation from HSC to progenitors and from progenitors to terminal differentiated blood cells 17. In response to infection, HSC become activated to generate immune cells and myeloid cells to enhance the immune defense in the body. Once the acute infection is resolved, HSC returns to a quiescent status to retain stemness 18. However, prolonged myelocytosis can be caused by sustained GMP proliferation even if HSC are quiescent 19, 20. Compared with the vast number of studies exploring the regulation of HSC and HSPC biology, our knowledge of how myeloid progenitors are activated and differentiated is limited.
Integrin β2 mediates cell adhesion to endothelial cells and stromal cells. Intriguingly, we demonstrated previously that β2 deficient mice display increased GMP frequency and myelocytosis. Therefore, we initiated this study to examine the role of integrin β2 in GMP proliferation. The key findings are summarized as follow: (a) β2 deficiency increased GMP proliferation, leading to myeloid cell expansion; (b) β2 deficiency enhanced GATA2 expression which could transcriptionally activate FcεRIα expression. Binding of IgE to its receptor, FcεRIα, potently induced GMP proliferation which was mediated via JNK phosphorylation; (c) transplantation of FcεRIαhi and FcεRIαlo GMP resulted in comparable granulocyte and monocyte production; and (d) β2 deficient FcεRIαhi GMP had greater capacity in giving rise to granulocytes and monocytes compared with wide type FcεRIαhi GMP. Thus, GMP proliferation is delicately regulated by integrins on cell membrane and cytokines from the microenvironment 21, 22. Our proposed model demonstrating how β2 deficiency promoted GMP proliferation is presented in Figure 7.
Figure 7.
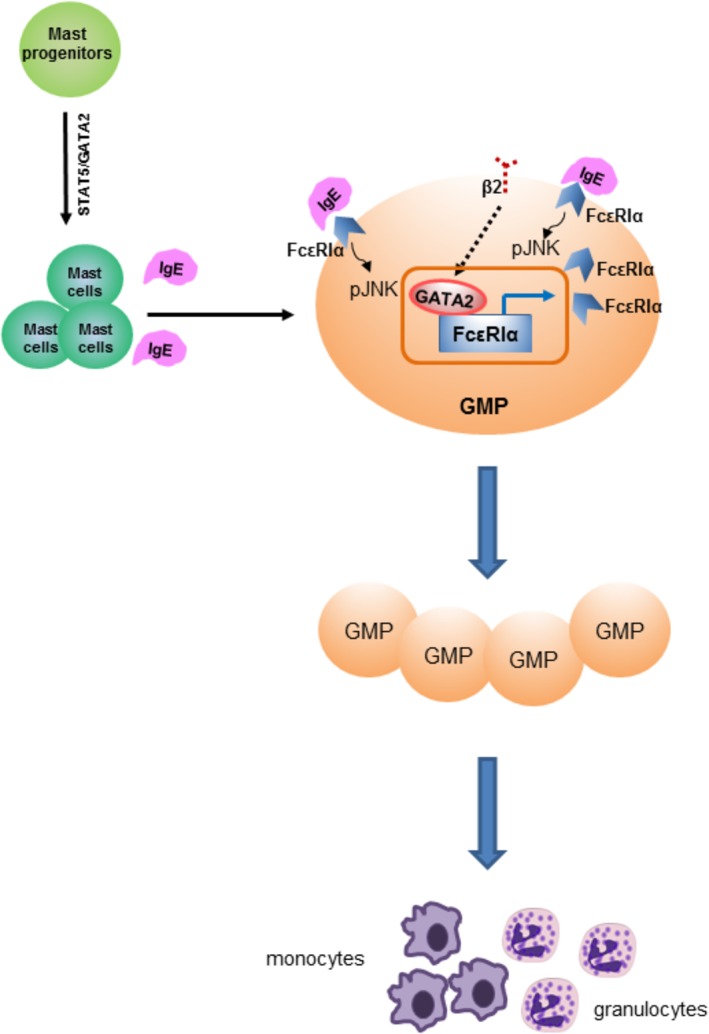
Proposed model. Integrin β2 governs GMP proliferation under control. The deficiency of β2 increases GATA2 expression in GMP, which could transcriptionally activate FcεRIα expression. Binding of IgE to FcεRIα promotes JNK phosphorylation for GMP proliferation. Ultimately, GMP become activated and constitutively remain in proliferative status. Abbreviation: GMP, granulocyte/macrophage progenitor.
This study provides an example stating of how GMP proliferation could cause exuberant myeloid cell expansion. We demonstrate that myelocytosis does not depend on HSC and HSPC activation but can result solely from myeloid progenitor proliferation. Nagareddy et al. reported that hyperglycemia stimulated GMP proliferation which was the core for monocytosis and neutrophilia in type 1 diabetes mellitus, even if HSC and HSPC frequency was not affected by the hyperglycemia in mice 13. Mechanistically, hyperglycemia increased reactive oxygen species production and promoted S100A8 and S100A9 secretion from neutrophils in BM. Binding of S100A8 and S100A9 to RAGE on CMP triggered M‐CSF production. In conjunction with GM‐CSF, they induced CMP and GMP proliferation 13. Here, we observed increased S100A9 levels in BM fluid of β2−/− mice but RAGE expression in GMP did not differ between the two groups.
Accumulative evidence has shown that IL‐3, IL‐6, GM‐CSF, TNF‐α, and S100A8/A9, by acting through their receptors on GMP, are able to promote myeloid cell production 6, 7, 8, 9, 10, 11, 12. Except these conventional stimulators, our study verified that integrin β2 could control GMP proliferation. Leukocyte adhesion deficiency (LAD) is a human disease caused by β2 integrin deficiency 23 and mutations in the protein Kindlin‐3 also causes a LAD (type III) syndrome 24. It is well known that Talin and Kindlin bind to the cytoplasmic domains of integrin β2 and mediate downstream signal transduction of the integrin upon ligand binding 25. Recently, the role of Kindlin‐3 in hematopoiesis was uncovered. Using Kindlin‐3‐deficient mice, they showed that Kindlin‐3–deficient HSC were quiescence and remained in the BM but became hyperactivated and lost in the circulation when they were transplanted into irradiated recipients 26. These observations together with our findings expand our understanding of integrin β2 from cell adhesion to regulation of hematopoiesis and myelopoiesis.
GATA1 is required for the maturation of red blood cells, megakaryocytes, and mast cells 27 whereas GATA2 is a mediator of hematopoiesis, especially myeloid lineage differentiation 28. Haploinsufficiency of GATA2 is implied in myelodysplastic syndrome and acute myeloid leukemia 29. GATA1 and GATA2 have been identified transcription factors to FcεRI transcription in mast cells 16. FcεRI consists of α‐, β‐, and γ‐chains. Although transfection of small interfering RNAs (siRNAs) against GATA1 and GATA2 inhibit FcεRI expression in mast cell line, they regulate FcεR1 transcription in different manners. GATA2 siRNA suppresses both α and β transcript but GATA1 siRNA only suppresses the α transcript 16. In our study, we observed increased mast cell number in blood and BM of β2−/− mice and increased GATA2 expression in β2−/− GMP, compared with wide type controls. In line with previous reports 15, 16, we confirmed that GATA2 could regulate FcεRIα transcription by luciferase reporter assay. These data indicate that GATA2 rather than GATA1 could be the driven force for mast cell production in β2−/− mice. In addition, in vitro, we demonstrated that the addition of IgE induced GMP expansion FcεRIα+lineage−/low cells rather than FcεRIα−lineage−/low cells. Although we do not know how β2 deficiency increased GATA2 expression, transcriptional activation of the GATA2 target gene, FcεRIα, was the core for GMP proliferation in β2−/− mice.
The present study must be interpreted within the context of some potential limitations. FcεRIαhi GMP are generally considered as mast progenitors 30. First, we observed greater myeloid cell production in recipients transplanted with β2−/− BMC, which could be resulted from both impaired myeloid cell retention in BM niche and skewed GMP proliferation; second, we could only quantify FcεRIα+CD45+cKit+ mast cells to assess their production. Alternatively, histamine levels were elevated in the blood and BM fluid in β2−/− mice compared with their littermate controls. Third, we do not know how IgE levels were increased in the PB and BM fluid in β2−/− mice. Even though, a recent study reported that patients with type I LAD have increased risk of autoimmune complications 31. And fourth, we do not know which partner of β2 participated in GMP proliferation in the study. It is well known that integrin β2 has four partners: CD11a, CD11b, CD11c, and CD11d. As reported in the literature, subjects with LAD disease were absence of CD18, CD11b, CD11c but CD11a expression and function was present 32, 33, 34. Therefore, how β2 integrins participate in immunity and which partner involves in skewed GMP proliferation need further investigation.
In conclusion, β2 deficiency upregulated GATA2/FcεRIα expression in GMP. Binding of IgE to FcεRIα stimulated GMP proliferation which was abrogated by the inhibition of JNK phosphorylation. Therefore, GMP became sustained proliferation for enhanced myeloid cell production.
Conclusion
HSC activation and sustained GMP proliferation both contribute to myeloid lineage production. Herein, we demonstrated a novel function for the GATA2/ FcεRIα/pJNK axis in GMP proliferation. In the absence of integrin β2, GATA2 expression was increased which could transcriptionally activate its target gene, FcεRIα. Binding IgE to FcεRIα induced JNK phosphorylation leading to GMP expansion. Ultimately, GMP become constitutively activated for proliferation, leading to myelocytosis.
Author Contributions
Y.‐M.F.: initiated, conducted the study, analyzed the data and drafted the manuscript; L.‐J.Z., C.Y., S.S., X.‐J.M., and D.Z.: performed the experiments; T.P.: generated CD18−/− mice and the littermates; C.M.V.: provided intellectual input and participated in manuscript preparation.
Disclosure of Potential Conflicts of Interest
The authors indicated no potential conflicts of interest.
Supporting information
Appendix S1: Supplementary data
Acknowledgments
This work was supported by National Science funding in China (#81470566, #81670765, #81770890) to Ying‐Mei Feng and the FWO G0E0117N and G0D1715N to Catherine Verfaillie.
References
- 1. Akashi K, Traver D, Miyamoto T et al. A clonogenic common myeloid progenitor that gives rise to all myeloid lineages. Nature 2000;404:193–197. [DOI] [PubMed] [Google Scholar]
- 2. Hidalgo A, Robledo MM, Teixido J. CD44‐mediated hematopoietic progenitor cell adhesion and its complex role in myelopoiesis. J Hematother Stem Cell Res 2002;11:539–547. [DOI] [PubMed] [Google Scholar]
- 3. Fierro FA, Taubenberger A, Puech PH et al. BCR/ABL expression of myeloid progenitors increases beta1‐integrin mediated adhesion to stromal cells. J Mol Biol 2008;377:1082–1093. [DOI] [PubMed] [Google Scholar]
- 4. Wang X, Gao M, Schouteden S et al. Hematopoietic stem/progenitor cells directly contribute to arteriosclerotic progression via integrin beta2. Stem Cells 2015;33:1230–1240. [DOI] [PMC free article] [PubMed] [Google Scholar]
- 5. Hettinger J, Richards DM, Hansson J et al. Origin of monocytes and macrophages in a committed progenitor. Nat Immunol 2013;14:821–830. [DOI] [PubMed] [Google Scholar]
- 6. Palacios R, Garland J. Distinct mechanisms may account for the growth‐promoting activity of interleukin 3 on cells of lymphoid and myeloid origin. Proc Natl Acad Sci USA 1984;81:1208–1211. [DOI] [PMC free article] [PubMed] [Google Scholar]
- 7. Maltby S, Hansbro NG, Tay HL et al. Production and differentiation of myeloid cells driven by proinflammatory cytokines in response to acute pneumovirus infection in mice. J Immunol 2014;193:4072–4082. [DOI] [PMC free article] [PubMed] [Google Scholar]
- 8. Ganguly D, Paul K, Bagchi J et al. Granulocyte‐macrophage colony‐stimulating factor drives monocytes to CD14low CD83+ DCSIGN‐ interleukin‐10‐producing myeloid cells with differential effects on T‐cell subsets. Immunology 2007;121:499–507. [DOI] [PMC free article] [PubMed] [Google Scholar]
- 9. Oduro KA Jr, Liu F, Tan Q et al. Myeloid skewing in murine autoimmune arthritis occurs in hematopoietic stem and primitive progenitor cells. Blood 2012;120:2203–2213. [DOI] [PMC free article] [PubMed] [Google Scholar]
- 10. Ryckman C, Robichaud GA, Roy J et al. HIV‐1 transcription and virus production are both accentuated by the proinflammatory myeloid‐related proteins in human CD4+ T lymphocytes. J Immunol 2002;169:3307–3313. [DOI] [PubMed] [Google Scholar]
- 11. Ohmori K, Luo Y, Jia Y et al. IL‐3 induces basophil expansion in vivo by directing granulocyte‐monocyte progenitors to differentiate into basophil lineage‐restricted progenitors in the bone marrow and by increasing the number of basophil/mast cell progenitors in the spleen. J Immunol 2009;182:2835–2841. [DOI] [PMC free article] [PubMed] [Google Scholar]
- 12. Chou DB, Sworder B, Bouladoux N et al. Stromal‐derived IL‐6 alters the balance of myeloerythroid progenitors during Toxoplasma gondii infection. J Leukoc Biol 2012;92:123–131. [DOI] [PMC free article] [PubMed] [Google Scholar]
- 13. Nagareddy PR, Murphy AJ, Stirzaker RA et al. Hyperglycemia promotes myelopoiesis and impairs the resolution of atherosclerosis. Cell Metab 2013;17:695–708. [DOI] [PMC free article] [PubMed] [Google Scholar]
- 14. Walczak‐Drzewiecka A, Salkowska A, Ratajewski M et al. Epigenetic regulation of CD34 and HIF1A expression during the differentiation of human mast cells. Immunogenetics 2013;65:429–438. [DOI] [PMC free article] [PubMed] [Google Scholar]
- 15. Li Y, Qi X, Liu B et al. The STAT5‐GATA2 pathway is critical in basophil and mast cell differentiation and maintenance. J Immunol 2015;194:4328–4338. [DOI] [PMC free article] [PubMed] [Google Scholar]
- 16. Inage E, Kasakura K, Yashiro T et al. Critical roles for PU.1, GATA1, and GATA2 in the expression of human FcepsilonRI on mast cells: PU.1 and GATA1 transactivate FCER1A, and GATA2 transactivates FCER1A and MS4A2. J Immunol 2014;192:3936–3946. [DOI] [PubMed] [Google Scholar]
- 17. Riether C, Schurch CM, Ochsenbein AF. Regulation of hematopoietic and leukemic stem cells by the immune system. Cell Death Differ 2015;22:187–198. [DOI] [PMC free article] [PubMed] [Google Scholar]
- 18. Hirche C, Frenz T, Haas SF et al. Systemic virus infections differentially modulate cell cycle state and functionality of long‐term hematopoietic stem cells in vivo. Cell Rep 2017;19:2345–2356. [DOI] [PubMed] [Google Scholar]
- 19. Gao M, Zhao D, Schouteden S et al. Regulation of high‐density lipoprotein on hematopoietic stem/progenitor cells in atherosclerosis requires scavenger receptor type BI expression. Arterioscler Thromb Vasc Biol 2014;34:1900–1909. [DOI] [PMC free article] [PubMed] [Google Scholar]
- 20. Chistiakov DA, Grechko AV, Myasoedova VA et al. The role of monocytosis and neutrophilia in atherosclerosis. J Cell Mol Med 2018;22:1366–1382. [DOI] [PMC free article] [PubMed] [Google Scholar]
- 21. Yu VW, Scadden DT. Heterogeneity of the bone marrow niche. Curr Opin Hematol 2016;23:331–338. [DOI] [PMC free article] [PubMed] [Google Scholar]
- 22. Baryawno N, Severe N, Scadden DT. Hematopoiesis: Reconciling historic controversies about the niche. Cell Stem Cell 2017;20:590–592. [DOI] [PubMed] [Google Scholar]
- 23. Hajishengallis G, Moutsopoulos NM. Etiology of leukocyte adhesion deficiency‐associated periodontitis revisited: Not a raging infection but a raging inflammatory response. Expert Rev Clin Immunol 2014;10:973–975. [DOI] [PMC free article] [PubMed] [Google Scholar]
- 24. Crazzolara R, Maurer K, Schulze H et al. A new mutation in the KINDLIN‐3 gene ablates integrin‐dependent leukocyte, platelet, and osteoclast function in a patient with leukocyte adhesion deficiency‐III. Pediatr Blood Cancer 2015;62:1677–1679. [DOI] [PubMed] [Google Scholar]
- 25. Saultier P, Szepetowski S, Canault M et al. Long‐term management of leukocyte adhesion deficiency type III without hematopoietic stem cell transplantation. Haematologica 2018;103:e264–e267. [DOI] [PMC free article] [PubMed] [Google Scholar]
- 26. Ruppert R, Moser M, Sperandio M et al. Kindlin‐3‐mediated integrin adhesion is dispensable for quiescent but essential for activated hematopoietic stem cells. J Exp Med 2015;212:1415–1432. [DOI] [PMC free article] [PubMed] [Google Scholar]
- 27. Crispino JD. GATA1 in normal and malignant hematopoiesis. Semin Cell Dev Biol 2005;16:137–147. [DOI] [PubMed] [Google Scholar]
- 28. Nandakumar SK, Johnson K, Throm SL et al. Low‐level GATA2 overexpression promotes myeloid progenitor self‐renewal and blocks lymphoid differentiation in mice. Exp Hematol 2015;43:565–577. [DOI] [PubMed] [Google Scholar]
- 29. Katsumura KR, Ong IM, DeVilbiss AW et al. GATA factor‐dependent positive‐feedback circuit in acute myeloid leukemia cells. Cell Rep 2016;16:2428–2441. [DOI] [PMC free article] [PubMed] [Google Scholar]
- 30. Dahlin JS, Malinovschi A, Ohrvik H et al. Lin‐ CD34hi CD117int/hi FcepsilonRI+ cells in human blood constitute a rare population of mast cell progenitors. Blood 2016;127:383–391. [DOI] [PMC free article] [PubMed] [Google Scholar]
- 31. De Rose DU, Giliani S, Notarangelo LD et al. Long term outcome of eight patients with type 1 Leukocyte Adhesion Deficiency (LAD‐1): Not only infections, but high risk of autoimmune complications. Clin Immunol 2018;191:75–80. [DOI] [PubMed] [Google Scholar]
- 32. Shaw JM, Al‐Shamkhani A, Boxer LA et al. Characterization of four CD18 mutants in leucocyte adhesion deficient (LAD) patients with differential capacities to support expression and function of the CD11/CD18 integrins LFA‐1, Mac‐1 and p150,95. Clin Exp Immunol 2001;126:311–318. [DOI] [PMC free article] [PubMed] [Google Scholar]
- 33. Dababneh R, Al‐Wahadneh AM, Hamadneh S et al. Periodontal manifestation of leukocyte adhesion deficiency type I. J Periodontol 2008;79:764–768. [DOI] [PubMed] [Google Scholar]
- 34. Deshpande P, Kathirvel K, Alex AA et al. Leukocyte adhesion deficiency‐I: Clinical and molecular characterization in an Indian population. Indian J Pediatr 2016;83:799–804. [DOI] [PubMed] [Google Scholar]
Associated Data
This section collects any data citations, data availability statements, or supplementary materials included in this article.
Supplementary Materials
Appendix S1: Supplementary data


