

Abstract
Background
The weight‐reducing effect of exenatide has been proved, but too much weight loss in normal‐weight patients may concern physicians. This study evaluated the effects of exenatide monotherapy on glycemic control and weight change in normal‐weight, overweight, and obese patients with newly diagnosed type 2 diabetes (T2D).
Methods
In this multicenter prospective study, 29 normal‐weight, 54 overweight, and 27 obese newly diagnosed and drug‐naïve patients with T2D were treated with exenatide for 48 weeks. The primary efficacy endpoint was the effect of baseline body mass index (BMI) on glycemic control, measured as the change in HbA1c from baseline to Week 48 compared among different BMI groups. Other endpoints included comparisons of the effects of exenatide on fasting plasma glucose (FPG), postprandial plasma glucose (PPG), body weight, and other metabolic indices.
Results
After 48‐week treatment, the estimated mean changes in HbA1c in normal‐weight, overweight, and obese patients were −1.9%, −1.8%, and −1.5%, respectively (P = 0.290 among groups after adjustment for baseline values). There were similar declines in FPG and 0.5‐ and 2‐hour PPG among groups. There were non‐significant trends from normal‐weight to overweight to obese patients for increased weight reduction (decreases of 2.2, 3.9, and 4.0 kg, respectively; P = 0.104) and changes in waist circumference (decreases of 2.2, 3.2, and 5.6 cm, respectively; P = 0.078).
Conclusions
Baseline BMI had no effect on glycemic control, weight change, or other metabolic indices with exenatide monotherapy. Normal‐weight patients with T2D would benefit from exenatide as much as overweight or obese patients on glucose control, without increased risk of excess weight loss.
Keywords: body weight, exenatide, type 2 diabetes
Highlights
This study demonstrates that glycemic control with exenatide monotherapy is similar among normal‐weight, overweight, and obese Chinese patients with newly diagnosed type 2 diabetes (T2D). Body weight decreased by 3.7%, 5.5%, and 5.7% in normal‐weight, overweight, and obese patients, respectively.
Hence, normal‐weight patients with T2D would benefit from exenatide as much as overweight or obese patients on glucose control, without an increased risk of excess weight loss.
摘要
背景
艾塞那肽减重的作用已被研究证实,但医生可能会担心正常体重的患者接受艾塞那肽治疗后体重过度下降。本研究将评估艾塞那肽对正常体重、超重和肥胖的初诊2型糖尿病患者血糖控制和体重改变的影响。
方法
在这项多中心、前瞻性临床研究中纳入了初诊且未接受过药物治疗的2型糖尿病患者,他们接受了艾塞那肽治疗48周,其中正常体重组29人,超重组54人,肥胖组27人。主要终点为基线体重指数(body mass index,BMI)对于不同BMI组患者血糖控制的影响。采用各组48周治疗后糖化血红蛋白(HbA1c)与基线HbA1c的变化值作为评估指标。其他终点包括艾塞那肽对于各组患者空腹血糖、餐后血糖、体重和其他代谢指标的影响。
结果
经过48周的治疗,正常体重、超重和肥胖组患者的HbA1c平均下降了1.9%、1.8%和1.5%(校正了基线HbA1c水平后,组间比较P值为0.290)。各组间空腹血糖、餐后半小时血糖和餐后2小时血糖的下降情况相近。体重下降幅度和腰围下降幅度从正常体重、超重到肥胖组呈现逐渐增加的趋势,但没有达到统计学差异(体重下降分别为2.2公斤、3.9公斤和4.0公斤,P = 0.104;腰围下降分别为2.2厘米、3.2厘米和5.6厘米,P = 0.078)。
结论
基线BMI对接受艾塞那肽单药治疗的初诊2型糖尿病患者的血糖控制、体重变化和其他代谢指标没有明显影响。正常体重的2型糖尿病患者接受艾塞那肽治疗可获得与超重、肥胖患者一样的血糖控制疗效,并且没有增加体重过度降低的风险。
Keywords: 体重, 艾塞那肽, 2型糖尿病
1. INTRODUCTION
Overweight and obesity are common concomitant diseases of type 2 diabetes (T2D). A survey conducted in the US from 1999 to 2002 showed that the prevalence of overweight and obesity was 85.2%, and that the prevalence of obesity was 54.8% among adults with diagnosed diabetes.1 In China, 43.0% of patients with T2D are overweight, and 16.7% are obese.2 Conversely, modest sustained weight loss of more than 5% in T2D patients can lead to clinically meaningful metabolic benefits.3 Weight loss should be considered in all overweight or obese patients with T2D, given the known therapeutic effects of weight loss on improvements in glucose levels, blood pressure, lipid profiles, and other metabolic indices.4, 5 Accordingly, a patient‐centered approach recommended in recent management guidelines should be used to guide the choice of antihyperglycemic agents in patients with diabetes, addressing not only glucose‐lowering efficacy, but also fewer side effects, including less weight gain (even weight loss) and less hypoglycemia.6, 7
Glucagon‐like peptide‐1 (GLP‐1) receptor agonists (GLP‐1RAs) have multiple glucoregulatory effects, including enhancement of glucose‐dependent insulin secretion, reduction of glucagon secretion, reduction of food intake, and slowing of gastric emptying.8, 9, 10 In addition to the glucose‐lowing effect, weight reduction and a low incidence of hypoglycemia associated with GLP‐1RAs treatment have been proven in clinical trials and real‐world practice.9, 10, 11, 12, 13, 14 Many guidelines, including the American Diabetes Association (ADA) and European Association for the Study of Diabetes (EASD) consensus algorithm,15 ADA guidelines,16 and the most recent Chinese guideline,17 recommend GLP‐1RAs for T2D as an option after metformin monotherapy, especially in patients with established atherosclerotic cardiovascular disease or concerning body weight gain. Prescriptions of GLP‐1RAs have increased and these drugs have become more popular, especially in overweight and obese patients with T2D. Yet, the efficacy and safety of GLP‐1RAs in normal‐weight patients with T2D have not been evaluated. As a result, some physicians are reluctant to use GLP‐1RAs in this population.
Unlike patients in Western countries, a large proportion of patients with T2D in China are of normal weight (defined as a body mass index [BMI] <24 kg/m2].18 Hence, it is of clinical importance to understand whether normal‐weight patients with T2D would benefit from GLP‐1RAs in addition to patients who are overweight (24 kg/m2 ≤ BMI < 28 kg/m2) or obese (BMI ≥ 28 kg/m2).18 Moreover, the effect of GLP‐1RAs on weight reduction in patients with different BMIs is also worth investigating.
This study is an ancillary study of the CONFIDENCE study (registered with http://clinicaltrials.gov; ID: NCT01147627). The present study was designed to explore the effects of exenatide, the first GLP‐1RA in the market, specifically glucose‐lowing efficacy, weight change, and other metabolic indices, in Chinese patients with newly diagnosed T2D with different baseline BMI.
2. METHODS
Detailed methods and results of the CONFIDENCE study have been published previously.19 The CONFIDENCE study was a 48‐week multicenter clinical trial conducted from August 2010 to August 2012 at 25 university‐affiliated hospitals in 13 provinces of China. The protocol was approved by the institutional review board at each site in accordance with the Declaration of Helsinki. All patients provided written informed consent before screening.
Newly diagnosed and treatment‐naïve patients with T2D aged 30 to 70 years, with glycosylated hemoglobin A1c (HbA1c) 7.0% to 10.0%; BMI 18 to 35 kg/m2, and stable body weight for ≥3 months, were recruited to the study. Patients with acute or severe chronic diabetic complications or illnesses (ketoacidosis, hyperosmotic state, lactic acidosis, severe micro‐ and macrovascular complications, and hepatic dysfunction), positive glutamic acid decarboxylase antibodies, a history of pancreatitis, triglyceride levels ≥5 mM, and using drugs affecting gastrointestinal motility, weight, and glucose were excluded from the study.
At baseline, demographic and anthropometric data were recorded. Fasting plasma glucose (FPG), HbA1c, lipid profiles, fasting insulin (FINS), fasting proinsulin, amylase, and lipase were measured. After a mixed‐meal test (MMT; 162 kcal), venous blood samples were collected 0.5 and 2 hours after ingestion to determine glucose and insulin levels. On the next day, an intravenous glucose tolerance test (IVGTT) using 25 g glucose was performed after an overnight fast, with venous blood samples taken at 0, 1, 2, 4, 6, and 10 minutes to measure insulin levels. After baseline measurements, patients were instructed to inject 5 μg, s.c., exenatide (Amylin Pharmaceuticals, San Diego, California) twice daily, and increase the dose to 10 μg twice daily after 4 weeks. Patients who frequently experienced hypoglycemia or could not tolerate adverse events (AEs) were instructed to reduce the dose to 5 μg exenatide twice daily.
Patients were followed up every 4 weeks for 12 weeks and then at 12‐weekly intervals until Week 48. At each follow‐up visit, HbA1c, FPG, and 2‐hour postprandial glucose (PPG) after the MMT were measured. In addition, 0.5‐hour PPG was measured at the last visit (Week 48). All baseline assessments were repeated at Week 48. To avoid any acute drug effects on the collected data, patients were asked to stop exenatide 2 days before the last visit. All patients received diabetes education at enrolment, with reinforcement throughout the study. Telephone calls were scheduled at Week 16, 20, 28, 32, 40, and 44 to collect patients' information and provide guidance. Safety and tolerability were assessed at each visit. Minor hypoglycemia was defined as symptoms confirmed by a blood glucose concentration < 3.9 mM, with prompt recovery after self‐administered carbohydrate. Major hypoglycemia was defined as an event requiring the assistance of another person to administer carbohydrate, glucagon, or other resuscitative treatments.
2.1. Laboratory assessments
Levels of HbA1c were assessed centrally at the Third Affiliated Hospital of Sun Yat‐sen University. Insulin and proinsulin levels were measured centrally at the Beijing North Institute of Biological Technology. The remaining biochemical variables were assessed locally at the participating centers. β‐cell function was evaluated with different indices, namely the homeostatic model assessment of β‐cell function (HOMA‐β; calculated as HOMA‐β = 20 × FINS/[FPG ‐ 3.5]) and the homeostasis model assessment of insulin resistance (HOMA‐IR; calculated as HOMA‐IR = FINS × FPG/22.5), used to estimate basal β‐cell function and insulin resistance, respectively. The acute insulin response (AIR) during the IVGTT was calculated as the incremental area under the curve using trapezoidal estimation. The fasting proinsulin: insulin ratio [PI/I] was also calculated.
2.2. Study endpoints
The primary efficacy endpoint was the change from baseline in HbA1c at Week 48 compared among different BMI groups. Secondary endpoints included the proportion of patients achieving HbA1c <7.0% and ≤6.5% at Week 48, changes from baseline in FPG, 2‐hour PPG, lipid profiles, body weight, blood pressure, and β‐cell function. Safety and tolerability were also assessed.
2.3. Statistical analyses
Continuous variables with a normal distribution are presented as the mean ± SD. Non‐normally distributed variables (HOMA‐β, HOMA‐IR, and PI/I) were logarithmically transformed before analysis. Patients were divided into three groups based on baseline BMI: (a) normal‐weight group (18.5 kg/m2 ≤ BMI < 24 kg/m2), (b) overweight group (24 kg/m2 ≤ BMI < 28 kg/m2), and (c) obese group (BMI ≥ 28 kg/m2).18 To compare the treatment effect on HbA1c among BMI groups, analysis of covariance (ancova) was used, with the change in HbA1c from baseline to Week 48 as the dependent variable, BMI groups as the fixed main effect, and baseline HbA1c as the covariate. The significance of differences in other continuous variables between groups was tested by univariate analysis of variance (anova). Chi‐squared tests were used to compare the proportion of patients achieving HbA1c <7.0% and ≤6.5% at Week 48 and the exenatide dose reduction rate among groups. Pairwise comparisons for continuous variables in different BMI groups were made using t tests. Data regarding AEs were summarized according to baseline BMI. Data were analyzed with SPSS 20.0 (IBM Corp., New York, NY, USA). Significance was defined as two‐tailed P < 0.05.
3. RESULTS
In all, 142 patients aged 31 to 69 years were enrolled in the study. Patients were divided into the normal‐weight group (n = 34), the overweight group (n = 72), and the obese group (n = 36). All patients who took at least one dose of study medication (intention‐to‐treat [ITT] population; n = 142) were included in the safety analysis. Efficacy analysis was conducted in the 110 patients who completed the 48‐week study (per‐protocol [PP] population), as well as in the ITT population for supporting analysis.
Patients' baseline characteristics are summarized in Table 1. Patients' body weight at baseline ranged from 49 to 106 kg, with BMI ranging from 19.0 to 34.9 kg/m2. A statistically significant difference was found among groups in terms of HbA1c at baseline, which was adjusted for when the efficacy endpoint was analyzed. As expected, baseline body weight, BMI, and waist circumference were significantly different among the three groups.
Table 1.
Baseline characteristics of patients in the normal‐weight, overweight, and obese groups
| Normal‐weight (n = 34) | Overweight (n = 72) | Obese (n = 36) | P‐valuea | |
|---|---|---|---|---|
| No. males/females | 21/13 | 50/22 | 27/9 | 0.486 |
| Age (y) | 50.3 ± 10.4 | 51.0 ± 9.2 | 47.3 ± 9.5 | 0.165 |
| HbA1c (%) | 8.5 ± 1.2 | 7.9 ± 1.0 † | 7.9 ± 0.9 | 0.027 |
| Weight (kg) | 60.2 ± 7.4 | 72.8 ± 8.5††† | 83.7 ± 8.7†††,‡‡‡ | <0.001 |
| BMI (kg/m2) | 22.3 ± 1.2 | 25.9 ± 1.1††† | 30.1 ± 1.5†††,‡‡‡ | <0.001 |
| WC (cm) | 81.6 ± 6.0 | 91.0 ± 7.1††† | 100.8 ± 6.1†††,‡‡‡ | <0.001 |
| WHR | 0.89 ± 0.05 | 0.92 ± 0.06† | 0.96 ± 0.04†††,‡‡ | <0.001 |
| FPG (mM) | 9.2 ± 2.1 | 8.6 ± 1.7 | 9.2 ± 3.2 | 0.291 |
| 0.5‐h PPG (mM) | 11.9 ± 2.5 | 12.0 ± 2.6 | 12.0 ± 3.2 | 0.970 |
| 2‐h PPG (mM) | 14.7 ± 3.5 | 13.9 ± 2.8 | 13.8 ± 3.5 | 0.459 |
| TC (mM) | 4.94 ± 1.33 | 5.18 ± 1.02 | 4.95 ± 1.05 | 0.464 |
| TG (mM) | 1.62 ± 1.01 | 1.98 ± 1.07 | 2.20 ± 1.16 | 0.092 |
| HDL‐C (mM) | 1.20 ± 0.30 | 1.17 ± 0.29 | 1.02 ± 0.23†,‡ | 0.016 |
| LDL‐C (mM) | 3.28 ± 0.81 | 3.21 ± 0.85 | 3.06 ± 0.79 | 0.561 |
| SBP (mm Hg) | 123 ± 18 | 125 ± 14 | 129 ± 16 | 0.287 |
| DBP (mm Hg) | 78 ± 9 | 81 ± 9 | 83 ± 10 | 0.097 |
| Lg(HOMA‐β) | 1.55 ± 0.26 | 1.69 ± 0.28† | 1.76 ± 0.28†† | 0.010 |
| Lg(HOMA‐IR) | 0.57 ± 0.16 | 0.65 ± 0.21 | 0.78 ± 0.25†††,‡‡ | 0.001 |
| Lg(PI/I) | 0.54 ± 0.21 | 0.44 ± 0.28 | 0.48 ± 0.30 | 0.297 |
| AIR (μU/mL×min) | 14.20 ± 40.55 | 9.73 ± 44.83 | 17.17 ± 69.04 | 0.771 |
Abbreviations: AIR, acute insulin response; BMI, body mass index; DBP, diastolic blood pressure; FPG, fasting plasma glucose; HDL‐C, high‐density lipoprotein cholesterol; HOMA‐IR, homeostasis model assessment of insulin resistance; HOMA‐β, homeostatic model assessment of β‐cell function; LDL‐C, low‐density lipoprotein cholesterol; PI/I, fasting proinsulin: insulin ratio; PPG, postprandial plasma glucose; SBP, systolic blood pressure; TC, total cholesterol; TG, triglycerides; WC, waist circumference; WHR, waist: hip ratio; Lg, logarithm.
Unless indicated otherwise, data are expressed as the mean ± SD. † P < 0.05, †† P < 0.01, ††† P < 0.001 compared with the normal‐weight group, ‡ P < 0.05, ‡‡ P < 0.01, ‡‡‡ P < 0.001 compared with the overweight group.
P‐values are for comparisons among the three groups.
Twenty‐nine patients in the normal‐weight group, 54 patients in the overweight group and 27 patients in the obese group completed the study (Figure 1).
Figure 1.
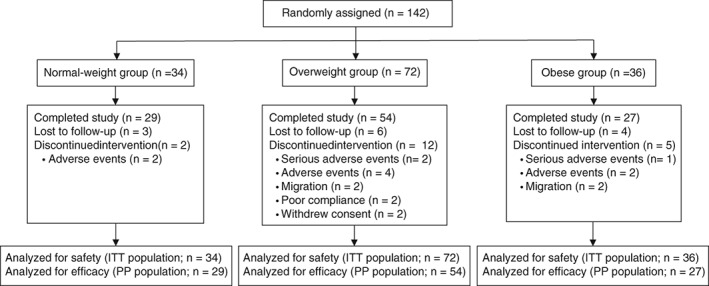
Trial profile. ITT, intention‐to‐treat population who took at least one dose of study medication; PP, per‐protocol population who completed the 48‐week study
The efficacy results presented here are from analysis of the PP population; similar findings were obtained from analysis of the ITT population (data not shown).
3.1. Glycemic control
There was a significant decrease in HbA1c in all patients, regardless of baseline BMI. After 48 weeks exenatide treatment, the mean HbA1c reduction in this population was 1.8 ± 0.1%. The mean changes in HbA1c in the normal‐weight, overweight, and obese groups were −2.3%, −1.7%, and −1.4%, respectively. After adjusting for baseline HbA1c values, the estimated mean HbA1c changes in the normal‐weight, overweight, and obese groups were −1.9%, −1.8%, and −1.5%, respectively (P = 0.290). Mean FPG and 2‐hour PPG levels decreased similarly over time among all BMI groups over the course of 48‐week treatment with exenatide (Figure 2). No significant differences in FPG and 2‐hour PPG levels were found among the groups at any visit. Changes in FPG and 0.5‐ and 2‐hour PPG levels from baseline were similar in all BMI groups after 48‐week treatment with exenatide (Table 2).
Figure 2.
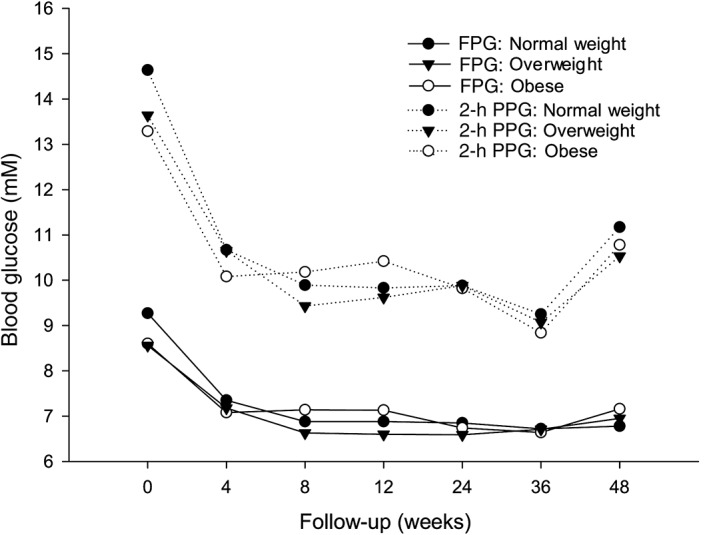
Changes in the mean values of the fasting plasma glucose (FPG) and 2‐h postprandial glucose (PPG) over time in the normal‐weight, overweight, and obese groups
Table 2.
Changes in clinical characteristics from baseline to week 48 in the normal‐weight, overweight, and obese groups (per‐protocol population)
| Normal‐weight (n = 29) | Overweight (n = 54) | Obese (n = 27) | P‐valuea | |
|---|---|---|---|---|
| HbA1c (%) | ||||
| Baseline | 8.4 ± 1.2 | 7.8 ± 1.0 | 7.9 ± 1.0 | 0.059 |
| Change from baseline | −2.3 ± 1.2††† | −1.7 ± 1.4††† | −1.4 ± 1.0††† | 0.041 |
| P‐value | ||||
| Normal vs overweight | 0.060 | |||
| Normal vs obese | <0.05 | |||
| Overweight vs obese | 0.322 | |||
| Change from baseline adjusted for baseline HbA1c | −1.9 ± 0.2††† | −1.8 ± 0.1††† | −1.5 ± 0.2††† | 0.290 |
| Weight (kg) | ||||
| Baseline | 59.5 ± 7.1 | 72.7 ± 8.3‡‡‡ | 83.7 ± 8.8‡‡‡ | <0.001 |
| Change from baseline | −2.2 ± 2.8††† | −3.9 ± 3.2††† | −4.0 ± 5.4†† | 0.104 |
| Body mass index (kg/m2) | ||||
| Baseline | 22.2 ± 1.3 | 26.0 ± 1.1‡‡‡ | 29.9 ± 1.2‡‡‡ | <0.001 |
| Change from baseline | −0.9 ± 1.0††† | −1.4 ± 1.1††† | −1.5 ± 1.9†† | 0.157 |
| Waist circumference (cm) | ||||
| Baseline | 81.8 ± 5.9 | 90.8 ± 7.4‡‡‡ | 100.9 ± 5.8‡‡‡ | < 0.001 |
| Change from baseline | −2.2 ± 6.6 | −3.2 ± 5.4††† | −5.6 ± 5.3††† | 0.078 |
| WHR | ||||
| Baseline | 0.9 ± 0.1 | 0.9 ± 0.1 | 1.0 ± 0.0‡‡‡ | < 0.001 |
| Change from baseline | −0.01 ± 0.07 | −0.00 ± 0.06 | −0.02 ± 0.05†† | 0.281 |
| Fasting plasma glucose (mM) | ||||
| Baseline | −9.3 ± 2.2 | 8.6 ± 1.6 | 8.7 ± 2.1 | 0.315 |
| Change from baseline | −2.5 ± 1.9††† | −1.7 ± 1.9††† | −1.5 ± 2.6†† | 0.159 |
| 0.5‐h PPG (mM) | ||||
| Baseline | 12.0 ± 2.5 | 11.8 ± 2.5 | 11.4 ± 2.6 | 0.666 |
| Change from baseline | −2.6 ± 2.3††† | −2.1 ± 2.8††† | −2.4 ± 2.7††† | 0.679 |
| 2‐h PPG (mM) | ||||
| Baseline | 14.6 ± 3.5 | 13.7 ± 2.8 | 13.2 ± 3.1 | 0.192 |
| Change from baseline | −3.5 ± 3.1††† | −3.2 ± 3.6††† | −2.4 ± 4.5† | 0.533 |
| Total cholesterol (mM) | ||||
| Baseline | 4.9 ± 1.4 | 5.1 ± 1.0 | 4.9 ± 1.0 | 0.625 |
| Change from baseline | −0.1 ± 1.0 | −0.2 ± 0.9 | −0.3 ± 0.7† | 0.569 |
| Triglycerides (mM) | ||||
| Baseline | 1.6 ± 1.1 | 2.0 ± 1.1 | 2.1 ± 1.2 | 0.22 |
| Change from baseline | −0.4 ± 1.2 | −0.3 ± 1.1 | 0.1 ± 1.3 | 0.277 |
| HDL‐C (mM) | ||||
| Baseline | 1.2 ± 0.3 | 1.2 ± 0.3 | 1.0 ± 0.2 | 0.061 |
| Change from baseline | 0.1 ± 0.3 | 0.1 ± 0.4† | 0.0 ± 0.2 | 0.252 |
| LDL‐C (mM) | ||||
| Baseline | 3.3 ± 0.8 | 3.2 ± 0.8 | 3.0 ± 0.7 | 0.609 |
| Change from baseline | −0.2 ± 0.6 | −0.2 ± 0.9 | −0.3 ± 0.5† | 0.785 |
| Systolic blood pressure (mm Hg) | ||||
| Baseline | 125 ± 18 | 126 ± 15 | 126 ± 13 | 0.928 |
| Change from baseline | −3.6 ± 12.8 | −4.7 ± 18.4 | −2.2 ± 11.9 | 0.8 |
| Diastolic blood pressure (mm Hg) | ||||
| Baseline | 78 ± 10 | 81 ± 10 | 81 ± 9 | 0.416 |
| Change from baseline | −2.0 ± 9.4 | −3.3 ± 10.9† | −3.2 ± 9.0 | 0.848 |
| Lg(HOMA‐β) | ||||
| Baseline | 1.54 ± 0.27 | 1.64 ± 0.28‡ | 1.80 ± 0.27‡‡ | 0.004 |
| Change from baseline | 0.10 ± 0.35 | −0.07 ± 0.28 | −0.12 ± 0.31 | 0.038 |
| P‐values | ||||
| Normal vs overweight | <0.05 | |||
| Normal vs obese | <0.05 | |||
| Overweight vs obese | 0.592 | |||
| Lg(HOMA‐IR) | ||||
| Baseline | 0.53 ± 0.27 | 0.64 ± 0.23‡ | 0.70 ± 0.22‡‡‡ | 0.001 |
| Change from baseline | −0.28 ± 0.28††† | −0.35 ± 0.24††† | −0.43 ± 0.27††† | 0.148 |
| Lg(PI/I) | ||||
| Baseline | 0.37 ± 0.41 | 0.47 ± 0.26 | 0.47 ± 0.27 | 0.61 |
| Change from baseline | −0.46 ± 0.75†† | −0.44 ± 0.64††† | −0.28 ± 0.62 | 0.648 |
| AIR (μU/mL×min) | ||||
| Baseline | 11.54 ± 38.51 | 6.66 ± 44.38 | 18.54 ± 74.60 | 0.886 |
| Change from baseline | 42.83 ± 67.66†† | 33.30 ± 60.56†† | 61.49 ± 167.51 | 0.548 |
Abbreviations: AIR, acute insulin response; HDL‐C, high‐density lipoprotein cholesterol; HOMA‐IR, homeostasis model assessment of insulin resistance; HOMA‐β, homeostatic model assessment of β‐cell function; LDL‐C, low‐density lipoprotein cholesterol; PI/I, fasting proinsulin: insulin ratio; PPG, postprandial plasma glucose; WHR, waist: hip rato; Lg, logarithm.
Data are expressed as the mean ± SD. † P < 0.05, †† P < 0.01, ††† P < 0.001 compared with baseline; ‡ P < 0.05, ‡‡ P < 0.01, ‡‡‡ P < 0.001 compared with baseline in the normal‐weight group.
P‐values are for comparisons among the three groups.
Regarding the rate of achieving HbA1c targets, 84.3% of the entire study population reached an HbA1c target of <7.0%, and 76.9% achieved the goal of HbA1c ≤6.5%. When patients were grouped according to baseline BMI, HbA1c targets of <7.0% and ≤6.5% were reached, respectively, by 89.7% and 75.9% of patients in the normal‐weight group, 83.3% and 79.6% in the overweight group, and 81.5% and 70.4% in the obese group, with no significant differences among groups.
Exenatide was reduced from 10 μg twice daily to 5 μg twice daily in 29 patients (n = 10, 15, and 4 patients in the normal‐weight, overweight, and obese groups, respectively) who experienced frequent hypoglycemic episodes (in six patients because of frequent episodes of confirmed hypoglycemia, and in nine patients because of frequent hypoglycemia symptoms without blood glucose confirmation) or could not tolerate AEs as predefined. The dose reduction rates were higher, albeit not significantly, in the normal‐weight (10/34; 29.4%) and overweight (15/72; 20.8%) groups than in the obese group (4/36; 11.1%; P = 0.164). Of these 29 patients, five withdrew and did not finish the study. The remaining 24 patients completed the study on exenatide 5 μg twice daily, with the smallest number in the obese group (n = 10, 11, and 3 in the normal‐weight, overweight and obese groups, respectively). Three of these 24 patients completed the study on a dose of 5 μg exenatide twice daily from the beginning of the study. The mean HbA1c change in the 24 patients who completed the study on 5 μg exenatide twice daily was −1.9 ± 0.3%, and the mean body weight change was −2.5 ± 0.8 kg at the end of the study. On the reduced dose, 20 (83%) and 17 (71%) patients achieved the HbA1c target of <7.0% and ≤6.5%, respectively. However, the study was underpowered to determine the characteristics of patients who would benefit from the lower dose with any statistical significance.
3.2. Anthropometric data and other metabolic indices
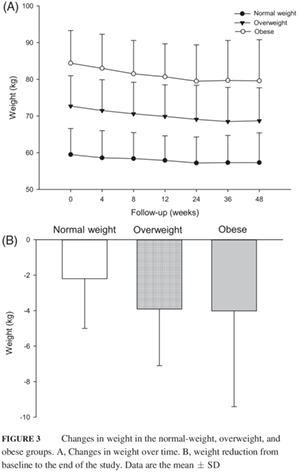
Patients' body weight decreased gradually over the treatment period (Figure 3), with the smallest percentage of body weight reduction (3.7%) in the normal‐weight group and the greatest (5.7%) in the obese group at Week 48. The initial percentage body weight reduction at Week 4 was 1.5%, 1.7%, and 1.7% in the normal‐weight, overweight and obese groups, respectively (Figure 3). The weight reductions exhibited a non‐significant increasing trend from normal‐weight to overweight to obese patients (decreases of 2.2, 3.9, and 4.0 kg, respectively; P = 0.104; Table 2; Figure 3). Body mass index decreased over treatment time and mirrored the weight loss trends in each BMI group (Table 2).
Figure 3.
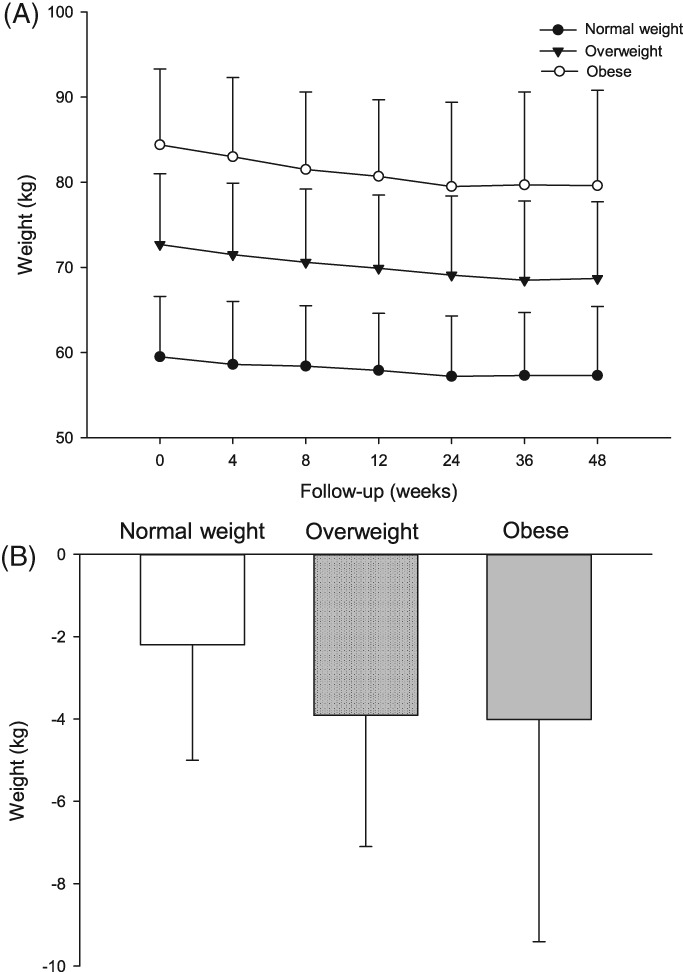
Changes in weight in the normal‐weight, overweight, and obese groups. A, Changes in weight over time. B, weight reduction from baseline to the end of the study. Data are the mean ± SD
At Week 48, waist circumferences had decreased from baseline by 2.2 ± 6.6, 3.2 ± 5.4, and 5.6 ± 5.3 cm in the normal‐weight, overweight, and obese groups, respectively (Table 2). No significant difference was found among the groups regarding changes in waist circumference. In addition, there was no significant difference among the group in the change in the waist: hip ratio from baseline to Week 48 (Table 2).
Changes from baseline in lipid profiles are given in Table 2. Compared with baseline levels, total cholesterol and low‐density lipoprotein cholesterol (LDL‐C) decreased in the obese group (P < 0.05), and high‐density lipoprotein cholesterol (HDL‐C) increased in the overweight group (P < 0.05). However, there were no significant differences in changes from baseline in the lipid profiles among groups.
There was no significant change in systolic blood pressure in any group compared with baseline measurements. Only in the overweight group did diastolic blood pressure decrease significantly (P < 0.05). Neither the change in systolic blood pressure nor the change in diastolic blood pressure from baseline differed among groups (Table 2).
3.3. β‐Cell function and insulin resistance
Significant improvements in PI/I and AIR from baseline to Week 48 were seen in all patients completing the 48‐week exenatide treatment (n = 110; lg(PI/I) deceased by 0.4 ± 0.1, and AIR increased by 42.4 ± 10.1 μU/mL×min; P < 0.001). However, HOMA‐β did not change significantly from baseline to the end of the study in this population. When patients were grouped according to baseline BMI, there was a non‐significant increase in HOMA‐β in the normal‐weight group at Week 48 compared with baseline. In both the normal‐weight and overweight groups, PI/I decreased and AIR increased. The improvements in PI/I and AIR from baseline were similar among groups.
In terms of insulin resistance, HOMA‐IR decreased significantly in all groups (all P < 0.001 vs baseline), with the greatest improvement of HOMA‐IR observed in the obese group. However, there were no significant differences among groups in the change in HOMA‐IR from baseline.
3.4. Safety
Four serious AEs (SAEs) were reported, namely one case of pancreatitis in the obese group, one case of cerebral infarction and one case of cholangiocellular carcinoma in the overweight group, and one case of left thigh muscle fasciitis in the normal‐weight group. The patient with thigh muscle fasciitis completed the 48‐week intervention, whereas the other three patients withdrew from the study due to the SAEs.
The most commonly observed AEs were gastrointestinal reactions, especially nausea (26.1% overall; Table 3). Until Week 4, more patients (n = 6) in the normal‐weight group experienced nausea than in the other two groups (n = 5 and 3 in the overweight and obese groups, respectively). However, as time progressed, reports of nausea in all groups decreased and were similar among groups (for total events in the three group, see Table 3; P > 0.05 between any two groups). The incidence of AEs among groups did not differ at the end of the study. Treatment‐related AEs leading to study withdrawal occurred in eight patients due to nausea and vomiting (n = 2, 4, and 2 in the normal‐weight, overweight, and obese groups, respectively).
Table 3.
Overview of adverse events and hypoglycemia in the normal‐weight, overweight, and obese groups (intention‐to‐treat population)
| Normal‐weight (n = 34) | Overweight (n = 72) | Obese (n = 36) | Total (n = 142) | |
|---|---|---|---|---|
| Nausea | 13 (38.2) | 14 (19.4.) | 10 (27.8) | 37 (26.1) |
| Vomiting | 5 (14.7) | 4 (5.6) | 6 (16.7) | 15 (10.6) |
| Abdominal distension | 1 (2.9) | 5 (6.9) | 2 (5.6) | 8 (5.6) |
| Decreased appetite | 2 (5.9) | 3 (4.2) | 3 (8.3) | 8 (5.6) |
| Diarrhea | 2 (5.9) | 2 (2.8) | 2 (5.6) | 6 (4.2) |
| URTI | 6 (17.6) | 7 (9.7) | 3 (8.3) | 16 (11.3) |
| Dizziness | 8 (23.5) | 7 (9.7) | 3 (8.3) | 18 (12.7) |
| Constipation | 0 (0) | 4 (5.6) | 2 (5.6) | 6 (4.2) |
| Numbness | 1 (2.9) | 3 (4.2) | 0 (0) | 4 (2.8) |
| Injection site reaction | 0 (0) | 2 (2.8) | 2 (5.6) | 4 (2.8) |
| Palpitations | 1 (2.9) | 2 (2.8) | 1 (2.8) | 4 (2.8) |
| Fatigue | 2 (5.9) | 1 (1.4) | 0 (0) | 3 (2.1) |
| Skelalgia | 1 (2.9) | 2 (2.8) | 0 (0) | 3 (2.1) |
| Toothache | 1 (2.9) | 1 (1.4) | 1 (2.8) | 3 (2.1) |
| Headache | 2 (5.9) | 0 (0) | 1 (2.8) | 3 (2.1) |
| Blurred vision | 0 (0) | 1 (1.4) | 1 (2.8) | 2 (1.4) |
| Chest tightness | 1 (2.9) | 0 (0) | 1 (2.8) | 2 (1.4) |
| Rash | 0 (0) | 0 (0) | 1 (2.8) | 1 (0.7) |
| Hypoglycemia | 4 (11.8) | 6 (8.3) | 3 (8.3) | 13 (9.2) |
Abbreviations: URTI, upper respiratory tract infection.
Data are given as n (%).
No major hypoglycemic episode was reported during the study. Minor hypoglycemia occurred in 13 of 142 patients (9.2%; n = 4 [11.8%] in the normal‐weight group, n = 6 [8.3%] in the overweight group, and n = 3 [8.3%] in the obese group). The dose of exenatide was reduced in six of these patients (two in the normal‐weight group and four in the overweight group). No further hypoglycemia was reported after exenatide dose reduction in these six patients.
4. DISCUSSION
Glucagon‐like peptide‐1 receptor agonists have valid glucose‐lowering efficacy as well as a notable weight‐loss effect. Therefore, they are considered to be beneficial for patients with T2D, especially those who are overweight or obese. However, a recent meta‐analysis showed that the glucose‐lowering efficacy of GLP‐1RAs was greater in patients with a mean BMI <30 kg/m2 than in those with a mean BMI ≥30 kg/m2, which may explain, to some degree, the more obvious effect on glucose control of GLP‐1RAs in Asians than in non‐Asians.20 However, it remains unclear whether the effects of GLP‐1RAs on metabolic abnormities vary in Asian patients with different BMIs. The present ancillary study was conducted to investigate this.
This study demonstrated that glycemic control with exenatide monotherapy was similar among normal‐weight, overweight and obese Chinese patients with newly diagnosed T2D. Normal‐weight patients would benefit from exenatide as much as overweight or obese patients on glucose control with less weight reduction. Our findings are in good agreement with a pooled analysis including 16 randomized controlled trials demonstrating similar efficacy of exenatide treatment between obese and non‐obese patients with T2D,21 except that the patients in that pooled analysis were divided into more BMI groups (≥20 to <25, ≥25 to <30, ≥30 to <35, and ≥35 kg/m2).21 A recent meta‐analysis focusing on Asian patients with T2D also found that patients with and without overweight/obesity can benefit from GLP‐1RAs.22 Another study conducted in obese Korean patients with T2D who were treated with 22‐week exenatide twice daily in combination with both metformin and sulfonylurea also found that baseline body weight and weight reduction during the intervention could not predict the HbA1c reduction in this population, although the median disease duration for patients in that study was 8 years and the median BMI was 30.78 kg/m2.23
In previous studies, the HbA1c reduction was reported to be less than 1% after 6‐12 months exenatide treatment added to metformin and/or sulfonylurea.9, 24, 25, 26 Regarding treatment‐naïve patients, a multicenter study found that HbA1c was reduced by 0.9% by 24‐week exenatide monotherapy in patients with T2D inadequately controlled with diet and exercise alone.27 In another study conducted in antidiabetic drug‐naïve obese Chinese patients with T2D, the HbA1c reduction was −2.10 ± 1.79% after 26 weeks' exenatide treatment.28 In the present study, the mean HbA1c changes from baseline to 48 weeks in newly diagnosed and treatment‐naïve patients was −1.8%. After adjusting for baseline HbA1c, the estimated changes in HbA1c ranged from −1.5% to −1.9% in different BMI groups. A recent post hoc pooled analysis evaluated patients receiving exenatide 10 μg twice daily for 12‐30 weeks and demonstrated that Asian patients exhibited significantly greater reductions in HbA1c and PPG than White patients.29 In all probability, Chinese patients with newly diagnosed T2D may achieve greater HbA1c reduction on exenatide monotherapy than patients in the West, regardless of their baseline BMI. As demonstrated previously, Asian patients with T2D have higher PPG levels than Caucasians.30 And short‐acting GLP‐1RAs like exenatide has a marked effect on lowering PPG that is mediated through delaying gastric empty,31 which may account for the different effects of exenatide on glucose control between Asian and Caucasian patients.30
As expected, weight decreased gradually over the study period in all patients on exenatide treatment. It is of note that the smallest decrease in body weight from baseline was observed in the normal‐weight group, whereas the greatest decrease in body weight was observed in the obese group. Similarly, previous studies demonstrated that patients with higher baseline BMI levels lost more weight after exenatide treatment.21, 32 The same trend was seen with exenatide once weekly.33 In the present study, no patient had a BMI lower than 18.5 kg/m2 after 48‐week exenatide treatment. At the end of the study, the patient with the lowest BMI (19.3 kg/m2) was in the normal weight group, and this patient's baseline BMI was 21.6 kg/m2. These data provide strong evidence to alleviate physicians' concerns regarding the potential for excessive weight loss in normal‐weight patients with T2D treated with exenatide.
In this study, 48‐week exenatide treatment improved β‐cell function in the patients, as evidenced by the amelioration of PI/I (representing β‐cell function during the fasting state) and AIR (representing β‐cell function during the stimulated state after intravenous glucose injection), and this was more obvious in normal‐weight and overweight patients. Non‐significant improvements in PI/I and AIR in obese patients were also observed. The improvement in indices of β‐cell function in this population may be due to the elimination of glycemic toxicity and the positive effect of exenatide on β‐cell function, which has been observed in both animal experiments and clinical trials.34, 35, 36, 37, 38, 39 However, whether exenatide can restore β‐cell function over a long‐term follow‐up in patients with T2D still needs to be confirmed in further studies.
Thirteen patients experienced hypoglycemia confirmed by a blood glucose concentration <3.9 mM. The dose of exenatide was reduced to 5 μg twice daily in six of these patients because of frequent episodes of confirmed hypoglycemia. Notably, no further hypoglycemic episodes were reported after exenatide dose reduction in these patients. In the 24 patients who completed the study on 5 μg exenatide twice daily, 83% and 71% of patients achieved the HbA1c target of <7.0% and ≤6.5%, respectively. The high proportion of patients achieving the HbA1c target on the lower dose of exenatide may indicate that not all the Chinese patients treated with exenatide required a dose of exenatide 10 μg twice daily. A study investigating the population pharmacokinetics of exenatide showed that compared with the peak concentration (Cmax) for the typical 75‐kg subject (Cmax 287 pg/mL), an 18% (Cmax 237 pg/mL) and 34% (Cmax 189 pg/mL) decrease in Cmax is expected with body weights of 100 and 125 kg, respectively.40 Hence, the relatively low body weight of the Chinese population compared with Caucasians may explain, in part, the more obvious effect of low‐dose exenatide in this population. In addition, the non‐significantly higher dose reduction rates in the normal‐weight (29.4%) and overweight (20.8%) groups than in the obese group (11.1%) may also be due to the possible higher Cmax in patients with a relatively lower body weight.
The study design of treating newly diagnosed T2D patients with exenatide monotherapy avoids confounding drug effects and the effects of disease duration on metabolic indices and β‐cell function. In addition, the patients in this study are an Asian population with a relatively lean body mass and reduced β‐cell function,41 so the results of our study provide specific and informative evidence compared with other studies conducted in the West. Yet, as an ancillary study, a limitation of the present study is its small sample size. With the small numbers of hypoglycemia events in different groups, comparison of the incidence of hypoglycemia among groups was not possible. Moreover, it is of clinical importance to identify patients who may achieve optimal clinical outcomes on 5 μg exenatide twice daily without increasing the dose to 10 μg twice daily, but we cannot draw any conclusions from the present study. We cannot exclude the effects of lifestyle modifications on weight reduction and glycemic control. However, the present study focused on differences between the different BMI groups, not only on changes after treatment in the same group. Therefore, we believe that this study provides evidence to doctors who are worried about prescribing GLP‐1RAs in normal‐weight patients.
In conclusion, baseline BMI had no effect on glycemic control, weight change, or other metabolic indices with exenatide monotherapy. Normal‐weight patients with T2D would benefit from exenatide as much as overweight or obese patients on glucose control, without increased risk of excess weight loss.
CONFLICTS OF INTEREST
JW is an advisory board member for Eli Lilly and Co. None of the other authors has any competing interests to declare.
ACKNOWLEDGEMENTS
We acknowledge all the patients and investigators participating in this study.
Deng H, Lin S, Yang X, et al. Effect of baseline body mass index on glycemic control and weight change with exenatide monotherapy in Chinese drug‐naïve type 2 diabetic patients. Journal of Diabetes. 2019;11:509–518. 10.1111/1753-0407.12883
Hongrong Deng and Shuo Lin contributed equally to this work.
Funding information This study was supported by grants from the National Natural Science Foundation of China (81770821 to WX) and National Key R&D Program of China (2016YFC1304801), as well as investigator‐initiated trial research funds from Eli Lilly and Co., Amylin Pharmaceuticals, Inc., and Fundamental Research Funds for the Central Universities (15ykpy25 to WX). The sponsors had no role in the study design, collection, analysis and interpretation of data, or writing of the report.
REFERENCES
- 1. Prevalence of overweight and obesity among adults with diagnosed diabetes ‐ United States, 1988‐1994 and 1999‐2002. MMWR Morb Mortal Wkly Rep. 2004;53:1066‐1068. [PubMed] [Google Scholar]
- 2. Zhou X, Ji L, Ran X, et al. Prevalence of obesity and its influence on achievement of cardiometabolic therapeutic goals in Chinese type 2 diabetes patients: an analysis of the nationwide, cross‐sectional 3B study. PLoS One. 2016;11:e0144179. [DOI] [PMC free article] [PubMed] [Google Scholar]
- 3. Franz MJ, Boucher JL, Rutten‐Ramos S, Vanwormer JJ. Lifestyle weight‐loss intervention outcomes in overweight and obese adults with type 2 diabetes: a systematic review and meta‐analysis of randomized clinical trials. J Acad Nutr Diet. 2015;115:1447‐1463. [DOI] [PubMed] [Google Scholar]
- 4. Garvey WT, Garber AJ, Mechanick JI, et al. American Association of Clinical Endocrinologists and American College of endocrinology position statement on the 2014 advanced framework for a new diagnosis of obesity as a chronic disease. Endocr Pract. 2014;20:977‐989. [DOI] [PMC free article] [PubMed] [Google Scholar]
- 5. Handelsman Y, Bloomgarden ZT, Grunberger G, et al. American Association of Clinical Endocrinologists and American College of Endocrinology ‐ clinical practice guidelines for developing a diabetes mellitus comprehensive care plan ‐ 2015. Endocr Pract. 2015;21(Suppl 1):1‐87. [DOI] [PMC free article] [PubMed] [Google Scholar]
- 6. American Diabetes Association (ADA) . 6. Glycemic targets: standards of medical care in diabetes ‐ 2018. Diabetes Care. 2018;41(suppl 1):S55‐S64. [DOI] [PubMed] [Google Scholar]
- 7. American Diabetes Association (ADA) . 7. Obesity management for the treatment of type 2 diabetes: standards of medical care in diabetes ‐ 2018. Diabetes Care. 2018;41(suppl 1):S65‐S72. [DOI] [PubMed] [Google Scholar]
- 8. Nielsen LL, Young AA, Parkes DG. Pharmacology of exenatide (synthetic exendin‐4): a potential therapeutic for improved glycemic control of type 2 diabetes. Regul Pept. 2004;117:77‐88. [DOI] [PubMed] [Google Scholar]
- 9. DeFronzo RA, Ratner RE, Han J, Kim DD, Fineman MS, Baron AD. Effects of exenatide (exendin‐4) on glycemic control and weight over 30 weeks in metformin‐treated patients with type 2 diabetes. Diabetes Care. 2005;28:1092‐1100. [DOI] [PubMed] [Google Scholar]
- 10. Linnebjerg H, Park S, Kothare PA, et al. Effect of exenatide on gastric emptying and relationship to postprandial glycemia in type 2 diabetes. Regul Pept. 2008;151:123‐129. [DOI] [PubMed] [Google Scholar]
- 11. Drucker DJ, Nauck MA. The incretin system: glucagon‐like peptide‐1 receptor agonists and dipeptidyl peptidase‐4 inhibitors in type 2 diabetes. Lancet. 2006;368:1696‐1705. [DOI] [PubMed] [Google Scholar]
- 12. Liu SC, Tu YK, Chien MN, Chien KL. Effect of antidiabetic agents added to metformin on glycaemic control, hypoglycaemia and weight change in patients with type 2 diabetes: a network meta‐analysis. Diabetes Obes Metab. 2012;14:810‐820. [DOI] [PubMed] [Google Scholar]
- 13. Aroda VR, Henry RR, Han J, et al. Efficacy of GLP‐1 receptor agonists and DPP‐4 inhibitors: meta‐analysis and systematic review. Clin Ther. 2012;34:1247‐1258.e22. [DOI] [PubMed] [Google Scholar]
- 14. Lau DC, Teoh H. Impact of current and emerging glucose‐lowering drugs on body weight in type 2 diabetes. Can J Diabetes. 2015;39(suppl 5):S148‐S154. [DOI] [PubMed] [Google Scholar]
- 15. Davies MJ, D'Alessio DA, Fradkin J, et al. Management of hyperglycaemia in type 2 diabetes, 2018. A consensus report by the American Diabetes Association (ADA) and the European Association for the Study of Diabetes (EASD). Diabetologia. 2018;61:2461‐2498. [DOI] [PubMed] [Google Scholar]
- 16. American Diabetes Association (ADA) . 8. Pharmacologic approaches to glycemic treatment: standards of medical care in diabetes ‐ 2018. Diabetes Care. 2018;41(suppl 1):S73‐S85. [DOI] [PubMed] [Google Scholar]
- 17. Chinese Diabetes Society . Standards of care for type 2 diabetes in China (2017). Chin J Diabetes Mellitus. 2018;10:4‐67. [Google Scholar]
- 18. Zhou BF. Predictive values of body mass index and waist circumference for risk factors of certain related diseases in Chinese adults ‐ study on optimal cut‐off points of body mass index and waist circumference in Chinese adults. Biomed Environ Sci. 2002;15:83‐96. [PubMed] [Google Scholar]
- 19. Xu W, Bi Y, Sun Z, et al. Comparison of the effects on glycaemic control and β‐cell function in newly diagnosed type 2 diabetes patients of treatment with exenatide, insulin or pioglitazone: a multicentre randomized parallel‐group trial (the CONFIDENCE study). J Intern Med. 2015;277:137‐150. [DOI] [PubMed] [Google Scholar]
- 20. Kim YG, Hahn S, Oh TJ, Park KS, Cho YM. Differences in the HbA1c‐lowering efficacy of glucagon‐like peptide‐1 analogues between Asians and non‐Asians: a systematic review and meta‐analysis. Diabetes Obes Metab. 2014;16:900‐909. [DOI] [PubMed] [Google Scholar]
- 21. Pencek R, Blickensderfer A, Li Y, Brunell SC, Anderson PW. Exenatide twice daily: analysis of effectiveness and safety data stratified by age, sex, race, duration of diabetes, and body mass index. Postgrad Med. 2012;124:21‐32. [DOI] [PubMed] [Google Scholar]
- 22. Zhang F, Tang L, Zhang Y, Lü Q, Tong N. Glucagon‐like peptide‐1 mimetics, optimal for Asian type 2 diabetes patients with and without overweight/obesity: meta‐analysis of randomized controlled trials. Sci Rep. 2017;7:15997. [DOI] [PMC free article] [PubMed] [Google Scholar]
- 23. Song SO, Kim KJ, Lee BW, Kang ES, Cha BS, Lee HC. Tolerability, effectiveness and predictive parameters for the therapeutic usefulness of exenatide in obese, Korean patients with type 2 diabetes. J Diabetes Investig. 2014;5:554‐562. [DOI] [PMC free article] [PubMed] [Google Scholar]
- 24. Buse JB, Henry RR, Han J, Kim DD, Fineman MS, Baron AD. Effects of exenatide (exendin‐4) on glycemic control over 30 weeks in sulfonylurea‐treated patients with type 2 diabetes. Diabetes Care. 2004;27:2628‐2635. [DOI] [PubMed] [Google Scholar]
- 25. Kendall DM, Riddle MC, Rosenstock J, et al. Effects of exenatide (exendin‐4) on glycemic control over 30 weeks in patients with type 2 diabetes treated with metformin and a sulfonylurea. Diabetes Care. 2005;28:1083‐1091. [DOI] [PubMed] [Google Scholar]
- 26. Derosa G, Franzetti IG, Querci F, et al. Exenatide plus metformin compared with metformin alone on β‐cell function in patients with type 2 diabetes. Diabet Med. 2012;29:1515‐1523. [DOI] [PubMed] [Google Scholar]
- 27. Moretto TJ, Milton DR, Ridge TD, et al. Efficacy and tolerability of exenatide monotherapy over 24 weeks in antidiabetic drug‐naive patients with type 2 diabetes: a randomized, double‐blind, placebo‐controlled, parallel‐group study. Clin Ther. 2008;30:1448‐1460. [DOI] [PubMed] [Google Scholar]
- 28. Yuan GH, Song WL, Huang YY, Guo XH, Gao Y. Efficacy and tolerability of exenatide monotherapy in obese patients with newly diagnosed type 2 diabetes: a randomized, 26 weeks metformin‐controlled, parallel‐group study. Chin Med J (Engl). 2012;125:2677‐2681. [PubMed] [Google Scholar]
- 29. Sheu WH, Brunell SC, Blase E. Efficacy and tolerability of exenatide twice daily and exenatide once weekly in Asian vs White patients with type 2 diabetes mellitus: a pooled analysis. Diabetes Res Clin Pract. 2016;114:160‐172. [DOI] [PubMed] [Google Scholar]
- 30. Herman WH, Dungan KM, Wolffenbuttel BH, et al. Racial and ethnic differences in mean plasma glucose, hemoglobin A1c, and 1,5‐anhydroglucitol in over 2000 patients with type 2 diabetes. J Clin Endocrinol Metab. 2009;94:1689‐1694. [DOI] [PubMed] [Google Scholar]
- 31. Meier JJ. GLP‐1 receptor agonists for individualized treatment of type 2 diabetes mellitus. Nat Rev Endocrinol. 2012;8:728‐742. [DOI] [PubMed] [Google Scholar]
- 32. Buysschaert M, Preumont V, Oriot PR, et al. One‐year metabolic outcomes in patients with type 2 diabetes treated with exenatide in routine practice. Diabetes Metab. 2010;36:381‐388. [DOI] [PubMed] [Google Scholar]
- 33. Buse JB, Nauck M, Forst T, et al. Exenatide once weekly vs liraglutide once daily in patients with type 2 diabetes (DURATION‐6): a randomised, open‐label study. Lancet. 2013;381:117‐124. [DOI] [PubMed] [Google Scholar]
- 34. Stoffers DA, Kieffer TJ, Hussain MA, et al. Insulinotropic glucagon‐like peptide 1 agonists stimulate expression of homeodomain protein IDX‐1 and increase islet size in mouse pancreas. Diabetes. 2000;49:741‐748. [DOI] [PubMed] [Google Scholar]
- 35. Stoffers DA, Desai BM, Deleon DD, Simmons RA. Neonatal exendin‐4 prevents the development of diabetes in the intrauterine growth retarded rat. Diabetes. 2003;52:734‐740. [DOI] [PubMed] [Google Scholar]
- 36. Rolin B, Larsen MO, Gotfredsen CF, et al. The long‐acting GLP‐1 derivative NN2211 ameliorates glycemia and increases beta‐cell mass in diabetic mice. Am J Physiol Endocrinol Metab. 2002;283:E745‐E752. [DOI] [PubMed] [Google Scholar]
- 37. Wang Q, Brubaker PL. Glucagon‐like peptide‐1 treatment delays the onset of diabetes in 8 week‐old db/db mice. Diabetologia. 2002;45:1263‐1273. [DOI] [PubMed] [Google Scholar]
- 38. Bhavsar S, Mudaliar S, Cherrington A. Evolution of exenatide as a diabetes therapeutic. Curr Diabetes Rev. 2013;9:161‐193. [DOI] [PMC free article] [PubMed] [Google Scholar]
- 39. Bunck MC, Cornér A, Eliasson B, et al. Effects of exenatide on measures of β‐cell function after 3 years in metformin‐treated patients with type 2 diabetes. Diabetes Care. 2011;34:2041‐2047. [DOI] [PMC free article] [PubMed] [Google Scholar]
- 40. Cirincione B, Mager DE. Population pharmacokinetics of exenatide. Br J Clin Pharmacol. 2017;83:517‐526. [DOI] [PMC free article] [PubMed] [Google Scholar]
- 41. Yabe D, Seino Y, Fukushima M, Seino S. β Cell dysfunction vs insulin resistance in the pathogenesis of type 2 diabetes in East Asians. Curr Diab Rep. 2015;15:602. [DOI] [PMC free article] [PubMed] [Google Scholar]