Abstract
Purpose
Each year in the United States, approximately 18.5 million nuclear medicine procedures are performed. Various quality control measures are implemented to reduce image errors and improve quantification of radiotracer distribution. However, there is currently no routine or timely feedback about the quality of the radiotracer injection. One potential solution to evaluate the injection quality is to place a topical scintillation sensor near the injection site to record the presence of residual activity. This work investigates a sensor design for identification of injections where the prescribed radioactive activity is not fully delivered into the patient's circulation (an infiltration).
Methods
The sensor consists of a single unshielded bismuth germanate (BGO) crystal (3 mm × 3 mm × 3 mm). Using radioactive sources with gamma energies that span the range commonly used in nuclear medicine, we quantified energy resolution and linearity. Additionally, we computed sensitivity by comparing the calculated incident activity to the activity measured by the sensor. Sensor output linearity was calculated by comparing measured data against the radioactive decay of a source over multiple half‐lives. The sensor incorporates internal temperature feedback used to compensate for ambient temperature fluctuations. We investigated the performance of this compensation over the range of 15°C–35°C.
Results
Energy spectra from four sensors were used to calculate the energy resolution: 67% for 99mTc (141 keV), 67% for 133Ba (344 keV), 42% for 18F (511 keV), and 32% for 137Cs (662 keV). Note that the energy used for 133Ba is a weighted average of the three photon emissions nearest to the most abundant (356 keV). Sensor energy response was linear with a difference of 1%–2% between measured and predicted values. Energy‐dependent detector sensitivity, defined as the ratio of measured photons to incident photons for a given isotope, decreased with increasing photon energy from 55.4% for 99mTc (141 keV) to 3.3% for 137Cs (662 keV). Without compensation, error due to temperature change was as high as 53%. Temperature compensation reduced the error to less than 1.4%. Sensor output linearity was tested to as high as 210 kcps and the maximum magnitude error was 4%.
Conclusions
The performance of the sensor was adequate for identification of excessive residual activity at an injection site. Its ability to provide feedback may be useful as a quality control measure for nuclear medicine injections.
Keywords: infiltration, quality control, quantitative
1. Introduction
Positron emission tomography/computed tomography (PET/CT) data are commonly used for quantitative or semi‐quantitative analyses (e.g., standardized uptake value, PERCIST, and RECIST assessments).1, 2, 3 Furthermore, quantitative single photon emission tomography (SPECT) is gaining popularity. The accuracy of quantitative imaging is assured by processes including clock synchronization, residual syringe activity subtraction, patient weight measurement, and patient blood glucose measurement.4, 5, 6, 7, 8, 9 Inaccuracies can introduce image errors that negatively affect disease staging,1, 10, 11, 12, 13, 14, 15, 16, 17, 18, 19, 20, 21, 22, 23, 24, 25, 26, 27, 28, 29 interpretation of longitudinal disease progression,10, 12, 13, 14, 15, 30, 31, 32, 33, 34, 35, 36, 37, 38, 39, 40, 41, 42, 43 tumor volume measurements,44 myocardial perfusion measurements,1, 31, 45, 46 and neurological assessments.47, 48
However, there is no routine quality control (QC) process for the radiotracer injection itself. During the intravenous access or injection, radiotracer can be inadvertently deposited into the tissue surrounding the vein.49 This is known as an infiltration and can affect the net activity available for circulation or alter the kinetics of availability.10, 26, 29, 42, 43
A potential method of injection QC would be to position a topical scintillation sensor proximal to the injection site (Fig. 1). Scintillation sensors consist of one or more scintillating crystals, light sensors, amplification circuits, energy thresholding circuits, and counting circuitry. When gamma rays interact with the scintillator, light proportional to the absorbed energy is produced. The light sensor then produces electrical pulses whose heights are proportional to the deposited energy. A pulse‐height discriminator is used to reject low‐level pulses resulting from scattered radiation. The remaining pulses are then counted to produce a sensor output in counts per second (cps). For this proposed clinical use, the sensor, along with a second sensor placed on the contralateral arm to collect reference data, could identify the presence of excessive residual radiotracer near the injection site.50, 51 Both sensors would then be removed prior to imaging.
Figure 1.
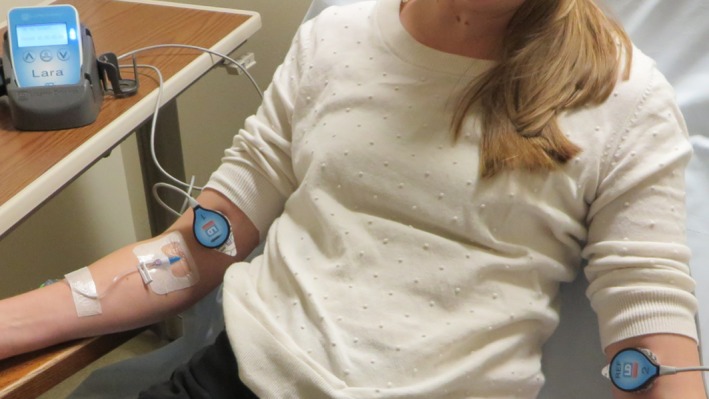
Detectors in use on a patient. Placement is proximal to the injection site.
Based on the sensor design, it may not be possible to provide absolute quantification of the radiotracer near the injection site, but a semi‐quantitative assessment would still be valuable. The goal of this work was to characterize the performance of a topical scintillation sensor for identification of excessive residual activity at the injection site.
2. Materials and methods
We used an uncollimated, unshielded scintillation sensor (Lara®, Lucerno Dynamics, Cary, NC, USA) with a single 3 mm × 3 mm × 3 mm bismuth germanate (BGO) crystal mated to a silicon photomultiplier (SiPM). The SiPM output is amplified and then discriminated using a single lower level discriminator (LLD). Pulses are counted using a microprocessor‐based asynchronous counter. The design also includes real‐time temperature compensation. Temperature is measured adjacent to the SiPM and crystal, and is used to compensate SiPM bias voltage for fluctuations in temperature. The sensors must be lightweight because they are applied topically with adhesive pads — it is not practical to include significant shielding.
The design of this sensor impacts its performance characteristics. The characteristics we tested were energy resolution, energy linearity, energy‐dependent output sensitivity, temperature sensitivity, and output linearity to determine the device's suitability for its intended clinical function. Sources of 99mTc, 133Ba, 18F, and 137Cs were used to test the range of energies encountered clinically in nuclear medicine. All sensors used in this testing were calibrated using 137Cs.
2.A. Energy resolution
Characterization of the energy resolution is important for setting the pulse‐height discriminator value. We first determined an appropriate step size for energy spectrum analysis. The standard error for full‐width at half‐maximum (FWHM) of a gaussian fit for a 1 keV step size and 10 keV step size was less than 1%. Thus, we used a 10 keV step size to reduce acquisition time. We then measured the energy spectrum for each isotope using four sensors. The sensor design incorporates an LLD but no upper level energy discriminator (ULD). The energy spectrum was measured iteratively over the range of 0–900 keV by adjusting the LLD value. We averaged the output counts from five 1‐s measurements at each step. Without a ULD, the output is an integration of all energies above the threshold, so the resulting iterative spectrum must be differentiated to obtain units of cps/keV. Energy resolution was calculated using the FWHM/E0 method. Gaussian curves were fit to the average spectrum for each measured isotope using segments of data centered around the measured photopeak: E0 ± 20% for 99mTc and 133Ba; E0 ± 15% for 18F and 137Cs. These gaussian fits were used to calculate the FWHM values. Energy discrimination thresholds for each isotope were then determined and set for the remainder of testing.
2.B. Energy linearity
Knowledge of energy linearity and resolution can be used to determine LLD values for any isotope within the operating range. Using data collected during energy resolution testing, we calculated energy linearity by comparing the center of each gaussian fit to the known photon energy. The differences between calculated and expected values were used to assess performance.
2.C. Sensitivity
Sensitivity with respect to different isotopes is important to anticipate sensor response in clinical applications. Because detector output is dependent on distance to the source, we defined energy sensitivity as the sensor output divided by the calculated number of gamma rays incident upon its crystal. Note that this is unlike sensitivity reported for imaging scanners, but we feel it is appropriate given the design of this detector. To control distance and geometry during testing, we constructed custom fixtures to hold samples of known activity from either standard 1” sealed check sources or single drops of liquid isotope. Sealed source disks were positioned 12.3 mm away from the scintillation crystal and liquid sources were 13.5 mm away. We then calculated the gamma rays from the source that would fall within the solid angle created by the crystal's face in relation to the source. Samples of 137Cs and 133Ba consisted of nominally 10 uCi sealed source disks while liquid drops were used for 99mTc (277 uCi) and 18F (40 uCi). All test sources were accurately measured with a well counter. Data consisted of an average of 90 1‐s measurements using five devices.
2.D. Temperature sensitivity
Several components of the design are sensitive to temperature including the crystal and SiPM.52, 53 We assessed overall temperature sensitivity with the use of a temperature chamber and isotope samples. Sources consisted of nominally 10 uCi sealed source disks for 137Cs and 133Ba and liquid sources of 99mTc (277 uCi) and 18F (40 uCi). Each isotope was measured by five sensors using a 1‐s sample rate while ambient temperature was increased from 15°C to 35°C over 15 min. We compared the relationship between sensor output in cps and sensor‐reported temperature. We calculated percent error as a function of the sensor output at 25°C because it is the null‐correction point in the temperature compensation system. Additionally, we calculated the interdevice measurement variation for each isotope with and without temperature compensation.
2.E. Output linearity
For output linearity, we measured a 4.5 mCi source of 99mTc and an 11.1 mCi source of 18F as they decayed over multiple half‐lives. We compared the sensor output to known half‐life and calculated the error between the two. Based on existing clinical use of these sensors, we know 18F injections typically produce 10's of kcps while 99mTc injections can produce 200 kcps or more. We recorded linearity data up to 210 kcps.
2.F. Detector saturation
Separately, we assessed detector saturation by recording measurements at the maximum sensor output of 250 kcps.
3. Results
3.A. Energy resolution and linearity
Energy resolution results are shown in Table 1 and Fig. 2. Using energy spectra from four sensors, the average values of FWHM/E0 were 67% for 99mTc, 67% for 133Ba, 42% for 18F, and 32% for 137Cs. The results of testing for energy linearity are shown in Fig. 3.
Table 1.
Photon energy, location of Gaussian fit, and calculated energy resolution
| Isotope | Photon energy (keV) | Gaussian fit center (keV) | FWHM/E0 ± SD |
|---|---|---|---|
| 99mTc | 141 | 142 ± 1.3 | 67% ± 1.3% |
| 133Ba | 344 | 340 ± 1.9 | 67% ± 2.6% |
| 18F | 511 | 515 ± 4.4 | 42% ± 3.2% |
| 137Cs | 662 | 666 ± 5.6 | 32% ± 4.2% |
Note that the photon energy used for 133Ba is a weighted average of the three photon emissions near the most abundant (356 keV).
Figure 2.
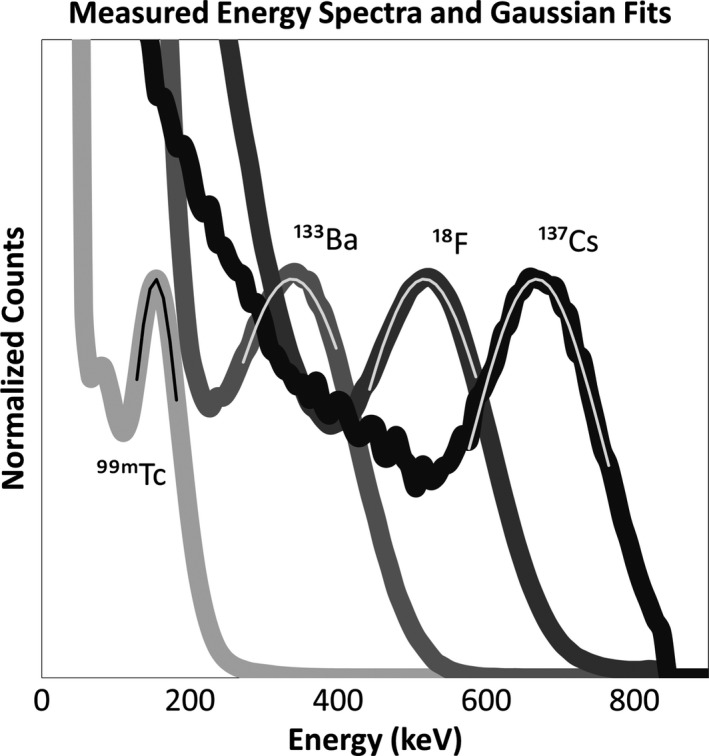
Average measured energy spectra with fit Gaussian curves superimposed.
Figure 3.
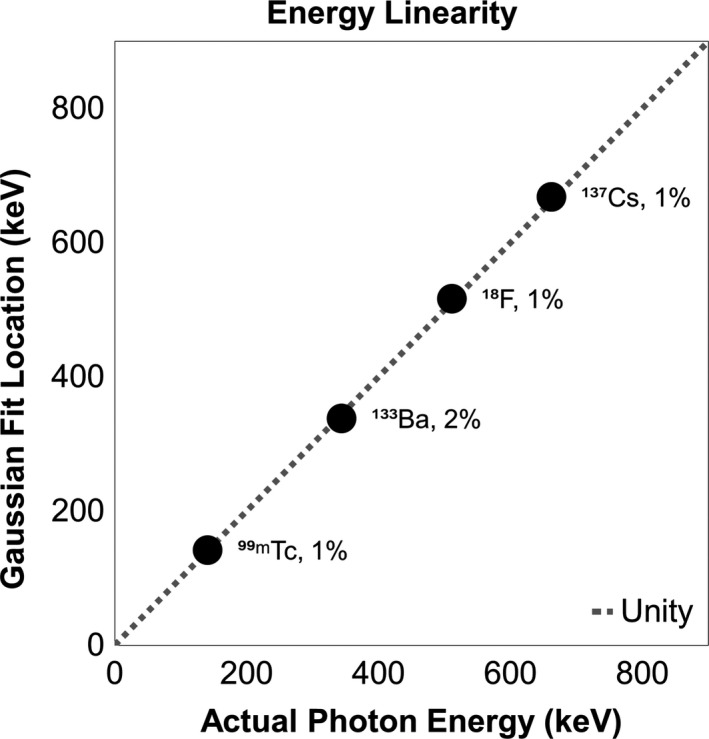
Linearity between photon energy and location of Gaussian curves fit to average measured data. Line of unity is included as a reference along with each point's distance from unity.
3.B. Sensitivity
The average energy sensitivities can be found in Table 2. As expected, sensitivity decreases with increasing photon energy due to reduced stopping power of the scintillation crystal.
Table 2.
Sensitivity of isotopes
| Isotope | Calculated incident gammas per second | Detector output (cps) | Average sensitivity ± SD |
|---|---|---|---|
| 99mTc | 40,276 | 22,325 | 55.4% ± 3.1% |
| 133Ba | 1,244 | 308 | 24.8% ± 0.7% |
| 18F | 11,267 | 396 | 3.5% ± 0.1% |
| 137Cs | 1,649 | 55 | 3.3% ± 0.6% |
Sources of 99mTc and 18F were liquid and positioned 13.5 mm away from the scintillation crystal. Sources of 133Ba and 137Cs were sealed source disks and located 12.3 mm away from the crystal.
3.C. Temperature sensitivity
The average bias in sensor output as a function of temperature without compensation is shown in Fig. 4. Maximum uncompensated error was −53% (18F at 35°C). Measurements taken with compensation indicated the following maximum magnitude percent errors: 0.47% for 99mTc, 0.63% for 133Ba, 1.41% for 18F, and 0.93% for 137Cs (Fig. 5). Note that error is relative to 25°C because that is the null‐compensation point in the sensor hardware.
Figure 4.
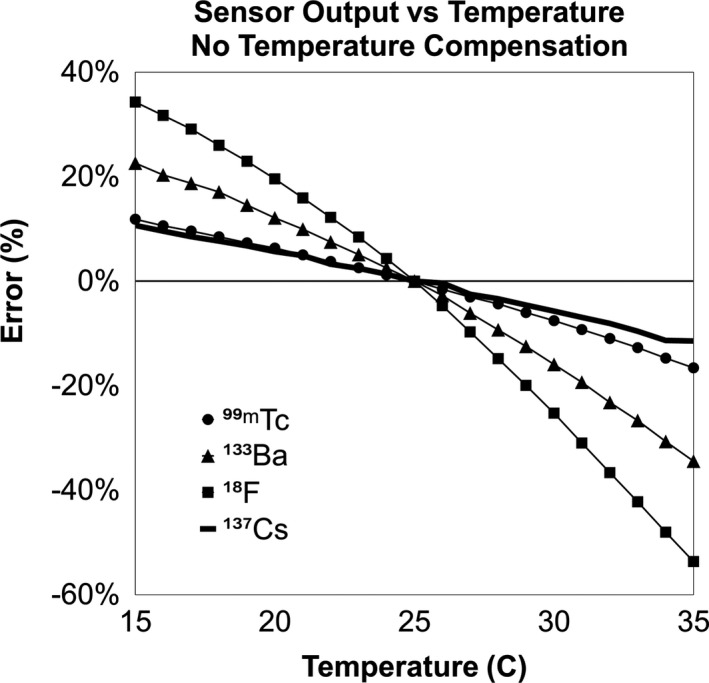
Sensor output vs temperature without compensation enabled as a percent of the value at 25°C.
Figure 5.
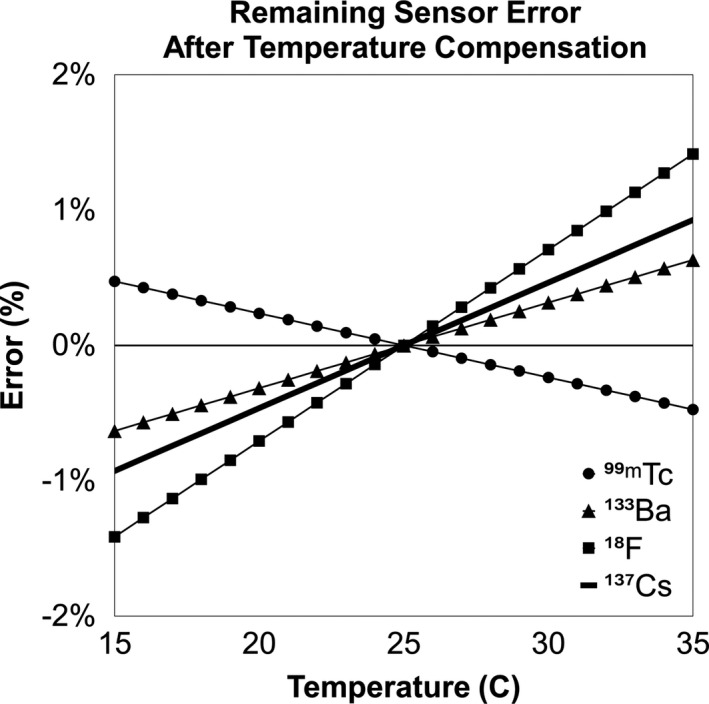
Sensor output vs temperature with compensation enabled as a percent of the value at 25°C.
Temperature compensation had little effect on interdevice measurement variation (Table 3).
Table 3.
Comparison of the impact of temperature compensation on measurement variation
| Isotope | Interdevice variation without compensation ± SD | Interdevice variation with compensation ± SD |
|---|---|---|
| 99mTc | 3.59% ± 0.17% | 3.50% ± 0.14% |
| 133Ba | 3.47% ± 0.17% | 3.52% ± 0.17% |
| 18F | 4.17% ± 0.48% | 3.41% ± 0.09% |
| 137Cs | 3.29% ± 0.18% | 3.33% ± 0.19% |
Average interdevice output variation is shown for each isotope over the temperature range of 15°C–35°C with and without temperature compensation enabled.
3.D. Output linearity
During linearity testing, sensor output ranged from approximately 210 kcps to 10 cps with 99mTc. Due to the sensor's lower sensitivity for 18F, its range was from 80 kcps to 10 cps. Performance was evaluated by comparing the output to the known half‐life for each isotope (Fig. 6). The overall error span was approximately 4% for 99mTc and 1.5% for 18F.
Figure 6.
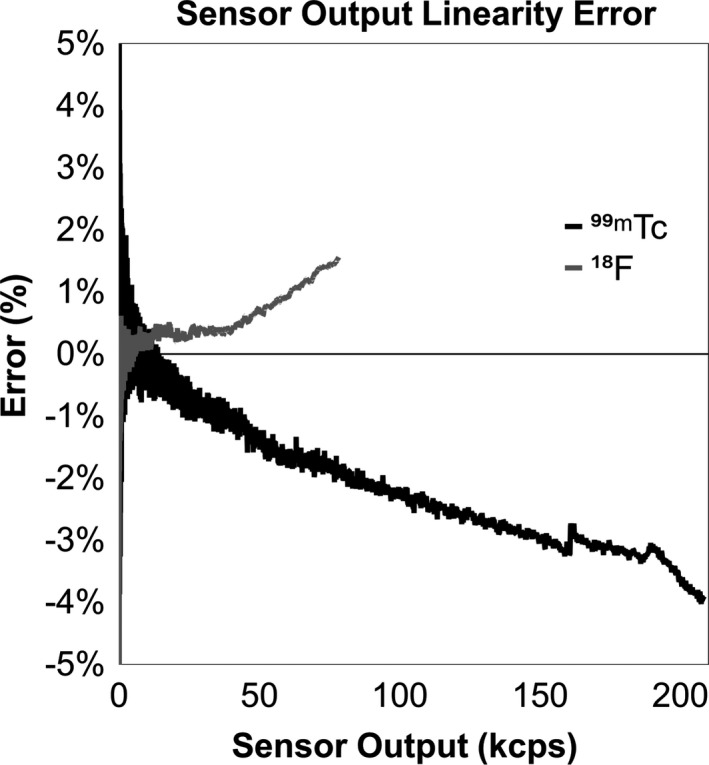
Percent error of measured data vs expected from 0 to 210 kcps for 99mTc and 0 to 80 kcps for 18F.
3.E. Detector saturation
Measurements were taken up to 250 kcps with no indication of detector saturation. The sensor software limits output to 250 kcps.
4. Discussion
Several compromises were made in the design of the investigated sensor in order to support its intended topical application. The use of a single unshielded crystal means that the sensor response is omnidirectional — an advantage for detection of radiotracer with variable and unknown morphology. BGO was chosen for the scintillation crystal because of its high stopping power, high light yield, and nonhygroscopic properties. Its longer optical decay time is not a concern because the sensor is not using coincidence timing to localize positron annihilation; however, it does limit the sensor's maximum count rate and could increase nonlinearity due to pile‐up. Although BGO has advantages, energy resolution and sensitivity are limited by the small crystal size used in this design.
Compared to photomultiplier tubes, SiPMs are advantageous for light detection because of their small size, mechanical robustness, and low bias voltage requirements; however, they exhibit sensitivity to temperature52, 54, 55 which must be accounted for in the design. In clinical applications, sensor temperature can vary due to ambient room conditions, patient body temperature, and use of heated blankets for patient comfort. We found temperature‐induced error without compensation to be as high as 53%, but by using real‐time bias voltage compensation, error was reduced to less than 2%.
Due to the design of this sensor, energy resolution is limited compared to other gamma scintillation detectors.56, 57, 58 Lower resolution is acceptable for the intended application because there is no need to differentiate isotopes based on photon energy. Nonetheless, interdevice energy response was shown to be consistent — photo peak location variability was less than 1% (Table 1). Knowledge of the energy resolution would be necessary if a dual‐threshold energy window were used as opposed to just a single threshold LLD.
The sensors showed strong energy linearity with 1%–2% differences between measured and expected values. This degree of consistency allows standardized LLD values despite variability in the crystal or other hardware. Additionally, it allows for calibration using long‐lived 137Cs sources.
The sensitivity for 99mTc was 16 times that of 18F. Based on clinical use of this sensor, we know it is common for sensor output to reach 20 kcps for 18F during the bolus injection. For the same injection with 99mTc, the rate could be 320 kcps, but the detector software limits output to 250 kcps. Based on the linearity testing done in this work, nonlinearity was within the range expected for pile‐up‐based effects.59
We did not expect the sensor to exhibit positive nonlinearity for 18F, but the results were consistent and repeatable. We hypothesize the phenomenon could be due to the single‐ended LLD configuration of this design. It is possible that as pulses pile up, those which would normally fall above the upper level discriminator are instead counted causing an increase in output. Further investigation could be done, but clinical use demonstrates typical postbolus output is approximately 25 cps/mCi of injected activity for 18F and approximately 85 cps/mCi for 99mTc. At these levels, pile‐up will not be an issue.
The design with a single crystal makes it difficult to quantify the exact amount of radiotracer present near the injection site, but future work could use measured sensitivity and estimates of geometry to perform some quantification. Radioactivity elsewhere in the body is a source of noise when measuring the injection and reference arms. For this reason, the net difference in counts between the two arms is likely better than the injection arm alone. Furthermore, addition of shielding to the sensor could be a mechanism to improve the signal‐to‐noise ratio. A collimated shield could create a focused field of view that would allow for measurement of specific targets within the patient.
5. Conclusion
Nuclear medicine clinicians currently have no effective, routine, and timely feedback about the quality of radiotracer injections. Use of a topical scintillation sensor near the injection site could provide dynamic feedback about the injection quality during the uptake period without dependence on the nuclear medicine image or its field of view. We confirmed the sensor's performance is adequate for its intended function: providing feedback about the presence of residual activity at the injection site. Since infiltrated activity can dynamically alter the systemic availability of radiotracer throughout the uptake time, due to sequestration and reabsorption, this feedback could inform image interpretation and patient management.
Disclosures
All authors of this paper are employed by Lucerno Dynamics, the manufacturer of the Lara® device.
Acknowledgments
The authors would like to acknowledge the guidance of Dr. Osama Mawlawi in the preparation and editing of this manuscript.
References
- 1. Schaefferkoetter JD, Osman M, Townsend DW. The importance of quality control for clinical PET imaging. J Nucl Med Technol. 2017;45:265–266. [DOI] [PubMed] [Google Scholar]
- 2. Hyun J, Lodge MA, Wahl RL. Practical PERCIST: a simplified guide to PET response criteria in solid tumors 1.0. Radiology. 2016;280:576–584. [DOI] [PMC free article] [PubMed] [Google Scholar]
- 3. Wahl RL, Jacene H, Kasamon Y, Lodge MA. From RECIST to PERCIST: evolving considerations for PET response criteria in solid tumors. J Nucl Med. 2009;50(Suppl 1):122S–150S. [DOI] [PMC free article] [PubMed] [Google Scholar]
- 4. U.S. Department of Health and Human Services . Clinical trial imaging endpoint process standards guidance for industry. 2015; Revision 1:https://www.fda.gov/downloads/drugs/guidances/ucm268555.pdf.
- 5. Union CotE . Council Directive 97/43/EURATOM on health protection of individuals against the dangers of ionizing radiation in relation to medical exposure. In. Official Journal of the European Communities 1997.
- 6. Hristova I, Boellaard R, Galette P, et al. Guidelines for quality control of PET/CT scans in a multicenter clinical study. EJNMMI Phys. 2017;4:23. [DOI] [PMC free article] [PubMed] [Google Scholar]
- 7. Commission IA . The IAC Standards and Guidelines for Nuclear/PET Accreditation. 2016.
- 8. Network ACoRI . Manual of procedures part D: PET‐PET/CT technical procedures. 2013; https://www.acrin.org/Portals/0/Corelabs/CQIE%20Material/CQIE%20MOP%20Part%20D-PET_v3.2.pdf. Accessed March 23, 2018.
- 9. Graham MM, Wahl RL, Hoffman JM, et al. Summary of the UPICT protocol for 18F‐FDG PET/CT imaging in oncology clinical trials. J Nucl Med. 2015;56:955–961. [DOI] [PMC free article] [PubMed] [Google Scholar]
- 10. Bennett PA, Mintz A, Perry B, Trout A, Vergara‐Wentland P. Specialty Imaging: PET Positron Emission Tomography With Correlative CT and MR (vol 1). Amsterdam, the Netherlands: Elsevier; 2018. [Google Scholar]
- 11. Kiser JW, Crowley JR, Wyatt DA, Lattanze RK. Impact of an 18F‐FDG PET/CT radiotracer injection infiltration on patient management – a case report. Frontiers in Medicine. 2018;5:143. [DOI] [PMC free article] [PubMed] [Google Scholar]
- 12. van der Pol J, Voo S, Bucerius J, Mottaghy FM. Consequences of radiopharmaceutical extravasation and therapeutic interventions: a systematic review. Eur J Nucl Med Mol Imaging. 2017;44:1234–1243. [DOI] [PMC free article] [PubMed] [Google Scholar]
- 13. Sonoda LI, Ghosh‐Ray S, Sanghera B, Dickson J, Wong WL. FDG injection site extravasation: potential pitfall of misinterpretation and missing metastases. Clin Nucl Med. 2012;37:1115–1116. [DOI] [PubMed] [Google Scholar]
- 14. Chiang SB, Rebenstock A, Guan L, Burns J, Alavi A, Zhuang H. Potential false‐positive FDG PET imaging caused by subcutaneous radiotracer infiltration. Clin Nucl Med. 2003;28:786–788. [DOI] [PubMed] [Google Scholar]
- 15. Liu Y. Fluorodeoxyglucose uptake in absence of CT abnormality on PET‐CT: what is it? World J Radiol. 2013;5:460–467. [DOI] [PMC free article] [PubMed] [Google Scholar]
- 16. Long NM, Smith CS. Causes and imaging features of false positives and false negatives on (18)F‐PET/CT in oncologic imaging. Insights Imaging. 2011;2:679–698. [DOI] [PMC free article] [PubMed] [Google Scholar]
- 17. Manohar K, Agrawal K, Bhattacharya A, Mittal BR. New axillary lymph nodal F‐18 fluoro‐deoxy glucose uptake in an interim positron emission tomography scan – not always a sign of disease progression. Indian J Nucl Med. 2011;26:192–193. [DOI] [PMC free article] [PubMed] [Google Scholar]
- 18. Peller PJ, Ho VB, Kransdorf MJ. Extraosseous Tc‐99m MDP uptake: a pathophysiologic approach. Radiographics. 1993;13:715–734. [DOI] [PubMed] [Google Scholar]
- 19. Penney HF, Styles CB. Fortuitous lymph node visualization after interstitial injection of Tc‐99m‐MDP. Clin Nucl Med. 1982;7:84–85. [DOI] [PubMed] [Google Scholar]
- 20. Pitman AG, Binns DS, Ciavarella F, Hicks RJ. Inadvertent 2‐deoxy‐2‐[18F]fluoro‐D‐glucose lymphoscintigraphy: a potential pitfall characterized by hybrid PET‐CT. Mol Imaging Biol. 2002;4:276–278. [DOI] [PubMed] [Google Scholar]
- 21. Shih W‐J, Collins J, Kiefer V. Visualization in the ipsilateral lymph nodes secondary to extravasation of a bone‐imaging agent in the left hand: a case report. J Nucl Med Technol. 2001;29:154–155. [PubMed] [Google Scholar]
- 22. Shih W‐J, Han J‐K, Coupal J, Wierzbinski B, Magoun S, Gross K. Axillary lymph node uptake of Tc‐99m MIBI resulting from extravasation should not be misinterpreted as metastasis. Ann Nucl Med. 1999;13:269–271. [DOI] [PubMed] [Google Scholar]
- 23. Shih W‐J, Wierzbinski B, Magoun S. Lymph node visualization in the elbow region. J Nucl Med. 1996;37:1913. [PubMed] [Google Scholar]
- 24. Slavin JD Jr, Jung WK, Spencer RP. False‐positive renal study with Tc‐99m DTPA caused by infiltration of dose. Clin Nucl Med. 1996;21:978–980. [DOI] [PubMed] [Google Scholar]
- 25. Stauss J, Treves ST, Connolly LP. Lymphatic Tc‐99m DMSA localization after partial‐dose extravasation. Clin Nucl Med. 2003;28:618–619. [DOI] [PubMed] [Google Scholar]
- 26. Vallabhajosula S, Killeen RP, Osborne JR. Altered biodistribution of radiopharmaceuticals: role of radiochemical/pharmaceutical purity, physiological, and pharmacologic factors. Semin Nucl Med. 2010;40:220–241. [DOI] [PubMed] [Google Scholar]
- 27. Vieras F. Serendipitous lymph node visualization during bone imaging. Clin Nucl Med. 1986;11:434. [DOI] [PubMed] [Google Scholar]
- 28. Wagner T, Brucher N, Julian A, Hitzel A. A false‐positive finding in therapeutic evaluation: hypermetabolic axillary lymph node in a lymphoma patient following FDG extravasation. Nucl Med Rev Cent East Eur. 2011;14:109–111. [DOI] [PubMed] [Google Scholar]
- 29. Wallis JW, Fisher S, Wahl RL. 99Tcm‐MDP uptake by lymph nodes following tracer infiltration: clinical and laboratory evaluation. Nucl Med Commun. 1987;8:357–363. [DOI] [PubMed] [Google Scholar]
- 30. Hall N, Zhang J, Reid R, Hurley D, Knopp M. Impact of FDG extravasation on SUV measurements in clinical PET/CT. Should we routinely scan the injection site? J Nucl Med. 2006;47(suppl 1):115P. [Google Scholar]
- 31. Burrell S, MacDonald A. Artifacts and pitfalls in myocardial perfusion imaging. J Nucl Med Technol. 2006;34:193–211; quiz 212‐194. [PubMed] [Google Scholar]
- 32. Boellaard R. Standards for PET image acquisition and quantitative data analysis. J Nucl Med. 2009;50(Suppl 1):11S–20S. [DOI] [PubMed] [Google Scholar]
- 33. Bunyaviroch T, Coleman RE. PET evaluation of lung cancer. J Nucl Med. 2006;47:451–469. [PubMed] [Google Scholar]
- 34. Fernolendt H, Bundschuh R, Winter A, Scheidhauer K, Schwaiger M. Paravenous activity in PET/CT – Influence on SUV and correction. J Nucl Med. 2008;49(Suppl 1):416P. [Google Scholar]
- 35. Ghesani M, Ghesani N, DePuey EG, Kashefi A, Zhang YC. Nuclear Medicine: A Case‐Based Approach (1st ed.). New Delhi, India: Jaypee Brothers Medical Publishers ; 2016. [Google Scholar]
- 36. Agency IAE . IAEA human health series No. 27. PET/CT atlas on quality control and image artefacts. 2014; No. 27:https://www.iaea.org/publications.
- 37. Kelly M. SUV: advancing comparability and accuracy. [White Paper.]. 2009; https://www.mpcphysics.com/documents/SUV_Whitepaper_Final_11.17.09_59807428_2.pdf.
- 38. Lee JJ, Chung JH, Kim S‐Y. Effect of extravasation on optimal timing of oncologic FDG PET. J Nucl Med. 2016;57(Suppl. 2):1413.27081168 [Google Scholar]
- 39. Lee JJ, Chung JH, Kim S‐Y. Effect of (18)F‐fluorodeoxyglucose extravasation on time taken for tumoral uptake to reach a plateau: animal and clinical PET analyses. Ann Nucl Med. 2016;30:525–533. [DOI] [PubMed] [Google Scholar]
- 40. Teymouri C, Botkin C, Osman M. FDG dose extravasation in PET/CT: frequency and impact on SUV measurements. J Nucl Med. 2007;48(Suppl. 2):475P. [Google Scholar]
- 41. Weber WA. Use of PET for monitoring cancer therapy and for predicting outcome. J Nucl Med. 2005;46:983–995. [PubMed] [Google Scholar]
- 42. Ozdemir E, Poyraz NY, Keskin M, Kandemir Z, Turkolmez S. Hot‐clot artifacts in the lung parenchyma on F‐18 fluorodeoxyglucose positron emission tomography/CT due to faulty injection techniques: two case reports. Korean J Radiol. 2014;15:530–533. [DOI] [PMC free article] [PubMed] [Google Scholar]
- 43. Bogsrud TV, Lowe VJ. Normal variants and pitfalls in whole‐body PET imaging with 18F FDG. Appl Radiol. 2006;35:16–30. [Google Scholar]
- 44. Agency IAE . The Role of PET/CT in radiation treatment planning for cancer patient treatment. 2008; https://www-pub.iaea.org/books/iaeabooks/8016/The-Role-of-PET-CT-in-Radiation-Treatment-Planning-for-Cancer-Patient-Treatment.
- 45. Erthal L, Erthal F, Beanlands RSB, Ruddy TD, deKemp RA, Dwivedi G. False‐positive stress PET‐CT imaging in a patient with interstitial injection. J Nucl Cardiol. 2017;24:1447–1450. [DOI] [PubMed] [Google Scholar]
- 46. Murthy VL, Bateman TM, Beanlands RS, et al. Clinical quantification of myocardial blood flow using PET: joint position paper of the SNMMI cardiovascular council and the ASNC. J Nucl Cardiol. 2018;25:269–297. [DOI] [PubMed] [Google Scholar]
- 47. Waxman AD, Herholz K, Lewis DH, et al. Society of nuclear medicine procedure guideline for FDG PET brain imaging. 2009.
- 48. Minoshima S, Drzezga AE, Barthel H, et al. SNMMI procedure standard/EANM practice guideline for amyloid PET imaging of the brain 1.0. J Nucl Med. 2016;57:1316–1322. [DOI] [PubMed] [Google Scholar]
- 49. Helm RE, Klausner JD, Klemperer JD, Flint LM, Huang E. Accepted but unacceptable: peripheral IV catheter failure. J Infus Nurs. 2015;38:189–203. [DOI] [PubMed] [Google Scholar]
- 50. Muzaffar R, Frye SA, McMunn A, Ryan K, Lattanze R, Osman MM. Novel method to detect and characterize (18)F‐FDG infiltration at the injection site: a single‐institution experience. J Nucl Med Technol. 2017;45:267–271. [DOI] [PubMed] [Google Scholar]
- 51. Williams JM, Arlinghaus LR, Rani SD, et al. Towards real‐time topical detection and characterization of FDG dose infiltration prior to PET imaging. Eur J Nucl Med Mol Imaging. 2016;43:2374–2380. [DOI] [PMC free article] [PubMed] [Google Scholar]
- 52. SensL Technologies, C‐Series low noise, blue‐sensitive silicon photomultipliers datasheet. 2018.
- 53. Wolszczak W, Moszyński M, Szczęśniak T, Grodzicka M, Kacperski K. Temperature properties of scintillators for PET detectors: A comparative study. Paper presented at: 2014 IEEE Nuclear Science Symposium and Medical Imaging Conference (NSS/MIC). 2014.
- 54. Kovaltchouk VD, Lolos GJ, Papandreou Z, Wolbaum K. Comparison of a silicon photomultiplier to a traditional vacuum photomultiplier. Nucl Instrum Methods Phys Res, Sect A. 2005;538:408–415. [Google Scholar]
- 55. Freese DL, Vandenbroucke A, Innes D, et al. Thermal regulation of tightly packed solid‐state photodetectors in a 1 mm(3) resolution clinical PET system. Med Phys. 2015;42:305–313. [DOI] [PMC free article] [PubMed] [Google Scholar]
- 56. Grodzicka M, Moszyński M, Szczęśniak T, Kapusta M, Szawłowski M, Wolski D. Energy resolution of small scintillation detectors with SiPM light readout. J Instrum. 2013;8:P02017–P02017. [Google Scholar]
- 57. Moszynski M. Energy resolution of scintillation detectors. Paper presented at: Optics and Photonics 2005.
- 58. Moszyński M, Nassalski A, Syntfeld‐Kazuch A, Swiderski L, Szczecsniak T. Energy resolution of scintillation detectors—new observations. IEEE Trans Nucl Sci. 2008;55:1062–1068. [Google Scholar]
- 59. Pommé S, Fitzgerald R, Keightley J. Uncertainty of nuclear counting. Metrologia. 2015;52:S3–S17. [Google Scholar]


