

Abstract
Scar formation is an important adverse consequence of burns. How patients appraise their scar quality is often studied shortly after sustaining the injury, but information in the long‐term is scarce. Our aim was, therefore, to evaluate long‐term patient‐reported quality of burn scars. Adults with a burn center admission of ≥1 day between August 2011 and September 2012 were invited to complete a questionnaire on long‐term consequences of burns. We enriched this sample with patients with severe burns (>20% total body surface area [TBSA] burned or TBSA full thickness >5%) treated between January 2010 and March 2013. Self‐reported scar quality was assessed with the Patient Scale of the Patient and Observer Scar Assessment Scale (POSAS). Patients completed this scale for their—in their opinion—most severe scar ≥5 years after burns. This study included 251 patients with a mean %TBSA burned of 10%. The vast majority (91.4%) reported at least minor differences with normal skin (POSAS item score ≥2) on one or more scar characteristics and 78.9% of the patients’ overall opinion was that their scar deviated from normal skin. Patients with severe burns had higher POSAS scores, representing worse scar quality, than patients with mild/intermediate burns, except for color, which was high in both groups. A longer hospital stay predicted reduced scar quality (both mean POSAS and mean overall opinion of the scar) in multivariate analyses. In addition, female gender was also associated with a poorer overall opinion of the scar. In conclusion, this study provides new insights in long‐term scar quality. Scars differed from normal skin in a large part of the burn population more than 5 years after burns, especially in those with severe burns. Female gender is associated with a poorer patients’ overall opinion of their scar, which may be an indication of gender differences in perception of scar quality after burns.
Abbreviations
- POSAS
Patient and Observer Scar Assessment Scale
- TBSA
Total body surface area
Due to improvements in burn treatment, a significantly higher number of burn patients survive their injury and have to deal with scars.1, 2 Scar formation is an important adverse consequence of burn injury. Despite improvements in treatment modalities, scarring remains existent in many patients and especially in those with deep and extended burns.3, 4, 5 Scarring is associated with long‐term cosmetic disfigurement and with both physical and psychological problems.6, 7 Scars can constrict mobility and can cause pain and itch and may hamper health‐related quality of life of burn patients.8, 9
Scar quality is, therefore, an important outcome in burn care and rehabilitation. There are several commonly used measures to assess scar quality subjectively,10 including the Patient and Observer Scar Assessment Scale (POSAS)11 and the Vancouver Scar Scale.12 Older scales were especially developed for clinicians,12, 13 whereas newer scales particularly focus on the patient perspective.14, 15 The patient perspective, which can differ from the clinician perspective,16, 17 is very important as patients have to live with their scar(s) and a patients’ opinion will guide the scar treatment strategy. How patients appraise the quality of their scar is often studied relatively short after sustaining the injury,18, 19, 20 but information on scar quality in the long‐term is scarce.
Earlier studies showed that scar quality significantly improves from 3 to 12–18 months after burns.18, 19 Several factors were shown to influence scar formation and scar quality. Patients with a darker skin type,20, 21, 22 more operations,21, 23 full thickness wounds,18, 20, 24 a high percentage total body surface area (%TBSA) burned,18, 20, 24 and delayed wound healing23, 25, 26, 27 have a higher risk of reduced scar quality. As the maturation of scars may take several years, it is also important to assess scar quality and factors associated with scar quality in the long‐term. Therefore, the primary aim of our study was to evaluate long‐term patient‐reported scar quality >5 years after burns. Our secondary aim was to study factors related to long‐term patient‐reported scar quality.
MATERIALS AND METHODS
Participants
All adult patients (≥18 years old) who had a hospital stay of ≥1 day or surgical treatment in one of the three Dutch burn centers (Red Cross Hospital Beverwijk, Martini Hospital Groningen, and Maasstad Hospital Rotterdam) between August 2011 and September 2012 were selected from the Dutch Burn Repository R3.28 As only a limited number of Dutch burn patients have major burns (about 10%), we enriched this sample with patients with severe burns between January 2010 and March 2013 to elucidate scar quality after severe burns. We defined severe burns as >20% TBSA in adults ≤50 years old; >10% TBSA in adults >50 years old or TBSA full thickness >5% (based on criteria American Burn Association for major burns29). Patients were not eligible when they were deceased, had cognitive impairments, were unable to understand or answer questionnaires in Dutch, or when contact details were missing.
Study procedure
This study is part of the Burden of Burn Injuries study. This cross‐sectional study assessed long‐term consequences of adult and child burn patients admitted to one of the three Dutch burn centers ≥5 years postinjury. Participants completed two surveys, a first short survey that included questions on generic health‐related quality of life and scar quality and a second more extensive survey on other long‐term consequences of burns. The study was conducted according to the principles of the Declaration of Helsinki (Ethics manual World Medical Association 2nd edition 2009) and approved by the Ethics Committee (registration number NL59981) and registered at the Netherlands Trial Register (NTR6407; http://www.trialregister.nl/trialreg/admin/rctview.asp?TC=6407).
Eligible patients received an information letter, an informed consent form, and the first short survey (23 questions). Participants gave consent by signing and returning the informed consent form. Patients who did not respond to the invitation were called to discuss participation. If a patient's telephone number was unknown, a patient could not be reached, or a patient did not return the survey after agreeing to do this, a postal reminder was sent 3 weeks later.
Scar outcome
The short survey included the patient scale of the POSAS 2.0.11 This measurement instrument consists of a descriptive system (six items) and an item on patients’ overall opinion of their scar. The six items include the parameters pain, itch, color (combination of redness and pigmentation), thickness, relief (surface roughness), and pliability (stiffness).30 The items on pain and itch ask whether the scar has been painful or itching in the past few weeks. The items on color, thickness, and pliability ask the patient whether the color, thickness, and stiffness of the scar were different from the normal skin at present. The item on relief, which includes the surface roughness of the scar area, asks the extent to which surface irregularities are present. Items were scored on a 10‐point scale. Pain and itch were scored between 1 (no pain/itch) and 10 (extreme pain/itch). Each of the other items was scored between 1 (no difference with normal skin) and 10 (very different from normal skin).
Participants indicated the location of their most severe scar and completed the POSAS for this scar. The mean POSAS score was calculated by summing up the six items scores and dividing this by 6. The overall opinion item was scored between 1 (as normal skin) and 10 (worst scar imaginable).30 The POSAS outcomes were divided into three categories: (1) low score, no differences with normal skin: POSAS item score 1; (2) intermediate scores, minor differences with normal skin: POSAS item score 2 or 3; (3) high scores, major differences with normal skin: POSAS item score ≥ 4. These cutoff points are arbitrary in the absence of commonly used cutoff points and in the absence of a minimal important change analysis of the POSAS.
Other study parameters
Baseline characteristics were derived from the Dutch Burn Repository R3.28 These were demographic characteristics (age at injury and gender), burn characteristics (%TBSA burned, % full‐thickness burns, anatomical site[s] affected, etiology), and clinical characteristics (date of injury, number of surgeries, length of hospital stay, reconstructive surgery, artificial ventilation).
Statistical analyses
IBM SPSS Statistics 23 and R software (version 1.0.153) were used for the analyses. A nonresponse analysis was performed to study whether participants differed from nonparticipants. Continuous variables were compared using Mann‑Whitney U‐tests and categorical variables using chi‐square tests. Descriptive statistics were used to assess long‐term scar quality. Mann Whitney U tests (continuous variables) and chi‐square tests (categorical variables) were used to compare the characteristics and outcomes of the subgroups of patients with mild and intermediate burns and patients with severe burns, as well as to compare the subgroup of patients with and without surgery, with surgery being a proxy for deep burns. Severe burns were defined as >20% TBSA in adults ≤50 years old or > 10% TBSA in adults >50 years old or TBSA full thickness > 5%. Participants who did not meet this definition were classified as patients with mild or intermediate burns. Missing characteristics were imputed using the imputation “aregImpute” function in R31 (Table 1). This is a robust method that takes all aspects of uncertainty in the imputations into account by using bootstrap to approximate the process of drawing predicted values from a full Bayesian predictive distribution. Univariate analyses were performed to determine which factors predict mean POSAS score and mean overall opinion. Factors with a significance level of p < 0.20 were checked for collinearity (> 0.8 or < −0.8) and entered into the linear mixed‐effects model. Burn center was added as a random effect as the different burn centers might have different treatment strategies. The level of significance was set at p < 0.05. Regression coefficients and the corresponding standard errors (SE) were reported.
Table 1.
Characteristics of study population
| Variable | Total (n = 251) | Mild and intermediate burns (n = 183) | Severe burns (n = 68) | P‐difference between subgroups* |
|---|---|---|---|---|
| Gender: Male, n(%) | 155 (61.8%) | 114 (62.3%) | 42 (60.0%) | 0.772 |
| Age, mean (SD) | 47.6 (17.0) | 45.6 (17.1) | 53.0 (15.6) | 0.002 |
| Age at burn, mean (SD) | 42.0 (17.0) | 40.2 (17.1) | 46.9 (15.8) | 0.004 |
| %TBSA burned, mean (SD) | 9.7 (12.3) | 4.4 (4.1) | 24.0 (15.5) | <0.001 |
| %TBSA full‐thickness, mean (SD)† | 3.7 (8.4) | 0.8 (1.2) | 11.8 (13.3) | <0.001 |
| Length of hospital stay, mean (SD) | 17.7 (22.1) | 9.3 (10.3) | 40.1 (28.8) | <0.001 |
| Number of surgeries, mean (SD) | 1.3 (2.0) | 0.7 (0.7) | 3.0 (2.9) | <0.001 |
| Number of surgeries, n(%) | ||||
| 0 | 89 (35.5%) | 83 (45.4%) | 6 (8.8%) | |
| 1 | 114 (45.4%) | 88 (48.1%) | 26 (38.2%) | |
| >1 | 48 (19.1%) | 12 (6.5%) | 36 (53.0%) | |
| Reconstructive surgery, n(%) | 29 (11.6%) | 8 (4.3%) | 21 (30.9%) | <0.001 |
| Mechanical ventilation, n(%) | 40 (15.9%) | 14 (7.7%) | 26 (38.2%) | <0.001 |
| Time since burn (years), mean (SD) | 5.6 (0.5) | 5.4 (0.2) | 6.1 (0.7) | <0.001 |
| Worst scar location, n(%)⊥ | 0.027 | |||
| Head/face/neck | 32 (14.1%) | 22 (13.7%) | 10 (15.2%) | |
| Trunk | 27 (11.9%) | 14 (8.7%) | 13 (19.7%) | |
| Arm | 58 (25.6%) | 39 (24.2%) | 19 (28.8%) | |
| Hand | 40 (17.6%) | 34 (21.1%) | 6 (9.1%) | |
| Legs | 56 (24.7%) | 39 (24.2%) | 17 (25.8%) | |
| Feet | 14 (6.2%) | 13 (8.1%) | 1 (1.5%) | |
| Etiology, n(%)¶ | <0.001 | |||
| Flame | 142 (57.0%) | 90 (49.5%) | 52 (77.6%) | |
| Scald | 47 (18.9%) | 40 (22.0%) | 7 (10.5%) | |
| Other | 60 (24.1%) | 52 (28.5%) | 8 (11.9%) |
Note. Severe burns: >20% total body surface area (TBSA) in adults ≤50 years old; >10% TBSA in adults >50 years old or TBSA full thickness > 5% (based on criteria American Burn Association1).
Mann‐Whitney U‐tests (continuous variables) and chi‐square tests (categorical variables) for comparison of the two subgroups of burn patients.
Three missing values.
Twenty‐four missing values.
Two missing values.
RESULTS
Participants
A total of 666 patients were selected from the repository. Of these, 517 were eligible, of which 257 patients returned the survey (49.7%) (Figure 1). Six of these patients did not fill in the POSAS and were therefore excluded, resulting in a sample of 251 patients (48.5%). The nonresponse analysis showed that responders were older (p = 0.004), more often females (p = 0.02) and more often had surgery (p = 0.03) than nonresponders (Appendix 1).
Figure 1.
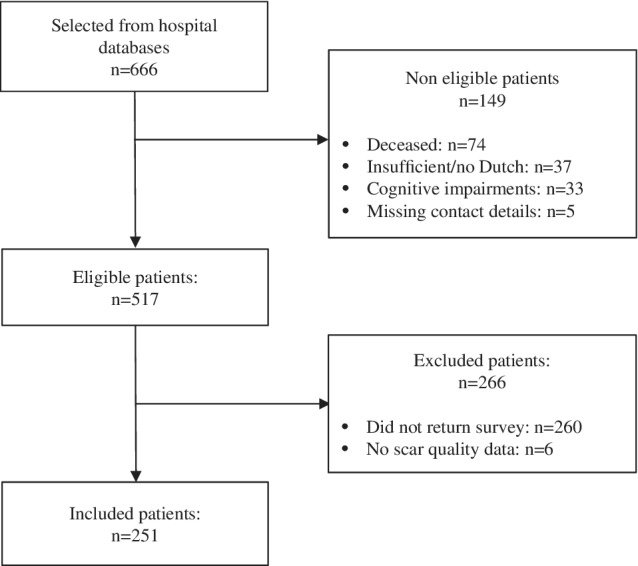
Eligibility and patient inclusion flowchart
Participants had a mean age of 47.6 years (standard deviation [SD] 17.0) and most were male (61.8%) (Table 1). Mean percentage TBSA burned was 9.7 (SD 12.3), mean length of hospital stay was 17.7 days (SD 22.1), and most participants (64.5%; n = 162) had surgery. The mean time since injury was 5.6 years (SD 0.5), and burns were most often caused by flames (57.0%). Participants’ worst scar was often located on their arms, hands, or legs. The sample consisted of 183 participants with mild and intermediate burns (response rate 48.5%) and 68 participants with severe burns (response rate 48.6%). Characteristics of these two subgroups were significantly different for all characteristics except for the percentage of males (Table 1).
Scar quality: Mean POSAS score
The mean patient POSAS score, based on the six scar characteristics, was 3.4 out of 10 (SD 2.0, range 1.0–8.5) (Table 2). Twenty‐one patients (8.6%) indicated that their scar did not deviate from normal skin on all six POSAS items; meaning that the remaining 91.4% (n = 230) of the patients reported at least minor differences (POSAS item score ≥ 2) of their worst scar on one or more characteristics (i.e., POSAS items). A total of 17 patients (7.0%) reported a relatively high score (POSAS item score ≥ 4) on all six items. Patients with severe burns had a significantly higher mean POSAS score (p < 0.001). Five of the six single POSAS items were scored higher in patients with severe burns (p < 0.001 to p = 0.038). Only for the item “color,” no significant differences between the subgroups were observed. Subgroup analyses of patients with and without surgery were performed, with surgery as proxy for deep burns. The analysis showed that patients who underwent surgery reported higher scores on all the items of the POSAS (p < 0.001 to p = 0.036), except for color (p = 0.051) (Appendix 2).
Table 2.
Scar quality in patients with less and severe burns ≥5 years postburn
| POSAS* items Patient Scale | All patients (n = 251) | Mild and intermediate burns (n = 183) | Severe burns (n = 68) | ||||
|---|---|---|---|---|---|---|---|
| Mean | SD | Mean | SD | Mean | SD | p‐values | |
| Pain | 1.8 | 1.6 | 1.6 | 1.3 | 2.3 | 2.1 | 0.038 |
| Itch | 2.6 | 2.2 | 2.3 | 2.1 | 3.2 | 2.3 | 0.017 |
| Color | 4.6 | 2.6 | 4.3 | 2.6 | 5.4 | 2.5 | 0.099 |
| Pliability | 3.8 | 2.8 | 3.3 | 2.6 | 5.1 | 2.9 | 0.000 |
| Thickness | 3.8 | 2.8 | 3.3 | 2.6 | 5.2 | 2.9 | 0.001 |
| Relief | 3.9 | 2.9 | 3.4 | 2.7 | 5.5 | 2.8 | 0.000 |
| Mean POSAS score† | 3.4 | 2.0 | 3.0 | 1.8 | 4.5 | 2.0 | 0.000 |
| Overall opinion | 4.1 | 2.6 | 3.7 | 2.4 | 5.3 | 2.6 | 0.003 |
Note. Severe burns: >20% total body surface area (TBSA) in adults ≤50 years old; >10% TBSA in adults >50 years old or TBSA full thickness > 5% (criteria American Burn Association1).
POSAS, the patient part of the Patient and Observer Scar Assessment Scale.
Mean POSAS score was calculated by summing up the six POSAS item scores and divide this by six.
Most participants reported color differences of their scar; 59.0% reported major differences (POSAS item score ≥ 4) compared with normal skin, 24.7% minor differences (POSAS item score = 2–3), and 16.3% no differences (POSAS item score = 1) (Figure 2). For the scar characteristics pliability, thickness and relief 42.6–45.6% of the participants reported high scores (major differences compared with normal skin), whereas about one out of three patients did not report any difference on these characteristics compared with their normal skin. POSAS scores were lowest for the items itch and pain; the mean itch score was 2.6 (SD 2.2) and the mean pain score 1.8 (SD 1.6) (Table 2).
Figure 2.
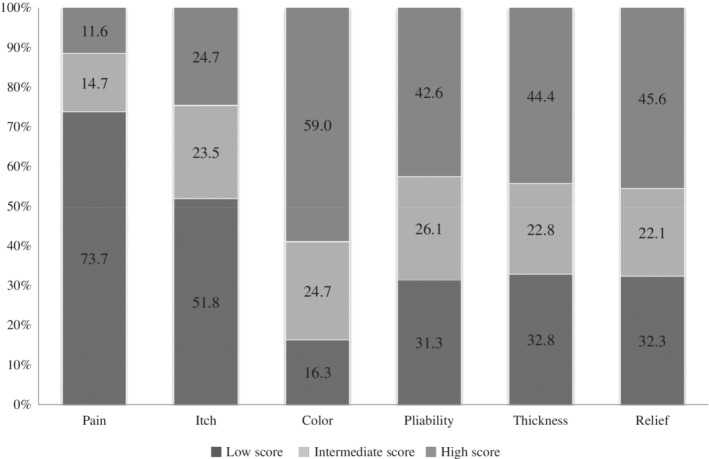
Proportion of patients with low, intermediate, and high scores for scar‐related problems on single‐scar characteristics in the patient part of the POSAS*.
*Low scores, no differences with normal skin: POSAS item score 1; intermediate scores, minor differences with normal skin: POSAS item score 2 or 3; high scores, major differences with normal skin: POSAS item score ≥4.
Scar quality: Overall opinion
Participant's mean overall opinion of their scar, based on the single overall opinion question, was 4.1 out of 10 (SD 2.6, range 1–10) (Table 2). The overall opinion of 53 participants (21.1%) was that their scar did not deviate from normal skin, whereas 65 patients (25.9%) reported minor differences and 133 patients (53.0%) major differences. The overall opinion was worse in severe burn patients than in patients with mild and intermediate burns (mean 5.3 [SD 2.6] vs. 3.7 [SD 2.4], p = 0.003), as well as in patients who underwent surgery than in those without surgery (mean 4.6 [SD 2.6] vs. 3.2 [SD 2.3]) (Appendix 2). Also more patients with severe burns (72.1%) reported a high score (POSAS item score ≥ 4) compared with patients with mild/intermediate burns (45.9%). And more patients with surgery (62.3%) reported a high score compared with those without surgery (36.0%).
In total, 10 participants reported their scar as being the worst scar imaginable (POSAS 10 out of 10). Among these ten patients were five patients with mild/intermediate burns and five with severe burns. These 10 patients were younger at burn (34.3 vs. 42.0 years old), their mean %TBSA was higher (17.8 vs. 9.7%), their mean length of hospital stay was higher (41.7 vs. 17.7 days), they had more surgeries (mean 2.6 vs. 1.3) and more often reconstructive surgery (50 vs. 12%), and the worst scar was more often located on the head/face/neck (30 vs 14%) than the whole sample of burn patients.
Predictors of reduced long‐term scar quality
Univariate predictors were the same for both self‐reported scar quality outcomes (mean POSAS score and overall opinion), except for gender (Table 3). Female gender was associated with a poorer patients’ overall opinion, but not with a poorer mean POSAS score. Worse scar quality was furthermore associated with burn severity indicators: increased %TBSA, high %TBSA full‐thickness, longer hospital stay, multiple surgeries, reconstructive surgery, and artificial ventilation (Table 3). Multivariate analyses revealed that only a longer hospital stay remained a predictor of both scar quality outcomes. Female gender was an independent predictor of poorer overall scar opinion as well (Table 3).
Table 3.
Prediction models for long‐term (>5 year) scar quality
| Variable | Mean POSAS* score | Overall opinion | ||||||||||
|---|---|---|---|---|---|---|---|---|---|---|---|---|
| Univariate regression | Multivariate regression† | Univariate regression | Multivariate regression⊥ | |||||||||
| Regression coefficient | SE | p‐value | Regression coefficient | SE | p‐value | Regression coefficient | SE | p‐value | Regression coefficient | SE | p‐value | |
| Male gender | −0.34 | 0.26 | 0.189 | −0.66 | 0.23 | 0.004 | −0.68 | 0.23 | 0.003 | |||
| Age at injury | −0.11 | 0.13 | 0.395 | −0.03 | 0.11 | 0.811 | ||||||
| %TBSA | 0.63 | 0.12 | <0.001 | 0.36 | 0.11 | 0.002 | ||||||
| %TBSA full thickness | 0.65 | 0.12 | <0.001 | 0.41 | 0.12 | <0.001 | ||||||
| Length of hospital stay | 0.79 | 0.12 | <0.001 | 0.79 | 0.12 | <0.001 | 0.40 | 0.12 | 0.001 | 0.40 | 0.12 | <0.001 |
| Number of surgeries | 0.73 | 0.12 | <0.001 | 0.43 | 0.11 | <0.001 | ||||||
| Reconstructive surgery | 0.43 | 0.12 | <0.001 | 0.13 | 0.10 | 0.188 | ||||||
| Artificial ventilation | 0.43 | 0.12 | <0.001 | 0.26 | 0.11 | 0.019 | ||||||
| Facial burn | −0.57 | 0.48 | 0.236 | 0.44 | 0.39 | 0.257 | ||||||
| Hand burn | 0.33 | 0.35 | 0.336 | 0.18 | 0.29 | 0.549 | ||||||
| Flame burns | 0.24 | 0.26 | 0.361 | 0.02 | 0.22 | 0.938 | ||||||
| Scalds | −0.14 | 0.32 | 0.671 | −0.16 | 0.29 | 0.578 | ||||||
| Time since burn | 0.20 | 0.13 | 0.124 | 0.21 | 0.11 | 0.064 | ||||||
POSAS, the patient part of the Patient and Observer Scar Assessment Scale.
Explained variance: 15.8%.
Explained variance: 9.4%.
DISCUSSION
This multicenter cross‐sectional study assessed patient‐reported scar quality at least 5 years after burns. The vast majority of patients (91.4%) experienced at least minor differences with normal skin on one or more scar characteristics and 78.9% of the patients’ had the opinion that their worst scar was different from normal skin. Many patients reported major differences on “color” (59.0%), a substantial number on “pliability,” “thickness,” and “relief” (42.6–45.6%) and less on itch and pain; however, still 24.7% experienced severe itch and 11.6% severe pain. Patients with severe burns had significantly higher POSAS scores, representing poorer scar quality, than patients with mild and intermediate burns. A longer hospital stay predicted reduced scar quality (both the mean score of the POSAS and the mean overall opinion) in multivariate analyses. In addition, female gender was also associated with a poorer overall opinion of the scar, but not mean POSAS score.
Compared with a previous study in patients with mild and intermediate burns (mean %TBSA burn 5.2%) conducted shorter after burn injury (mean 28 months),19 scar quality in our subgroup of patients with mild and intermediate burns was substantially worse. All single‐scar characteristics, as well as the mean POSAS score and the overall opinion, were reported to be worse in our participants. Although burn severity in both studies was comparable, they differ on three main points: the presence of an observer, the hospital vs. home setting, and the time since injury. All these factors might have influenced the patient's response: provision of socially acceptable answers in the presence of an observer, the unintended influence of a clinician's reaction, or a changed coping behavior. More than 5 years after burns, patients might be more aware that the final look of their scar is reached. Without the burn injury and the earlier phases of their scar fresh in mind, patients might appraise their scar worse than earlier in the process.
Another study looked at the scar quality of Dutch burn patients shorter after burns, namely at 3, 6, and 12 months postburn.18 This study included slightly more severe burn patients (mean %TBSA 14.5%) than our study and showed an improvement of scar quality over time with the mean POSAS decreasing from 4.9 to 4.1 (p ≤ 0.001) between 3 and 12 months following burns. Mean POSAS in our study was 3.4 and thus substantially better than at 12 months postburn. Preferably, a long‐term follow‐up study with measurements during the whole follow‐up (e.g., 3, 6, 12, 24, 36, 48, and 60 months) of the same patients will be conducted to study the actual course of scar quality within burn patients.
Remarkable differences were seen between the mean score of the POSAS and the overall opinion item. The mean POSAS score was lower than the mean overall opinion (3.4 vs. 4.1). However, few participants (8.6%) indicated that their scar was similar to normal skin on all six POSAS items compared with 21.1% of the patients that reported that their overall opinion was that their scar was similar to normal skin. This may be explained by the fact that the mean POSAS score was assessed by more “objective” items on six single‐scar characteristics, whereas the overall opinion was the subjective measure (single‐item question) on how a patient appraises his or her scar on a 10‐point scale. The more “objective” assessment of scar quality does thus not fully reflect the more subjective item on patients’ opinion on their scar. This underlines the importance of a subjective patient‐reported scar evaluation.
The only multivariate predictor significantly associated with reduced scar quality on both scar quality assessments was a longer hospital stay. This is in line with results of a recent study that found that hospital stay predicts scar outcome.20 Length of hospital stay is a proxy for burn severity and might also be a proxy for complex wound healing. Our univariate analysis showed that also other indicators of burn severity (%TBSA burned, %TBSA full‐thickness, multiple surgeries, reconstructive surgery, and artificial ventilation) are related to reduced scar quality, which is consistent with other studies that also found that indicators of burn severity, like %TBSA burned,18, 20, 24 full thickness wounds,18, 20, 24 and number of operations,21, 23 were associated with reduced scar quality.
A poorer patients’ overall opinion of their scar was also predicted by female gender (mean absolute difference 0.9 point); however, gender was not associated with the mean POSAS score, based on the six separate scar characteristics. This may indicate a difference between sex and gender within burn patients. Sex refers to the biological differences between male and female, whereas gender is a matter of culture.32 The more biological approach of assessing scar characteristics does not significantly differ between males and females, whereas the more cultural approach of a subjective rating of the overall opinion does differ. A female's appearance is in general found to be more important than a male's appearance in Western society, which may underlie these differences in scar opinion. However, this may not be the full explanation as a recent study found that females have a significantly higher risk of a raised scar.20 It was hypothesized that this arises from differences in the immune and hormone system, with females having more often maladaptive wound healing responses, which might result in poor scar outcome.20 However, other studies on either scar quality or hypertrophic scars did not find that gender was an independent predictor,18, 21, 23, 24 which is in line with our outcome on the mean POSAS score. In the majority of studies on health‐related quality of life in burns, female gender was seen to be associated with a reduced health‐related quality of life33 and females were shown to have more problems with social participation after burns.34 This supports the gender differences on patients’ overall scar opinion found in our study.
Based on our findings, it is important to counsel patients on the expectations of the final look of their burn(s). Patients with severe burns and those who underwent surgery should be informed that there is a high risk that the final look of their scar is quite different from normal skin and that most differences are seen on the color of the scar. To a lesser extent, the same applies to patients with mild/intermediate burns and those who did not undergo surgery. It is important that they are aware that although they did not had major burns or surgery, there is a chance that their scar will be different from their normal skin, especially on color. Also, females and those who had a long hospital stay should be informed that there is a high risk that their scar is quite different from their normal skin 5 years after burns. It is also important to inform them on preventive and/or therapeutic measures aimed at reducing scar features, such as pressure and silicone therapy, and early laser therapy. Besides, surgery in itself is not necessarily the cause of scarring, because deep burns might have a worse outcome if treated without surgery; our results may not be a reason to avoid surgery as earlier studies have clearly shown that avoiding surgery in deep burns results in significantly worse scarring.35, 36, 37
Strengths of our study include the relatively large sample size, the low amount of missing data, and the multicenter aspect of this study. A limitation is that only a part of the invited population participated in our study. Scar quality of nonresponders might differ from that of participants, which might have led to participation bias. Responders were older at burn (mean 42 vs. mean 38 years), more often females (38 vs. 29%), and more often had surgery (mean 1.3 vs. mean 1.2 surgeries) than nonresponders. As females and patients undergoing more surgery tend to have a lower scar quality, our results might show a slightly worse overall scar quality than the scar quality in the general Dutch burn patient population. Another limitation is our inability to study all factors associated with scar quality. Earlier studies showed evidence for influences on scarring from skin type, wound complications, and time to wound healing, but these factors were not registered in our study. However, in general, Dutch burn patients are not heavily pigmented; in an earlier Dutch study on scar quality, only 5% of the patients had a Fitzpatrick skin score of 5–6.21 Also, we did not collect information on scar treatments, like silicone or laser therapy. Another limitation is that the POSAS was not validated in the absence of an observer, which did not allow us to verify whether patients fully understood the POSAS questions. And no minimal important change analysis is done for the POSAS; therefore, it is unknown if patients (or clinicians) found the observed differences important or meaningful.
CONCLUSIONS
This study provides important new insights in long‐term scar quality. In the vast majority of the patients, scars differed from normal skin more than 5 years after burns. Differences were larger in patients with severe burns than in patients with mild or intermediate burns, except for color, meaning that regardless of the severity of the burn, the color of the worst scar deviates most from normal skin ≥5 years postburn. A longer hospital stay, a proxy for burn severity, predicts reduced scar quality (both mean POSAS score and mean patients’ opinion of their scar). Female gender is associated with a poorer patients’ opinion of their scar, which might be an indication of gender differences in the perception of scar quality after burns. Our study provides data that can help to better inform patients on the long‐term outcome of their injury. Furthermore, preventive and therapeutic measures can be tailored to further improve long‐term scar quality.
Supporting information
Appendix 1. Characteristics of responders vs. nonresponders.
Appendix 2. Scar quality in patients with and without surgery ≥5 years postburn.
ACKNOWLEDGMENTS
We thank all participants for their collaboration and we thank the Burden of Disease group (MM Stoop, AA Boekelaar, N Trommel, J Hiddingh, J Meijer, and M Akkerman) and the Dutch Burn Repository group (EC Kuijper, D Roodbergen, AFPM Vloemans, PPM van Zuijlen, J Dokter, A van Es, GIJM Beerthuizen, J Eshuis, J Hiddingh, SMHJ Scholten‐Jaegers, TM Haanstra, and A Novin) for their cooperation, data collection, and support. We thank the Dutch Burns Foundation Beverwijk for funding this research and Red Cross Hospital Beverwijk, Martini Hospital Groningen, and Maasstad Hospital Rotterdam for their support.
Source of Funding: This study was funded by the Dutch Burns Foundation, grant number 15.102.
Conflict of Interest: None.
REFERENCES
- 1. Bloemsma GC, Dokter J, Boxma H, Oen I. Mortality and causes of death in a burn centre. Burns 2008; 34: 1103–7. [DOI] [PubMed] [Google Scholar]
- 2. Brusselaers N, Hoste EA, Monstrey S, Colpaert KE, De Waele JJ, Vandewoude KH, et al. Outcome and changes over time in survival following severe burns from 1985 to 2004. Intensive Care Med 2005; 31: 1648–53. [DOI] [PubMed] [Google Scholar]
- 3. Van den Kerckhove E, Stappaerts K, Boeckx W, Van den Hof B, Monstrey S, Van der Kelen A, et al. Silicones in the rehabilitation of burns: a review and overview. Burns 2001; 27: 205–14. [DOI] [PubMed] [Google Scholar]
- 4. Mustoe TA, Cooter RD, Gold MH, Hobbs F, Ramelet A‐A, Shakespeare PG, et al. International clinical recommendations on scar management. Plast Reconstr Surg 2002; 110: 560–71. [DOI] [PubMed] [Google Scholar]
- 5. Reish RG, Eriksson E. Scars: a review of emerging and currently available therapies. Plast Reconstr Surg 2008; 122: 1068–78. [DOI] [PubMed] [Google Scholar]
- 6. Van Loey NEE, Van Son MJM. Psychopathology and psychological problems in patients with burn scars. Am J Clin Dermatol 2003; 4: 245–72. [DOI] [PubMed] [Google Scholar]
- 7. Spronk I, Legemate C, Oen I, van Loey NE, Polinder S, van Baar ME. Health related quality of life in adults after burn injuries: a systematic review. PLoS One 2018; 13: e0197507. [DOI] [PMC free article] [PubMed] [Google Scholar]
- 8. Brown B, McKenna S, Siddhi K, McGrouther D, Bayat A. The hidden cost of skin scars: quality of life after skin scarring. J Plast Reconstr Aesthet Surg 2008; 61: 1049–58. [DOI] [PubMed] [Google Scholar]
- 9. Bock O, Schmid‐Ott G, Malewski P, Mrowietz U. Quality of life of patients with keloid and hypertrophic scarring. Arch Dermatol Res 2006; 297: 433. [DOI] [PubMed] [Google Scholar]
- 10. Tyack Z, Simons M, Spinks A, Wasiak J. A systematic review of the quality of burn scar rating scales for clinical and research use. Burns 2012; 38: 6–18. [DOI] [PubMed] [Google Scholar]
- 11. Draaijers LJ, Tempelman FR, Botman YA, Tuinebreijer WE, Middelkoop E, Kreis RW, et al. The patient and observer scar assessment scale: a reliable and feasible tool for scar evaluation. Plast Reconstr Surg 2004; 113: 1960–5. [DOI] [PubMed] [Google Scholar]
- 12. Baryza MJ, Baryza GA. The Vancouver scar scale: an administration tool and its interrater reliability. J Burn Care Rehabil 1995; 16: 535–8. [DOI] [PubMed] [Google Scholar]
- 13. Beausang E, Floyd H, Dunn KW, Orton CI, Ferguson MW. A new quantitative scale for clinical scar assessment. Plast Reconstr Surg 1998; 102: 1954–61. [DOI] [PubMed] [Google Scholar]
- 14. Tyack Z, Ziviani J, Kimble R, Plaza A, Jones A, Cuttle L, et al. Measuring the impact of burn scarring on health‐related quality of life: development and preliminary content validation of the Brisbane burn scar impact profile (BBSIP) for children and adults. Burns 2015; 41: 1405–19. [DOI] [PubMed] [Google Scholar]
- 15. Klassen AF, Ziolkowski N, Mundy LR, Miller HC, McIlvride A, DiLaura A, et al. Development of a new patient‐reported outcome instrument to evaluate treatments for scars: the SCAR‐Q. Plast Reconstr Surg Glob Open 2018; 6: e1672. [DOI] [PMC free article] [PubMed] [Google Scholar]
- 16. Hoogewerf CJ, van Baar ME, Middelkoop E, van Loey NE. Patient reported facial scar assessment: directions for the professional. Burns 2014; 40: 347–53. [DOI] [PubMed] [Google Scholar]
- 17. Nicholas RS, Falvey H, Lemonas P, Damodaran G, Ghannem A, Selim F, et al. Patient‐related keloid scar assessment and outcome measures. Plast Reconstr Surg 2012; 129: 648–56. [DOI] [PubMed] [Google Scholar]
- 18. van der Wal M, Vloemans JF, Tuinebreijer WE, Ven P, Unen E, Zuijlen PP, et al. Outcome after burns: an observational study on burn scar maturation and predictors for severe scarring. Wound Repair Regen 2012; 20: 676–87. [DOI] [PubMed] [Google Scholar]
- 19. Goei H, van der Vlies C, Tuinebreijer W, van Zuijlen P, Middelkoop E, van Baar M. Predictive validity of short term scar quality on final burn scar outcome using the patient and observer scar assessment scale in patients with minor to moderate burn severity. Burns 2017; 43: 715–23. [DOI] [PubMed] [Google Scholar]
- 20. Wallace HJ, Fear MW, Crowe MM, Martin LJ, Wood FM. Identification of factors predicting scar outcome after burn in adults: a prospective case–control study. Burns 2017; 43: 1271–83. [DOI] [PubMed] [Google Scholar]
- 21. Goei H, van der Vlies CH, Hop MJ, Tuinebreijer WE, Nieuwenhuis MK, Middelkoop E, et al. Long‐term scar quality in burns with three distinct healing potentials: a multicenter prospective cohort study. Wound Repair Regen 2016; 24: 721–30. [DOI] [PubMed] [Google Scholar]
- 22. Bombaro KM, Engrav LH, Carrougher GJ, Wiechman SA, Faucher L, Costa BA, et al. What is the prevalence of hypertrophic scarring following burns? Burns 2003; 29: 299–302. [DOI] [PubMed] [Google Scholar]
- 23. Gangemi EN, Gregori D, Berchialla P, Zingarelli E, Cairo M, Bollero D, et al. Epidemiology and risk factors for pathologic scarring after burn wounds. Arch Facial Plastic S 2008; 10: 93–102. [DOI] [PubMed] [Google Scholar]
- 24. Sood RF, Hocking AM, Muffley LA, Ga M, Honari S, Reiner AP, et al. Race and melanocortin 1 receptor polymorphism R163Q are associated with post‐burn hypertrophic scarring: a prospective cohort study. J Invest Dermatol 2015; 135: 2394–401. [DOI] [PMC free article] [PubMed] [Google Scholar]
- 25. Chipp E, Charles L, Thomas C, Whiting K, Moiemen N, Wilson Y. A prospective study of time to healing and hypertrophic scarring in paediatric burns: every day counts. Burns Trauma 2017; 5: 3. [DOI] [PMC free article] [PubMed] [Google Scholar]
- 26. Monstrey S, Hoeksema H, Verbelen J, Pirayesh A, Blondeel P. Assessment of burn depth and burn wound healing potential. Burns 2008; 34: 761–9. [DOI] [PubMed] [Google Scholar]
- 27. Cubison TCS, Pape SA, Parkhouse N. Evidence for the link between healing time and the development of hypertrophic scars (HTS) in paediatric burns due to scald injury. Burns 2006; 32: 992–9. [DOI] [PubMed] [Google Scholar]
- 28. Dokter J, Vloemans A, Beerthuizen G, Van der Vlies C, Boxma H, Breederveld R, et al. Epidemiology and trends in severe burns in the Netherlands. Burns 2014; 40: 1406–14. [DOI] [PubMed] [Google Scholar]
- 29. Herndon DN. Total burn care. Amsterdam: Elsevier Health Sciences, 2007. [Google Scholar]
- 30. van der Wal MB, Tuinebreijer WE, Bloemen MC, Verhaegen PD, Middelkoop E, van Zuijlen PP. Rasch analysis of the patient and observer scar assessment scale (POSAS) in burn scars. Qual Life Res 2012; 21: 13–23. [DOI] [PMC free article] [PubMed] [Google Scholar]
- 31. Marshall A, Altman DG, Holder RL. Comparison of imputation methods for handling missing covariate data when fitting a cox proportional hazards model: a resampling study. BMC Med Res Methodol 2010; 10: 112. [DOI] [PMC free article] [PubMed] [Google Scholar]
- 32. Oakley A. Sex, gender and society. London: Routledge, 2016. [Google Scholar]
- 33. Spronk I, Legemate C, Dokter J, van Loey NE, van Baar ME, Polinder S. Predictors of health related quality of life after burn injuries: a systematic review. Crit Care 2018; 22: 160. [DOI] [PMC free article] [PubMed] [Google Scholar]
- 34. Levi B, Kraft CT, Shapiro GD, Trinh N‐HT, Dore EC, Jeng J, et al. The associations of gender with social participation of burn survivors: a life impact burn recovery evaluation profile study. J Burn Care Res 2018; 39: 915–22. [DOI] [PMC free article] [PubMed] [Google Scholar]
- 35. Cole JK, Engrav LH, Heimbach DM, Gibran NS, Costa BA, Nakamura DY, et al. Early excision and grafting of face and neck burns in patients over 20 years. Plast Reconstr Surg 2002; 109: 1266–73. [DOI] [PubMed] [Google Scholar]
- 36. Engrav LH, Heimbach DM, Reus JL, Harnar TJ, Marvin JA. Early excision and grafting vs. nonoperative treatment of burns of indeterminant depth: a randomized prospective study. J Trauma 1983; 23: 1001–4. [DOI] [PubMed] [Google Scholar]
- 37. Fraulin FO, Illmayer SJ, Tredget EE. Assessment of cosmetic and functional results of conservative versus surgical management of facial burns. J Burn Care Rehabil 1996; 17: 19–29. [DOI] [PubMed] [Google Scholar]
Associated Data
This section collects any data citations, data availability statements, or supplementary materials included in this article.
Supplementary Materials
Appendix 1. Characteristics of responders vs. nonresponders.
Appendix 2. Scar quality in patients with and without surgery ≥5 years postburn.