Summary
Seed germination is a complex trait determined by both quantitative trait loci (QTLs) and environmental factors and also their interactions. In this study, we mapped one major QTL qSE3 for seed germination and seedling establishment under salinity stress in rice. To understand the molecular basis of this QTL, we isolated qSE3 by map‐based cloning and found that it encodes a K+ transporter gene, OsHAK21. The expression of qSE3 was significantly upregulated by salinity stress in germinating seeds. Physiological analysis suggested that qSE3 significantly increased K+ and Na+ uptake in germinating seeds under salinity stress, resulting in increased abscisic acid (ABA) biosynthesis and activated ABA signaling responses. Furthermore, qSE3 significantly decreased the H2O2 level in germinating seeds under salinity stress. All of these seed physiological changes modulated by qSE3 might contribute to seed germination and seedling establishment under salinity stress. Based on analysis of single‐nucleotide polymorphism data of rice accessions, we identified a HAP3 haplotype of qSE3 that was positively correlated with seed germination under salinity stress. This study provides important insights into the roles of qSE3 in seed germination and seedling establishment under salinity stress and facilitates the practical use of qSE3 in rice breeding.
Keywords: QTL, salinity stress, seed germination, HAK transporter, Oryza sativa
Significance Statement
One major QTL qSE3 for rice seed germination and seedling establishment under salinity stress was map‐based cloned, which promotes seed germination under salinity stress by enhancing K+ and Na+ uptake, increasing ABA biosynthesis and ABA signaling responses and reducing H2O2 levels in germinating seeds. The application of qSE3 might be useful for improving salinity tolerance and breeding varieties suitable for direct seeding in rice.
Introduction
Soil salinity is a major factor affecting crop productivity worldwide, and rice (Oryza sativa L.), as the major staple food crop, is also affected by salinity stress (Wang et al., 2012a,b). Approximately, 30% of the total rice‐growing area in the world is affected by salinity stress (Prasad et al., 2000; Takehisa et al., 2004). Seedling establishment is a crucial determinant of crop yield in direct‐seeding rice. High salinity inhibits seed germination and reduces seedling growth in rice (Wang et al., 2011). Therefore, attaining a high capacity of seed germination and seedling establishment under salinity stress is an important objective of rice breeding.
Seed germination and seedling establishment are complex quantitative traits determined by multiple genetic factors. In rice, many quantitative trait loci (QTLs) for seed germination and seedling growth under salinity stress have been identified. Of these QTLs, QTLs conferring salinity tolerance have been identified primarily at the seedling stage (Prasad et al., 2000; Koyama et al., 2001; Lin et al., 2004; Ren et al., 2005; Lee et al., 2006; Cheng et al., 2012; Wang et al., 2012a,b; De Leon et al., 2016, 2017; Puram et al., 2017; Yu et al., 2017), with a few reports of such QTLs at the seed germination stage (Wang et al., 2011). At the seedling stage, the characteristics of Na+ and K+ concentrations and the Na+/K+ ratio are used to evaluate salinity tolerance. Several QTLs for Na+ uptake, K+ concentration and the Na+/K+ ratio have been reported (Koyama et al., 2001; Lin et al., 2004; Ren et al., 2005; Wang et al., 2012a). Only one QTL, SKC1, has been map‐based cloned; this QTL encodes an HKT‐type transporter, OsHKT8, and modulates the K+/Na+ homeostasis of seedlings under salinity stress (Ren et al., 2005).
K+ has essential roles in the developmental and reproduction processes of plants (Gierth and Mäser, 2007) and is important for salinity tolerance (Wu et al., 1996; Shen et al., 2015). Two kinds of transport systems, channels and transporters, are involved in K+ absorption and distribution in plants under salinity stress (Wang and Wu, 2013; Chen et al., 2015; Shen et al., 2015). Four multigene families of K+ transporters occur in plants: the CHX, KEA, Trk/HKT and KT/KUP/HAK families (Gupta et al., 2008; Zhang et al., 2012). Thirteen KT/KUP/HAK genes are found in Arabidopsis (Mäser et al., 2001), and 27 occur in rice (Yang et al., 2009). Several KT/KUP/HAK transporters have been found to be important for salinity tolerance in plants. AtHAK5 plays a prominent role in K+ uptake under salinity stress in Arabidopsis; this uptake reduces the Na+/K+ ratio and increases salinity tolerance (Nieves‐Cordones et al., 2010; Jiang et al., 2013). In rice, OsHAK21 mediates K+ absorption by the plasma membrane and thereby plays crucial roles in the maintenance of Na+/K+ homeostasis under salinity stress (Shen et al., 2015). However, the functions of KT/HAK/KUP transporters in response to salinity stress at the seed germination stage remain unclear.
Abscisic acid (ABA) is an important regulator of seed germination and abiotic stress responses (Zhu, 2002; Graeber et al., 2012; Ryu and Cho, 2015). Under salinity stress, ABA biosynthesis‐related genes, such as zeaxanthin oxidase, 9‐cis‐epoxycarotenoid dioxygenase, and ABA‐aldehyde oxidase, are rapidly activated in plants, and ABA contents increase significantly (Xiong et al., 2002; Zhu, 2002; Chinnusamy et al., 2006; Ryu and Cho, 2015). The elevated levels of ABA help plants to stimulate stomatal closure, alter gene expression and accumulate osmo‐compatible solutes, which increase stress tolerance (Cutler et al., 2010; Kim et al., 2010). In the presence of ABA, the formation of the ABA signaling pyrabactin resistance (PYR)/pyrabactin resistance‐like (PYL)/regulatory component of ABA receptors (RCAR)/protein phosphatase 2C (PP2C) complex leads to the inhibition of PP2C activity, which allows the activation of SNF1‐related protein kinase 2 (SnRK2). Activated SnRK2 then phosphorylates downstream substrate proteins such as transcription factors and thereby facilitates the transcription of ABA‐responsive genes (Sah et al., 2016). SnRKs are a class of Ser/Thr protein kinases that play key roles in plant stress responses (Chinnusamy et al., 2004; Chae et al., 2007; Lu et al., 2007; Piao et al., 2010).
Reactive oxygen species (ROS) are small molecules generated during plant development and stress responses, and they play a dual role in seed germination (Finkel, 1998; Bailly et al., 2008). Low concentrations of ROS function as messengers in cellular signaling pathways that lead to seed germination, whereas high concentrations function as toxic products that lead to delayed or inhibited germination (Bailly et al., 2008). Overaccumulation of ROS can cause DNA damage, protein oxidation and lipid peroxidation, which result in reduced seed germination (Mittler et al., 2004; Bailly et al., 2008; Parkhey et al., 2012). Tight regulation is therefore required to balance ROS production and scavenging for successful germination. The associations between seed germination and the activities of ROS‐scavenging systems such as superoxide dismutase (SOD), catalase (CAT), ascorbate peroxidase (APX) and glutathione reductase (GR) are well documented in Arabidopsis (Leymarie et al., 2012), wheat (Ishibashi et al., 2008), barley (Bahin et al., 2011) and rice (Ye et al., 2012). Additionally, SnRK3 proteins interact with ROS production under salinity stress in Arabidopsis (Verslues et al., 2007). The potential connections between ABA and ROS levels in seed germination and seedling establishment under salinity stress deserve investigation in rice.
Previously, we have identified one salt‐tolerant japonica landrace, Jiucaiqing, from Taihu Lake valley in Jiangsu Province, China (Wang et al., 2011, 2012a,b). In the present study, one major QTL, qSE3, for seed germination and seedling establishment was identified from Jiucaiqing under salinity stress. The qSE3 QTL was isolated using map‐based cloning and found to encode a member of the HAK transporters, OsHAK21. Physiological analysis suggested that qSE3 promoted seed germination and seedling establishment under salinity stress by modulating seed physiological states in rice, including increasing K+ and Na+ uptake and ABA levels and reducing the levels of ROS. In rice breeding, the application of qSE3 will be useful to improve seed germination and seedling establishment under salinity stress.
Results
Characterization of the qSE3 locus and phenotype analysis
Germination rate and seedling establishment were significantly higher for IR26 than for Jiucaiqing under normal conditions (Figure 1a–c). By contrast, the values of these traits were significantly lower in IR26 than in Jiucaiqing under salinity stress (Figure 1d–f). To identify the elite genes in Jiucaiqing, we used 62 chromosome segment substitution lines (CSSLs) developed by introgressing chromosome segments of Jiucaiqing into IR26 for QTL mapping (Figure S1a–c). Three simple sequence repeats (SSR) markers, RM7642, RM7370 and RM6832, located on chromosome 3 were significantly associated with seed germination and seedling establishment under salinity stress (Figure S1d). The region encompassing these markers was designated a quantitative locus for seed germination and seedling establishment (qSE3).
Figure 1.
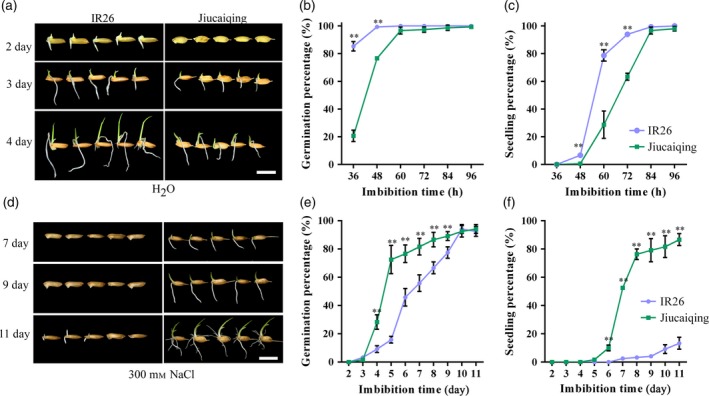
Comparison of seed germination and seedling establishment between Jiucaiqing and IR26 under normal conditions (a–c) or salinity stress (d–f). (b, e) Germination percentage; (c, f) seedling percentage. Bars = 10 mm. Each point represents the means ± SD. ** Indicates the significant difference at 1% level according to Student's t‐test.
A residual heterozygous line (CSSL19) that contained qSE3 was used to confirm QTL function. The allele of qSE3 that came from Jiucaiqing significantly increased seed germination and seedling establishment in the IR26 background under salinity stress compared with those of IR26 (Figure S2). To minimize the effects of background variation, the near isogenic line (NIL) NIL(qSE3) was developed in which almost all of the genetic background was IR26 except for the introgressed segment (Figure 2c). No significant differences in seed germination and seedling establishment were observed between IR26 and NIL(qSE3) under normal conditions (Figure 2d,f–i), whereas NIL(qSE3) has significantly higher or lower values of seed germination and seedling establishment than did IR26 under salinity (Figure 2e, f–i), polyethylene glycol (PEG) (Figure S3a–e) and low temperature stresses (Figure S3f–j).
Figure 2.
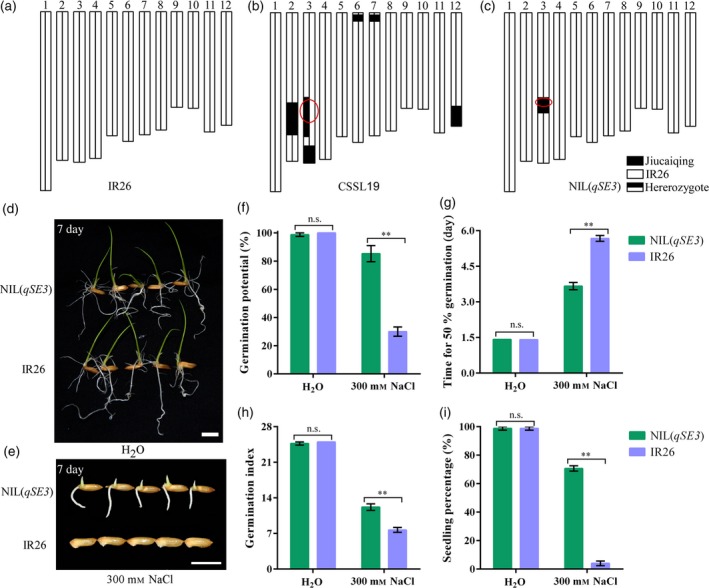
Comparison of seed germination and seedling establishment between NIL(qSE3) and IR26 under normal and salinity stress. Chromosomal location of the introgressed Jiucaiqing segments in CSSL19 (b) and NIL(qSE3) (c) in IR26 background (a). Seed germination under normal conditions (d) or salinity stress (e) at 7 days after imbibition. Bars = 10 mm. (f) Germination potential; (g) time for 50% of the germination percentage; (h) germination index; (i) seedling percentage. Each column represents the means ± SD. ** Indicates the significant difference at 1% level according to Student's t‐test. n.s. Results not significant.
Map‐based cloning of qSE3
To isolate the qSE3 gene, 2368 individuals from the BC4F3 population were used to narrow down the qSE3 locus to a genomic region between the markers YQ19 and RM6832 (Figure 3). High‐resolution mapping was conducted using 939 BC4F4 families to further delimit the qSE3 locus in a 46.57 kb region that contained eight predicted genes (Table S1). Of these genes, the most likely candidate gene of qSE3 was K+ transporter OsHAK21 (LOC_Os03 g37930) based on the following analyses. A previous study indicated that OsHAK21 is involved in salinity tolerance in rice seedlings (Shen et al., 2015). Sequence variation identified in an open reading frame (ORF) analysis indicated that Jiucaiqing and Nipponbare (Nip) have a similar sequence of OsHAK21. However, six single‐base substitutions occurred in the coding region of OsHAK21 between Jiucaiqing and IR26, of which four substitutions, including single nucleotide polymorphism (SNP)1 (−6), SNP2 (−807), SNP4 (−3870) and SNP5 (−3889), led to amino acid substitutions (Figure 4a). The D2E mutation is located in the N‐terminus region, the R676W and R681Q mutations are located in the C‐terminus region of OsHAK21, and the S72P mutation occurs in the first transmembrane domain of OsHAK21 (Figure 4b).
Figure 3.
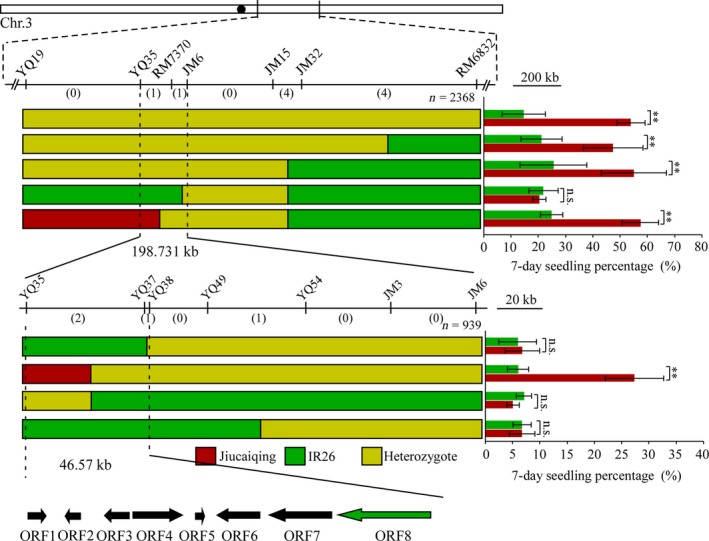
Fine mapping of qSE3. The qSE3 locus was narrowed down to a 46.57 kb region between markers YQ35 and YQ38 on chromosome 3. Numbers below the horizontal line are the number of recombinants. Red bars represent the Jiucaiqing genotype region; green and yellow bars represent IR26 genotype and heterozygous genotype, respectively. Right: the seedling percentage at 7 days after salinity stress. Bars indicate the mean values ± SD. **Indicates significant difference 1% level according to Student's t‐test. n.s. Results not significant. Among the eight genes in this region, ORF 8 corresponds to OsHAK21 (Shen et al., 2015).
Figure 4.
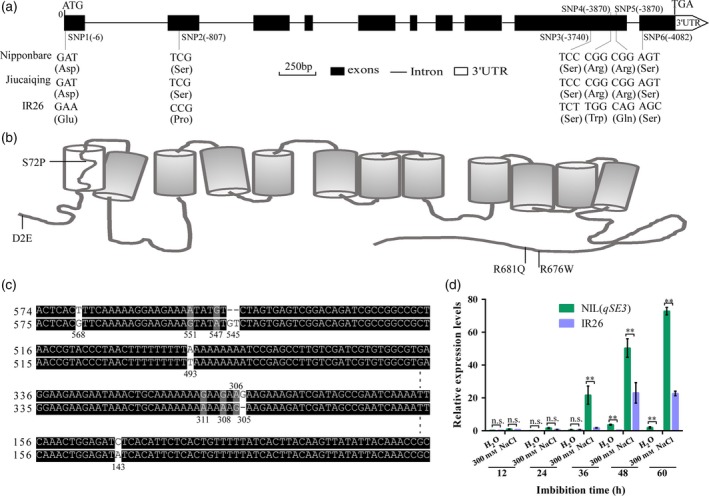
Confirmation of qSE3 candidate gene. (a) Comparison of the nucleotide sequence in the open reading frames (ORFs) of OsHAK21 among Nipponbare, Jiucaiqing and IR26. Black boxes indicate exons, and white box shows the 3′ untranslated region. Solid lines represent introns. Nucleotide variation presented below the horizontal line, and amino acid listed in brackets. (b) Model of OsHAK21 topology and location of mutations. The proposed model for OsHAK21 protein is shown with 12 transmembrane domains and along the cytoplasmic C‐terminus. (c) Comparison of the nucleotide sequence in the promoter region of OsHAK21 between Jiucaiqing and IR26. (d) Comparison of the OsHAK21 expression between NIL(qSE3) and IR26 in germinating seeds under normal condions or salinity stress using a qRT‐PCR approach. Gene expression was normalized to that of OsActin gene control. The relative expression levels were represented by fold change relative to the expression level of NIL(qSE3) in aqueous conditions. Each column represents the means ± SD. ** Indicates the significant difference at 1% levels according to Student's t‐test. n.s. Results not significant.
Eight single‐base substitutions (at positions 143, 306, 308, 311, 493, 547, 551 and 568) and two indels (at positions 305 and 545) in the promoter region of OsHAK21 were also observed between Jiucaiqing and IR26 (Figure 4c). Further quantitative real‐time polymerase chain reaction (qRT‐PCR) analysis showed that OsHAK21 expression was significantly higher in the germinating seeds of NIL(qSE3) than in those of IR26 under salinity stress (Figure 4d). The oshak21 mutant was used to confirm the candidate gene (Figure 5a–b). No significant differences in seed germination and seedling establishment were observed between Nip and oshak21 under normal conditions, whereas oshak21 had significantly lower and higher values of seed germination and seedling establishment, respectively, than did Nip under salinity stress (Figure 5c–g), suggesting the candidate gene is OsHAK21.
Figure 5.
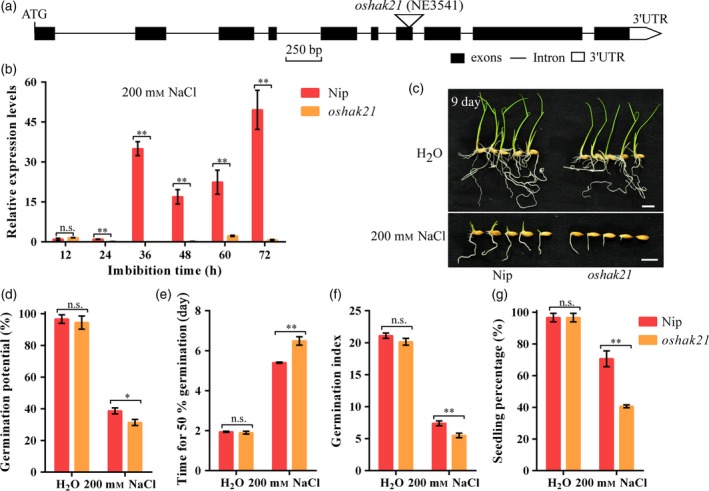
Comparison of seed germination between Nip and oshak21 mutants under normal conditions or salinity stress. (a) Gene structure of OsHAK21 with a T‐DNA insertion. Triangle represents the T‐DNA. Black and white boxes represent exons and the untranslated region (UTR) of OsHAK21, respectively. Solid lines represent introns. (b) qRT‐PCR analysis of OsHAK21 in germinating seeds of Nip and oshak21 under salinity stress. Gene expression was normalized to that of OsActin gene control. The relative expression levels were represented by fold change relative to the expression level of Nip at the 12 h imbibition stage. (c) Seed germination after 9 days under normal conditions or salinity stress. Bars = 10 mm. (d) Germination potential; (e) time for 50% of the germination percentage; (f) germination index; (g) seedling percentage. Each column represents the means ± SD. * and ** Indicate significant difference at 5% and 1% levels according to Student's t‐test, respectively. n.s. Results not significant.
Expression pattern of qSE3
To expand our understanding of the physiological functions of qSE3, we determined the tissue distribution and expression pattern of qSE3 during seed development and seed germination. qRT‐PCR analysis demonstrated that qSE3 was primarily expressed in the root followed by the stem in rice (Figure S4a). The transcript levels of qSE3 increased significantly in the filling grain from 21 days after flowering (DAF) and sharply increased at the mature stage (42 DAF; Figure S4b). Additionally, qSE3 expression was significantly induced by salinity stress during seed germination; the transcript levels of qSE3 were increased significantly after 36 h of imbibition (Figures 4d, 5b). Similarly, the strongest GUS signals were detected in the root under both control and salinity stress conditions (Figure S4c); this finding is consistent with the results of the qRT‐PCR assays.
qSE3 increases K+ and Na+ uptake in germinating seeds under salinity stress
Previous research has indicated that OsHAK21 mediates K+ absorption in rice seedlings under salt stress (Shen et al., 2015). To confirm and compare the transporter activity of OsHAK21 encoded by the alleles from Jiucaiqing (OsHAK21 JCQ) and IR26 (OsHAK21 IR26), complementation tests were performed using a K+ uptake‐deficient mutant of yeast strain CY162. The Arabidopsis AtKAT1 gene was used as a positive control and increases the K+ uptake capability of CY162 cells at micromolar K+ concentrations (Anderson et al., 1992). No significant differences were observed among transformants when they were cultured under 100 mm KCl conditions (Figure 6a). The strain CY162 transformed with the empty pYES2 vector and OsHAK21IR26 were unable to grow under 10 mm and 5 mm KCl conditions, however AtKAT1 and OsHAK21JCQ expession rescued its growth. This result indicated that the OsHAK21 allele from Jiucaiqing conferred significant K+ uptake and growth in yeasts at moderate external K+ concentrations.
Figure 6.
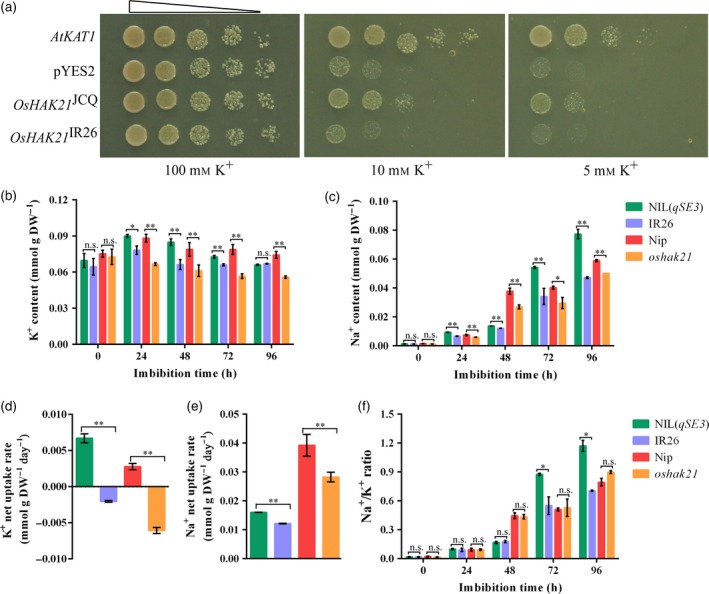
Comparison of K+ and Na+ uptake between NIL(qSE3) and IR26 and between Nip and oshak21 in germinating seeds under salinity stress. (a) Functional analysis of OsHAK21 in the K+ uptake‐deficient mutant strain CY162 of Saccharomyces cerevisiae. Growth status of CY162 cells expressing AtKAT1, empty vector (pYES2) and OsHAK21 encoded by the allele from Jiucaiqing (OsHAK21 JCQ) and IR26 (OsHAK21 IR26) on SD‐URA medium supplemented with 100 mm, 10 mm and 5 mm KCl. The white triangle indicates 1:10 serial dilutions of yeast cells placed on the media. Three independent clones were tested for each condition and outcomes were similar. (b) K+ content; (c) Na+ content; (d) K+ net uptake rate; (e) Na+ net uptake rate; (f) Na+/K+ ratio. Each column represents the means ± SD. * and ** Indicate the significant difference at 5% and 1% levels according to Student's t‐test, respectively. n.s. Results not significant.
To further determine whether qSE3 affected K+ uptake in germinating seeds under salinity stress, the K+ content and net K+ uptake rate were compared between NIL(qSE3) and IR26 and between Nip and oshak21. K+ accumulation and K+ net uptake rates were significantly higher in NIL(qSE3) and Nip than in IR26 and oshak21 respectively (Figure 6b, d). As described above, a similar ORF sequence in OsHAK21 was observed between Jiucaiqing and Nip. Therefore, we confirmed that the OsHAK21 allele from Jiucaiqing (qSE3) could improve the capacity for K+ transport in germinating seeds under salinity stress. Previous research has found that OsHAK21 cloned from Nip may not be permeable to Na+ in yeast (Shen et al., 2015). This finding suggests that OsHAK21 encoded by the allele from Jiucaiqing may not have the capacity for Na+ transport. However, the Na+ content and Na+ net uptake rates were significantly higher in NIL(qSE3) and Nip than in IR26 and oshak21 respectively (Figure 6c, e). As a result, there was no significant reduction of Na+/K+ ratios in germinating seeds in NIL(qSE3) and Nip than in IR26 and oshak21 respectively (Figure 6f).
qSE3 elevates ABA level in germinating seeds under salinity stress
ABA is involved in mediating seed germination and stress responses in plants. We predicted that qSE3 would induce additional ABA biosynthesis in germinating seeds with increasing Na+ accumulation under salinity stress. As expected, the ABA levels were significantly higher in germinating seeds of NIL(qSE3) and Nip than in those of IR26 and oshak21 respectively under salinity stress (Figure 7b). ABA content is modulated by a balance between biosynthesis and catabolism, which are involved in the genes for 9‐cis‐epoxycarotenoid dioxygenase (NCED) and ABA 8′‐hydroxylase (ABA8ox) (Figure 7a). Significantly higher transcript levels of OsNCED3 and OsNCED4, but lower transcript levels of OsABA8ox3, were observed in NIL(qSE3) than in IR26 (Figure 7c, d). No significant difference in OsNCED transcript levels was observed between Nip and oshak21, but the transcript levels of OsABA8ox2 and OsABA8ox3 were significantly lower in Nip than in oshak21. OsSAPKs are the key components of the ABA signaling pathway (Figure 7a). The expression levels of OsSAPK4, OsSAPK9 and OsSAPK10 were significantly higher in NIL(qSE3) and Nip than in IR26 and oshak21 respectively (Figure 7e). These observations suggested that qSE3 affected ABA biosynthesis and the signaling process in germinating seeds under salinity stress in rice.
Figure 7.
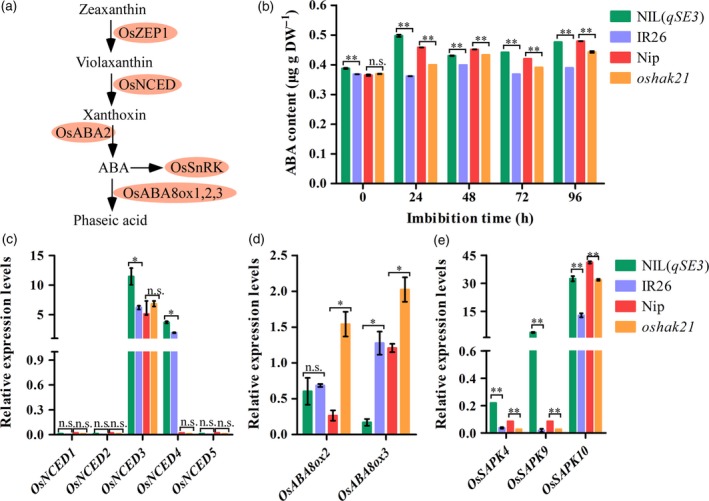
Comparison of ABA levels between NIL(qSE3) and IR26 and between Nip and oshak21 in germinating seeds under salinity stress. (a) General overview of ABA metabolism pathway in rice according to previous reports. (b) ABA content in germination seeds. Relative expression levels of ABA biosynthesis‐related genes (c), catabolism‐related genes (d) and signaling‐related genes (e) in 24 h‐imbibed seeds. Gene expression was normalized to that of the OsActin gene control. The relative expression levels were represented by fold change relative to the expression level of OsNCED1 in NIL(qSE3). Each column represents the means ± SD. * and ** Indicate the significant difference at 5% and 1% levels according to Student's t‐test, respectively. n.s. Results not significant.
qSE3 decreases ROS level in germinating seeds under salinity stress
ROS production is known to be increased under stress conditions. H2O2 is the most stable ROS. To determine whether qSE3 reduces ROS accumulation through ABA regulation in germinating seeds under salinity stress, the levels of H2O2 were determined and compared between NIL(qSE3) and IR26 and between Nip and oshak21. Generally, the levels of H2O2 were significantly lower in NIL(qSE3) and Nip than in IR26 and oshak21 respectively (Figure 8a). Antioxidant enzymes, including CAT, APX and peroxidase (POD), are among the primary defenses against ROS. The activities of CAT, APX and POD were significantly higher in NIL(qSE3) and Nip than in IR26 and oshak21 respectively (Figure 8b–d), which coincided with lower levels of H2O2 in NIL(qSE3) and Nip than in IR26 and oshak21 respectively. These results suggested that qSE3 improved seed germination and seedling establishment under salinity stress by reducing oxidative damage.
Figure 8.
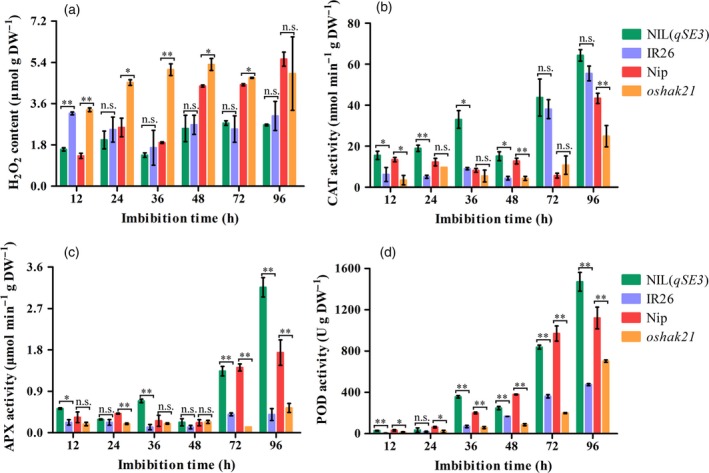
Comparison of H2O2 levels and antioxidant enzymes activities between NIL(qSE3) and IR26 and between Nip and oshak21 in germinating seeds under salinity stress. (a) H2O2 content; (b) CAT activity; (c) APX activity; (d) POD activity. Each column represents the means ± SD. * and ** Indicate the significant difference at 5% and 1% levels according to Student's t‐test, respectively. n.s. Results not significant.
Association of a haplotype of qSE3 with seed germination under salinity stress
To investigate whether allelic constitution at the qSE3 locus affected seed germination under salinity stress, SNPs in the region ~2 kb upstream and ~2 kb downstream of qSE3 were analyzed using the SNP data of rice accessions (McCouch et al., 2016). Five haplotypes of qSE3 were identified among these accessions (Figure 9a). Eight accessions with HAP3 showed increased seed germination under salinity stress (Figure 9b–d). The 2036T SNP of HAP3 was the SNP most significantly associated with seed germination in those eight accessions. To confirm this observation, the association between seed germination and 2036T SNP was further analyzed using 222 rice accessions (Table S2). We observed that 14 rice accessions harboring 2036T SNP exhibited higher seed germination than did 188 rice accessions with 2036C SNP under salinity stress (Figure 9e–g). These results indicated that HAP3 and 2036T SNP of qSE3 were significantly and positively correlated with seed germination under salinity stress.
Figure 9.
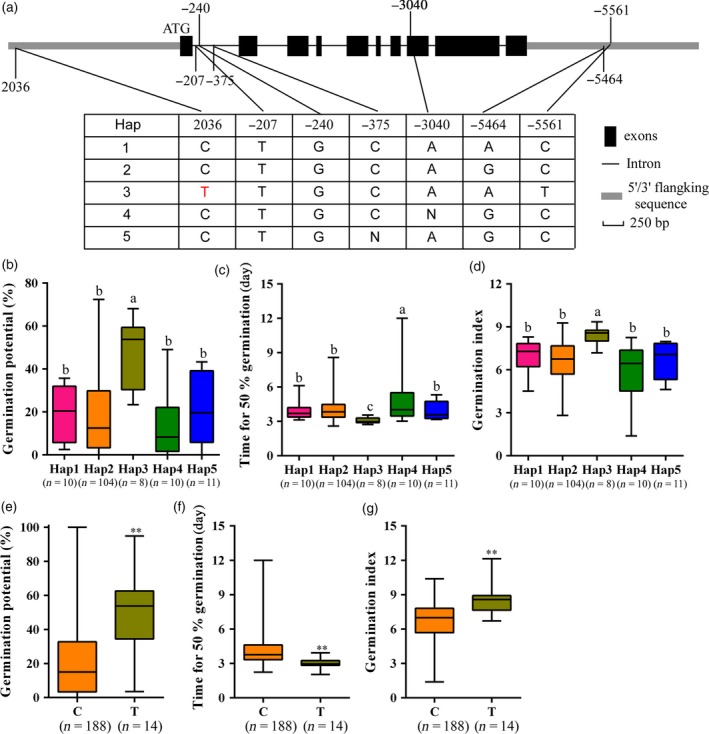
Haplotype of qSE3 associated with seed germination under salinity stress. (a) Haplotypes of qSE3 identified in the region ~2 kb upstream and ~2 kb downstream of the gene. Black boxes and solid lines represent exons and introns, respectively. The 2036T SNP is the most significantly associated with seed germination under salinity stress. (b–d) Germination phenotype of accessions harboring different haplotypes under salinity stress. (e–g) Germination phenotype of accessions harboring 2036T or 2036C SNP under salinity stress. (b, e) Germination potential; (c, f) time for 50% germination; (d, g) germination index. Number of rice accessions listed in brackets. Each column represents the means ± SD. Different lowercase letters represent significant difference at 5% level according to least significant difference (LSD) test. * and ** Indicate the significant difference at 5% and 1% levels according to Student's t‐test, respectively.
Application of qSE3 for direct seeding
To investigate the application of qSE3 for direct seeding, seedling establishment and seedling growth was compared between NIL(qSE3) and IR26 when seeds were directly sown in soil. No significant differences were observed between NIL(qSE3) and IR26 under normal conditions at 7 days after sowing (Figure 10a, b, f–h). However, seedling establishment and seedling growth were significantly higher in NIL(qSE3) than in IR26 under salinity stress (Figure 10c–h). Under salinity stress, the seedling survival of NIL(qSE3) was significantly higher than that of IR26 at 14 days after sowing (Figure 10e). Agronomic traits were similar between NIL(qSE3) and IR26, including heading date, plant height, effective tillers, 1000‐grain weight and panicle length, among others (Figure S5). These results suggested that qSE3 can improve the performance of plants directly seeded under salinity stress while not influencing agronomic traits.
Figure 10.
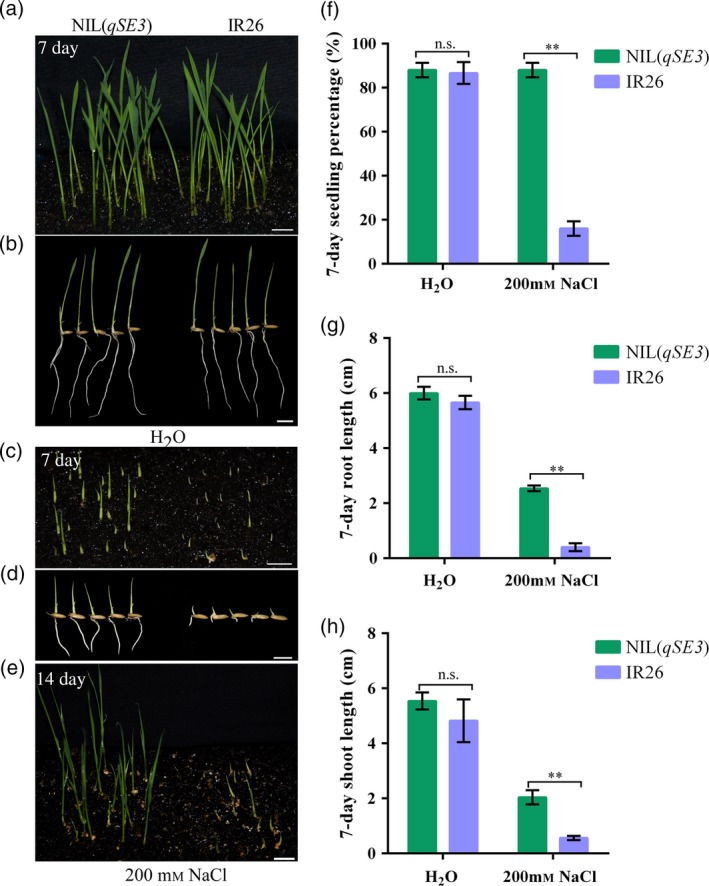
Comparison of seedling establishment and seedling growth between NIL(qSE3) and IR26 when seeds are directly sown in soil. Seedling establishment and seedling growth under normal conditions (a, b) or salinity stress (c, d) at 7 days after sowing. (e) Seedling survival under salinity stress at 14 days after sowing. Bars = 10 mm. (f) Seedling percentage; (g) root length; (h) shoot length. Each column represents the means ± SD. **Indicates the significant difference at 1% level according to Student's t‐test. n.s. Results not significant.
Discussion
Salinity has a strong effect on seed germination, causing low germination rates and low seedling establishment in rice (Wang et al., 2011). In this study, we observed that japonica landrace Jiucaiqing was an elite germplasm that had high capacities of seed germination and seedling establishment under salinity stress. Identification and utilization of elite genes from Jiucaiqing is important for the improvement of salinity tolerance in rice. Here, the elite allele for qSE3 in Jiucaiqing was successfully identified; this allele significantly increased seed germination and seedling establishment under salinity stress. We also observed that qSE3 significantly increased seed germination and seedling establishment under PEG and low temperature conditions. Previous results indicated that qLTG3‐1 modulates seed germination under various conditions that are tightly associated with the vacuolation of tissues covering the embryo (Fujino et al., 2008). To reveal whether qSE3 and qLTG3‐1 have similar functions, we investigated the possible mechanisms of qSE3 in seed germination under salinity stress in this study.
Reducing Na+ uptake, increasing K+ accumulation and thereby decreasing the Na+/K+ ratio is an important strategy for salinity tolerance in seedlings (Munns and Tester, 2008; Yang et al., 2014). Germinating seeds cannot exclude Na+ or Cl− (Tester and Davenport, 2003) or accumulate these in vacuoles as can older seedlings (Greenway and Munns, 1980). We predicted that a different mechanism of salinity tolerance might occur in germinating seeds than that in seedlings of rice. In this study, the major QTL qSE3 was map‐based cloned and found to encode the potassium transporter OsHAK21. OsHAK21 mediates K+ absorption by the plasma membrane and plays crucial roles in the maintenance of Na+/K+ homeostasis in seedlings under salinity stress (Shen et al., 2015). It is known that Na+ will translate from roots to shoots under salinity stress in plants. However, the seedling including shoots and roots has not been established after 72 h and 96 h imbibition under salinity stress in this study. Therefore, the Na+ and K+ concentrations were conducted only in the germinating seeds in this study. We observed that K+ and Na+ uptake increased simultaneously in germinating seeds modulated by qSE3 under salinity stress, resulting in no significant reduction of Na+/K+ ratios. A different capacity of K+ transport was observed between OsHAK21JCQ and OsHAK21IR26 in this study. The C‐terminus of HAK transporters is considered to be critical in determining the capacity of K+ transport (Kim et al., 1998; Rubio et al., 2000; Mangano et al., 2008). We observed that the R676W and R681Q mutations locate in the C‐terminus region of OsHAK21JCQ and OsHAK21IR26, suggesting this protein region might be critical in determining the capacity for K+ transport.
Some members of the KT/HAK/KUP family are characterized as Na+‐permeable transporters. However, none of HAK transporters from higher plants has been shown to mediate high‐affinity Na+ uptake (Benito et al., 2012). Furthermore, Shen et al. (2015) indicated that OsHAK21 may not be permeable to Na+ in yeast. Therefore, we speculated in this study that OsHAK21 may not mediate Na+ transport in germinating seeds under salinity stress. However, a significant increase in Na+ uptake was observed in germinating seeds by regulation of qSE3 under salinity stress. Concerning the low‐affinity Na+ uptake of OsHAK21, it is generally accepted that Na+ can enter the plant through ion channels (Maathuis, 2014), including glutamate‐like receptors, cyclic nucleotide gated channels, or possibly other, non‐identified, non‐selective cation channels (Nieves‐Cordones et al., 2016). Whether qSE3 contributes to Na+ uptake through the activation of ion channels under salinity stress requires further investigation. How did qSE3 promote seed germination under salinity stress with the accumulation of Na+ in this study? The regulation of qSE3 in salinity tolerance at the seed germination stage might include other regulatory mechanisms.
Rapid accumulation of ABA is a characteristic of plants exposed to abiotic stress (Xiong et al., 2002; Zhu, 2002; Ryu and Cho, 2015). In this study, qSE3 regulation elevated ABA biosynthesis and ABA signaling responses in germinating seeds under salinity stress, which might be due to its promotion of Na+ accumulation. ABA is well known to mediate the inhibition of seed germination. How did the accumulation of ABA promote seed germination and seedling establishment under salinity stress in this study? ABA functions through a PYR/RCARs‐PP2Cs‐SnRKs signaling module to regulate multiple physiological processes (Hubbard et al., 2010). Previous studies have indicated that the ABA signaling genes OsRK1, SnRK1A, SnRK2 and OsCIPK31 play key roles in regulating seed germination and stress responses (Xiong and Yang, 2003; Chae et al., 2007; Lu et al., 2007; Piao et al., 2010). Accordingly, we observed that the expression of OsSAPK4, OsSAPK9 and OsSAPK10 increased significantly in germinating seeds modulated by qSE3 under salinity stress, suggesting that qSE3 regulation was involved in the ABA signaling pathway. In Arabidopsis, SnRK3s are involved in ROS regulation through the interaction of CAT under salinity stress (Verslues et al., 2007). Recently, rice SAPK1 and SAPK2 have been reported to improve ROS detoxification following salt stress by promoting ascorbic acid contents and SOD and CAT expression levels in plants (Lou et al., 2018). We hypothesized that induced OsSAPKs expression might be involved in the reduction of ROS levels under the action of ROS‐detoxification enzymes in this study. Maintaining a low level of ROS is important for seed germination and seedling establishment under salinity stress in rice.
Previous studies have shown that salinity tolerance is developmentally regulated and growth stage‐specific in rice (Cheng et al., 2015). Therefore, the development of rice varieties with vigorous germination and seedling growth simultaneously under salinity stress is difficult. According to our results and a previous study (Shen et al., 2015), OsHAK21 improves salinity tolerance at both the seed germination and seedling stages in rice. The application of qSE3 might be useful for breeding varieties suitable for direct seeding. Determination of the allelic diversity of qSE3 with a focus on newly identified tolerant rice accessions is of interest. After analyzing the SNP data of rice accessions, the HAP3 haplotype was identified as positively correlated with seed germination under salinity stress. Eight accessions that harbor the HAP3 haplotype, i.e. Sabharaj, RTS14, Kiang‐Chou‐Chiu, Ai‐Chiao‐Hong, Peh‐Kuh‐Tsao‐Tu, Taichung Native 1, Zhenshan 2 and Peh‐kuh, were identified as salinity tolerant accessions in this study. The identified haplotype and accessions might be useful for improving salinity tolerance in rice.
In conclusion, the major QTL qSE3 for rice seed germination and seedling establishment under salinity stress was identified and cloned in this study and encodes the potassium transporter OsHAK21. qSE3 contributed to seed germination and seedling establishment under salinity stress and might be involved in altering K+ and Na+ uptake and ABA and ROS levels in germinating seeds (Figure 11). K+ uptake increased significantly in germinating seeds under salinity stress because of OsHAK21 mediation of K+ absorption. However, the mechanism underlying the regulatory effect of qSE3 on Na+ uptake remains to be elucidated. Increased movement of Na+ into the cell, together with the protection against Na+‐induced cell damage mediated by K+ accumulation, will cause increases in the ABA biosynthesis and ABA signaling responses in germinating seeds under salinity stress, and will contribute to reducing ROS levels and promoting seed germination and seedling establishment. The function of ABA on reducing ROS level to improve seed germination under salinity stress warrants investigation in the future.
Figure 11.
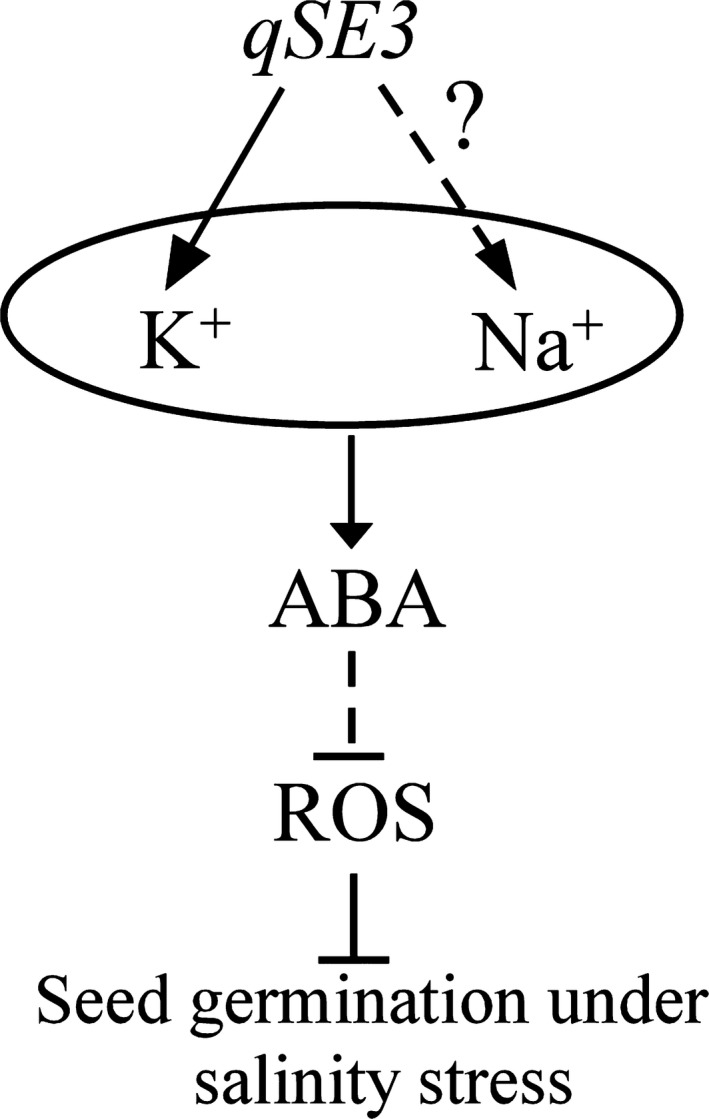
Hypothetical model of the role of qSE3 on seed germination and seedling establishment under salinity stress in rice. qSE3 expression in germinating seeds improves the uptake of K+ and Na+ under salinity stress. Increased K+ and Na+ accumulation in germinating seeds enhances ABA biosynthesis and ABA signaling responses. ROS levels will be reduced in germinating seeds under ABA regulation, which contributes to seed germination and seedling establishment under salinity stress. Arrows and lines with an slanted dashes indicate positive and negative effects, respectively. Solid lines indicate direct regulation, while dashed lines indicate indirect regulation.
Experimental procedures
Plant materials
Japonica Jiucaiqing, indica IR26 and 62 CSSLs, developed by introgressing chromosome segments of Jiucaiqing into IR26 (Cheng et al., 2016), were used for QTL mapping. A residual heterozygous line (CSSL19) that contained the QTL was used to produce BC4F3 and BC4F4 populations with one or two generations of selfing for fine mapping. NILs were screened for fine mapping and functional analysis. japonica Nipponbarewas used as the wild‐type control and oshak21 mutant line on the Nipponbare background was used in functional analysis (Shen et al., 2015). In total 222 accessions from the rice diversity panel were used haplotype analyses (Table S2; Eizenga et al., 2014). All plants were grown in an experimental field at Nanjing Agricultural University. All seeds were harvested at their maturity stage and dried at 42°C for 7 days to break seed dormancy (Wang et al., 2011).
Evaluation of seed germination
Seed germination was conducted as previously described by Wang et al. (2011). Fifty seeds of Jiucaiqing, IR26, CSSLs and NIL per replicate were imbibed in Petri dishes (diameter 9 cm) with 20 ml of 300 mm NaCl at 30 ± 1°C for 11 days, whereas 50 seeds each of Nip and oshak21 were treated with 200 mm NaCl because of the lower salinity tolerance on the Nip background. IR26 and NIL seeds were also treated with 10 ml of 20% PEG6000 (polyethylene glycol with an average molecular weight of 6000 Da) at 30 ± 1°C for 7 days and with 10 ml of distilled water at 15 ± 1°C for 14 days and were sowed 1 cm deep in soil and treated with 200 mm NaCl for 14 days.
Seeds were considered germinated when the radicle protruded through the seed coat. Seedlings were considered established when the root length reached the seed length and the shoot turned green. Percentage germination at 3 days (normal condition) or 5 days (stress condition) was called the germination potential (GP). T 50 was the time at which 50% germination was achieved and was calculated using GERMINATOR software (Joosen et al., 2010). The germination index (GI) was calculated as follows: GI = ∑ (Gt/t), where Gt is the number of the germinated seeds on day t (Wang et al., 2010). The seedling percentage (SP) was calculated each day. Following 0, 24, 48, 72 and 96 h of imbibition under salinity stress, approximately 1 g of each sample was harvested to detect the levels of Na+, K+, ABA, H2O2 and antioxidant enzyme activities. Three biological replicates were made.
Map‐based cloning
The mean values of GI and SP in the individual CSSLs were compared with those of the recurrent parent IR26 for QTL mapping. QTLs were assigned to the introgressed region when significant differences in GI and SP were observed in CSSLs (Cheng et al., 2016). Genomic DNA of seedlings from the BC4F3 and BC4F4 populations was extracted using the cetyltrimethylammonium bromide (CTAB) method to screen recombinants for fine mapping (Murray and Thompson, 1980). Markers used for fine mapping are listed in Table S3. The candidate gene was predicted using the data at http://rice.plantbiology.msu.edu/cgi-bin/gbrowse. The genome sequence and region ~1 kb upstream of the candidate gene were amplified from the genomic DNA of Jiucaiqing and IR26 using Phanta® Super‐Fidelity DNA polymerase (Vazyme Biotech Co., Ltd, Nanjing, Jiangsu, China).
Expression analysis
Total RNA was extracted from developing grains (at 0, 7, 14, 21, 28, 35 or 42 DAF) and germinating seeds (at 12, 24, 36, 48, 60 and 72 h after imbibition) in Nip using the TransZol Plant kit (Transgen, http://www.transgen.com) according to the manufacturer's protocol. First‐strand cDNA was synthesized with random oligonucleotides using the HiScript® II Reverse Transcriptase system (Vazyme Biotech Co., Ltd.). qRT‐PCR was carried out in a total volume of 20 μl containing 2 μl of cDNA, 0.4 μl of gene‐specific primers (10 μm), 10 μl of SYBR Green Mix and 7.2 μl of RNase‐free ddH2O using the Roche LightCycler480 Real‐time System (Roche, Swiss Confederation). PCR conditions were as follows: 95°C for 5 min followed by 40 cycles of 95°C for 15 sec and 60°C for 30 sec. Rice OsActin and 18S rRNA genes were used as internal controls. Primers used for qRT‐PCR are listed in Table S4. Normalized transcript levels of gene expression were calculated using the comparative CT method (Livak and Schmittgen, 2001). Transgenic plants carrying the OsHAK21 promoter−GUS fusion construct in Nip were used for a GUS staining assay. Histochemical staining of GUS activity was performed as described by Lagarde et al. (1996). Three biological replicates were made.
Yeast strains and culture conditions
AtKAT1, OsHAK21 JCQ (cloned from Jiucaiqing) and OsHAK21 IR26 (cloned from IR26) coding sequences were cloned into the expression vector pYES2. The K+ uptake‐deficient CY162 (MATα, ura3‐52, leu2, trk1Δ, his3Δ200, his4‐15 and trk2Δ1::pCK64) strain of the yeast was used (Shanghai Weidi Biotechnology Co., Ltd. Shanghai, China). The yeast transformations were performed using the LiAC/ssDNA/PEG method as described previously (Horie et al., 2011), and the growth assays were performed on SD‐URA (Synthetic Dextrose Minimal Medium without Uracil) medium. Three biological replicates were made.
Evaluation of K+ and Na+ levels
Approximately 1 g of each sample was dried in an oven at 85°C for 3 days, weighed and then extracted with nitric acid using a microwave digestion system. K+ and Na+ contents were measured using inductively coupled plasma mass spectrometry (ICP‐MS; Perkin Elmer, Nexion 300X, USA). The net uptake rates of K+ and Na+ were calculated as described by Nieves‐Cordones et al. (2010): net uptake rate = (C 2 − C 1)/[(t 2 − t 1) × (R 1 + R 2)/2], where C is the total K+ or Na+ content, R is the dry weight of the seeds, and t is the time at harvest; the subscript numbers 1 and 2 indicate the start and end of the period for which the uptake rate was calculated: t 2 − t 1 = 2 days. (R 1 + R 2)/2 = the mean seed dry weight. Na+ or K+ content was expressed as μmol g DW−1 (dry weight) d−1. Three biological replicates were made.
Hormone quantification
Approximately 1 g of each sample was rapidly frozen in liquid nitrogen and homogenized into a powder. Endogenous ABA was extracted from each sample using 5 ml of 80% (v/v) pre‐cooling methanol at 4°C for 12 h, followed by centrifugation at 8000 g at 4°C for 10 min. The supernatant was collected, and 0.1 g of poly(vinylpolypyrrolidone) was added to adsorb the phenolic compounds and pigments at 4°C for 1 h. The mixture was then centrifuged at 12 000 g at 4°C for 10 min. Next, the supernatant was washed with 5 ml of 100% (w/v) and 5 ml of 80% (v/v) methanol and passed through C18 columns (C18 Sep‐Park® Cartridges; Waters Corp., Milford, MA, USA). The extract was freeze dried, dissolved in 2 ml of 75% aqueous methanol, and then filtered through 0.22‐μm membrane filters. The final 2 μl of filtrate solution was used for ABA quantification using a high‐performance liquid chromatography (HPLC) system (Waters Instruments Inc., USA). ABA content was determined using the external standard method and is expressed as μg g DW−1. Three biological replicates were made.
Evaluation of H2O2 level
H2O2 levels were assayed based on the Huang and Song method (2013) with minor modifications. Approximately 1 g of each sample was rapidly frozen in 5 ml of cold acetone (−20°C) and homogenized into a powder. A titanium reagent (20% titanic tetrachloride in concentrated HCl, v/v), NH4OH and H2SO4 were added to the homogenate. Then, the mixture was centrifuged at 12 000 g at 4°C for 10 min, and the absorbance of the supernatant was determined immediately at 415 nm. The H2O2 content was expressed as μmol g DW−1. Three biological replicates were made.
Evaluation of antioxidant enzyme activities
CAT, APX and POD activities were measured using commercial assay kits following the manufacturer's instructions (Suzhou Keming Bioengineering Company, Suzhou, Jiangsu, China). Approximately 0.1 g of powder of each sample was added to 1 ml of sodium phosphate buffer (50 mm, pH 7.0). After centrifugation at 8 000 g at 4°C for 10 min, the supernatant was collected to determine CAT, APX and POD activities. Three biological replicates were made.
CAT activity was determined based on monitoring absorbance at 240 nm. The reaction mixture contained 10 μl of enzyme extract and 190 μl of a solution of 50 mm phosphate buffer (pH 7.0) and 10 mm H2O2 in a final volume of 200 μl at 25°C. CAT activity was calculated using the following formula: CAT activity (nmol min−1 g DW−1) = 918 × ΔA240/DW.
APX activity was determined by monitoring absorbance at 290 nm. The reaction mixture contained 140 μl of 50 mm phosphate buffer (pH 7.0), 20 μl of 7.5 mm AsA, 20 μl of 300 mm H2O2 and 20 μl of enzyme extract in a final volume of 200 μl at 25°C. APX activity was calculated using the following formula: APX activity (μmol min−1 g DW−1) = 1.79 × ΔA290/DW.
POD activity was determined based on monitoring absorbance at 470 nm. The reaction mixture contained 10 μl of enzyme extract, 60 μl of ddH2O, 120 μl of 0.1 mm acetic acid buffer (pH 5.4), 30 μl of 20 mm guaiacol and 30 μl of 22 mm H2O2 in a final volume of 250 μl at 25°C. One unit of POD activity was defined as an absorbance change of 0.005 units per minute at 470 nm. POD activity was calculated using the following formula: POD activity (U g DW−1) = 5000 × ΔA470/DW.
Haplotype analyses
To determine the haplotypes of the target gene, 700 000 SNP markers of rice accessions listed at https://ricediversity.org/data/index.cfm (McCouch et al., 2016) were used. SNPs in the region ~2 kb upstream and ~2 kb downstream of the target gene were located according to the Rice Genome Annotation Project MSU7 database (Rice Genome Browser: http://rice.plantbiology.msu.edu). Seed germination was conducted using 222 accessions under 200 mm NaCl conditions for 10 days (Table S2). Haplotypes represented at least eight investigated accessions that were previously used for a comparative analysis of phenotypes (Dong et al., 2016).
Data analysis
Experimental data were analyzed using SAS software (Cary, NC, USA), and significant differences among samples were compared using Student's t‐test or using the least significant difference (LSD) test at the 5% and 1% levels of probability.
Conflict of Interest
The authors declare no conflicts of interest.
Supporting information
Figure S1. QTL mapping for seed germination and seedling establishment under salinity stress.
Figure S2. Comparison of seed germination and seedling establishment between CSSL19(qSE3) and CSSL19(qse3) under salinity stress.
Figure S3. Comparison of seed germination and seedling establishment between NIL(qSE3) and IR26 under PEG and low temperature stresses.
Figure S4. Expression patterns of OsHAK21 in rice.
Figure S5. Comparison of agronomic traits between NIL(qSE3) and IR26.
Table S1. Candidate genes located between YQ35 and YQ38 for qSE3
Table S2. Information of 222 accessions used for haplotype analyses
Table S3. Primer pairs used for fine mapping in this study
Table S4. Primer pairs used for gene cloning and qRT‐PCR analyses in this study
Acknowledgements
The authors would like to thank USDA‐ARS for seeds of the Rice Diversity Panel and thank Dr. Wenhua Zhang at Nanjing Agricultural University for providing seeds of oshak21 mutant and transgenic plants carrying the OsHAK21 promoter−GUS fusion construct. This work was supported by the National Natural Science Foundation of China (Grant No. 31771757; 31601387), the National Key Research and Development Plan (Grant No. 2018YFD0100901), the Science and Technology Project of Jiangsu Province (Grant No. BE2016380), and the Natural Science Foundation of Jiangsu Province (Grant No. BK20161451).
Contributor Information
Jinping Cheng, Email: cjp@njau.edu.cn.
Zhoufei Wang, Email: wangzf@scau.edu.cn.
References
- Anderson, J.A. , Huprikar, S.S. , Kochian, L.V. , Lucas, W.J. and Gaber, R.F. (1992) Functional expression of a probable Arabidopsis thaliana potassium channel in Saccharomyces cerevisiae . Proc. Natl. Acad. Sci. USA, 89, 3736–3740. [DOI] [PMC free article] [PubMed] [Google Scholar]
- Bahin, E. , Bailly, C. , Sotta, B. , Kranner, I. , Corbineau, F. and Leymarie, J. (2011) Crosstalk between reactive oxygen species and hormonal signalling pathway regulates grain dormancy in barley. Plant, Cell Environ. 34, 980–993. [DOI] [PubMed] [Google Scholar]
- Bailly, C. , El‐Maarouf‐Bouteau, H. and Corbineau, F. (2008) From intracellular signaling networks to cell death: the dual role of reactive oxygen species in seed physiology. C R Biol. 331, 806–814. [DOI] [PubMed] [Google Scholar]
- Benito, B. , Garciadeblas, B. and Rodriguez‐Navarro, A. (2012) HAK transporters from Physcomitrella patens and Yarrowia lipolytica mediate sodium uptake. Plant Cell Physiol. 53, 1117–1123. [DOI] [PubMed] [Google Scholar]
- Chae, M.J. , Lee, J.S. , Nam, M.H. , Cho, K. , Hong, J.Y. , Yi, S.A. , Suh, S.C. and Yoon, I.S. (2007) A rice dehydration‐inducible SNF1‐related protein kinase 2 phosphorylates an abscisic acid responsive element‐binding factor and associates with ABA signaling. Plant Mol. Biol. 63, 151–169. [DOI] [PubMed] [Google Scholar]
- Chen, G. , Hu, Q. , Luo, L. , Yang, T. , Zhang, S. , Hu, Y. , Yu, L. and Xu, G. (2015) Rice potassium transporter OsHAK1 is essential for maintaining potassium‐mediated growth and functions in salt tolerance over low and high potassium concentration ranges. Plant, Cell Environ. 38, 2747–2765. [DOI] [PubMed] [Google Scholar]
- Cheng, L. , Wang, Y. , Meng, L. , Hu, X. , Cui, Y. , Sun, Y. , Zhu, L. , Ali, J. , Xu, J. and Li, Z. (2012) Identification of salt‐tolerant QTLs with strong genetic background effect using two sets of reciprocal introgression lines in rice. Genome, 55, 45–55. [DOI] [PubMed] [Google Scholar]
- Cheng, J. , He, Y. , Yang, B. , Lai, Y. , Wang, Z. and Zhang, H. (2015) Association mapping of seed germination and seedling growth at three conditions in indica rice (Oryza sativa L.). Euphytica, 206, 1–13. [Google Scholar]
- Cheng, J. , He, Y. , Zhan, C. , Yang, B. , Xu, E. , Zhang, H. and Wang, Z. (2016) Identification and characterization of quantitative trait loci for shattering in rice landrace Jiucaiqing from Taihu Lake Valley, China. Plant Genome, 9, 10.3835/plantgenome2016.03.0034. [DOI] [PubMed] [Google Scholar]
- Chinnusamy, V. , Schumaker, K. and Zhu, J.K. (2004) Molecular genetic perspectives on cross‐talk and specificity in abiotic stress signalling in plants. J. Exp. Bot. 55, 225–236. [DOI] [PubMed] [Google Scholar]
- Chinnusamy, V. , Zhu, J. and Zhu, J.K. (2006) Salt stress signaling and mechanisms of plant salt tolerance. Genet. Eng. 27, 141–177. [DOI] [PubMed] [Google Scholar]
- Cutler, S.R. , Rodriguez, P.L. , Finkelstein, R.R. and Abrams, S.R. (2010) Abscisic acid: emergence of a core signaling network. Annu. Rev. Plant Biol. 61, 651–679. [DOI] [PubMed] [Google Scholar]
- De Leon, T.B. , Linscombe, S. and Subudhi, P.K. (2016) Molecular dissection of seedling salinity tolerance in rice (Oryza sativa L.) using a high‐density GBS‐Based SNP linkage map. Rice, 9, 52. [DOI] [PMC free article] [PubMed] [Google Scholar]
- De Leon, T.B. , Linscombe, S. and Subudhi, P.K. (2017) Identification and validation of QTLs for seedling salinity tolerance in introgression lines of a salt tolerant rice landrace ‘Pokkali’. PLoS ONE, 12, e0175361. [DOI] [PMC free article] [PubMed] [Google Scholar]
- Dong, H. , Zhao, H. , Xie, W. et al. (2016) A novel tiller angle gene, TAC3, together with TAC1 and D2 largely determine the natural variation of tiller angle in rice cultivars. PLoS Genet. 12, e1006412. [DOI] [PMC free article] [PubMed] [Google Scholar]
- Eizenga, G.C. , Ali, M.L. , Bryant, R.J. , Yeater, K.M. , McClung, A.M. and McCouch, S.R. (2014) Registration of the Rice Diversity Panel 1 for genome wide association studies. J. Plant Reg. 8, 109–116. [Google Scholar]
- Finkel, T. (1998) Oxygen radicals and signalling. Curr. Opin. Chem. Biol. 10, 248–253. [DOI] [PubMed] [Google Scholar]
- Fujino, K. , Sekiguchi, H. , Matsuda, Y. , Sugimoto, K. , Ono, K. and Yano, M. (2008) Molecular identification of a major quantitative trait locus, qLTG3‐1, controlling low temperature germinability in rice. Proc. Natl. Acad. Sci. USA, 105, 12623–12628. [DOI] [PMC free article] [PubMed] [Google Scholar]
- Gierth, M. and Mäser, P. (2007) Potassium transporters in plants–involvement in K+ acquisition, redistribution and homeostasis. FEBS Lett. 581, 2348–2356. [DOI] [PubMed] [Google Scholar]
- Graeber, K. , Nakabayashi, K. , Miatton, E. , Leubner‐Metzger, G. and Soppe, W.J. (2012) Molecular mechanisms of seed dormancy. Plant, Cell Environ. 35, 1769–1786. [DOI] [PubMed] [Google Scholar]
- Greenway, H. and Munns, R. (1980) Mechanisms of salt tolerance in nonhalophytes. Ann. Rev. Plant Physiol. 31, 149–190. [Google Scholar]
- Gupta, M. , Qiu, X. , Wang, L. , Xie, W. , Zhang, C. , Xiong, L. , Lian, X. and Zhang, Q. (2008) KT/HAK/KUP potassium transporters gene family and their whole‐life cycle expression profile in rice (Oryza sativa). Mol. Genet. Genomics, 280, 437–452. [DOI] [PubMed] [Google Scholar]
- Horie, T. , Brodsky, D.E. , Costa, A. , Kaneko, T. , Lo Schiavo, F. , Katsuhara, M. and Schroeder, J.I. (2011) K+ transport by the OsHKT2; 4 transporter from rice with a typical Na+ transport properties and competition in permeation of K+ over Mg2+ and Ca2+ ions. Plant Physiol. 156, 1493–1507. [DOI] [PMC free article] [PubMed] [Google Scholar]
- Huang, H. and Song, S. (2013) Change in desiccation tolerance of maize embryos during development and germination at different water potential PEG‐6000 in relation to oxidative process. Plant Physiol. Biochem. 68, 61–70. [DOI] [PubMed] [Google Scholar]
- Hubbard, K.E. , Nishimura, N. , Hitomi, K. , Getzoff, E.D. and Schroeder, J.I. (2010) Early abscisic acid signal transduction mechanisms: newly discovered components and newly emerging questions. Genes Dev. 24, 1695–1708. [DOI] [PMC free article] [PubMed] [Google Scholar]
- Ishibashi, Y. , Yamamoto, K. , Tawaratsumida, T. , Yuasa, T. and Iwaya‐Inoue, M. (2008) Hydrogen peroxide scavenging regulates germination ability during wheat (Triticum aestivum L.) seed maturation. Plant Signal. Behav. 3, 183–188. [DOI] [PMC free article] [PubMed] [Google Scholar]
- Jiang, C. , Belfield, E.J. , Cao, Y. , Smith, J.A. and Harberd, N.P. (2013) An Arabidopsis soil‐salinity‐tolerance mutation confers ethylene‐mediated enhancement of sodium/potassium homeostasis. Plant Cell, 25, 3535–3552. [DOI] [PMC free article] [PubMed] [Google Scholar]
- Joosen, R.V. , Kodde, J. , Willems, L.A. , Ligterink, W. , van der Plas, L.H. and Hilhorst, H.W. (2010) GERMINATOR: a software package for high‐throughput scoring and curve fitting of Arabidopsis seed germination. Plant J. 62, 148–159. [DOI] [PubMed] [Google Scholar]
- Kim, E.J. , Kwak, J.M. , Uozumi, N. and Schroeder, J.I. (1998) AtKUP1: an Arabidopsis gene encoding high‐affinity potassium transport activity. Plant Cell, 10, 51–62. [DOI] [PMC free article] [PubMed] [Google Scholar]
- Kim, T.H. , Böhmer, M. , Hu, H. , Nishimura, N. and Schroeder, J.I. (2010) Guard cell signal transduction network: advances in understanding abscisic acid, CO2, and Ca2+ signaling. Ann. Rev. Plant Physiol. 61, 561–591. [DOI] [PMC free article] [PubMed] [Google Scholar]
- Koyama, M.L. , Levesley, A. , Koebner, R.M.D. , Flowers, T.J. and Yeo, A.R. (2001) Quantitative trait loci for component physiological traits determining salt tolerance in rice. Plant Physiol. 125, 406–422. [DOI] [PMC free article] [PubMed] [Google Scholar]
- Lagarde, D. , Basset, M. , Lepetit, M. , Conejero, G. , Gaymard, F. , Astruc, S. and Grignon, C. (1996) Tissue‐specific expression of Arabidopsis AKT1 gene is consistent with a role in K+ nutrition. Plant J. 9, 195–203. [DOI] [PubMed] [Google Scholar]
- Lee, S.Y. , Ahn, J.H. , Cha, Y.S. , Yun, D.W. , Lee, M.C. , Ko, J.C. , Lee, K.S. and Eun, M.Y. (2006) Mapping of quantitative trait loci for salt tolerance at the seedling stage in rice. Mol. Cells, 21, 192–196. [PubMed] [Google Scholar]
- Leymarie, J. , Vitkauskaité, G. , Hoang, H.H. , Gendreau, E. , Chazoule, V. , Meimoun, P. , Corbineau, F. , El‐Maarouf‐Bouteau, H. and Bailly, C. (2012) Role of reactive oxygen species in the regulation of Arabidopsis seed dormancy. Plant Cell Physiol. 53, 96–106. [DOI] [PubMed] [Google Scholar]
- Lin, H.X. , Zhu, M.Z. , Yano, M.J. , Gao, P. , Liang, Z.W. , Su, W.A. , Hu, X.H. , Ren, Z.H. and Chao, D.Y. (2004) QTLs for Na+ and K+ uptake of the shoots and roots controlling rice salt tolerance. Theor. Appl. Genet. 108, 253–260. [DOI] [PubMed] [Google Scholar]
- Livak, K.J. and Schmittgen, T.D. (2001) Analysis of relative gene expression data using real‐time quantitative PCR and the 2−DDC(T) method. Methods, 25, 402–408. [DOI] [PubMed] [Google Scholar]
- Lou, D. , Wang, H. and Yu, D. (2018) The sucrose non‐fermenting‐1‐related protein kinases SAPK1 and SAPK2 function collaboratively as positive regulators of salt stress tolerance in rice. BMC Plant Biol. 18, 203. [DOI] [PMC free article] [PubMed] [Google Scholar]
- Lu, C.A. , Lin, C.C. , Lee, K.W. , Chen, J.L. , Huang, L.F. , Ho, S.L. , Liu, H.J. , Hsing, Y.I. and Yu, S.M. (2007) The SnRK1A protein kinase plays a key role in sugar signaling during germination and seedling growth of rice. Plant Cell, 19, 2484–2499. [DOI] [PMC free article] [PubMed] [Google Scholar]
- Maathuis, F.J. (2014) Sodium in plants: perception, signalling, and regulation of sodium fluxes. J. Exp. Bot. 65, 849–858. [DOI] [PubMed] [Google Scholar]
- Mangano, S. , Silberstein, S. and Santa‐María, G.E. (2008) Point mutations in the barley HvHAK1 potassium transporter lead to improved K+‐nutrition and enhanced resistance to salt stress. FEBS Lett. 582, 3922–3928. [DOI] [PubMed] [Google Scholar]
- Mäser, P. , Thomine, S. , Schroeder, J.I. et al. (2001) Phylogenetic relationships within cation transporter families of Arabidopsis . Plant Physiol. 126, 1646–1667. [DOI] [PMC free article] [PubMed] [Google Scholar]
- McCouch, S.R. , Wright, M.H. , Tung, C.W. et al. (2016) Open access resources for genome‐wide association mapping in rice. Nat. Commun. 7, 10532. [DOI] [PMC free article] [PubMed] [Google Scholar]
- Mittler, R. , Vanderauwera, S. , Gollery, M. and Breusegem, F.V. (2004) Reactive oxygen gene network of plants. Trends Plant Sci. 9, 490–498. [DOI] [PubMed] [Google Scholar]
- Munns, R. and Tester, M. (2008) Mechanisms of salinity tolerance. Ann. Rev. Plant Physiol. 59, 651–681. [DOI] [PubMed] [Google Scholar]
- Murray, M.G. and Thompson, W.F. (1980) Rapid isolation of high molecular weight plant DNA. Nucleic Acids Res. 8, 4321–4325. [DOI] [PMC free article] [PubMed] [Google Scholar]
- Nieves‐Cordones, M. , Alemán, F. , Martínez, V. and Rubio, F. (2010) The Arabidopsis thaliana HAK5 K+ transporter is required for plant growth and K+ acquisition from low K+ solutions under saline conditions. Mol. Plant 3, 326–333. [DOI] [PubMed] [Google Scholar]
- Nieves‐Cordones, M. , Martínez, V. , Benito, B. and Rubio, F. (2016) Comparison between Arabidopsis and rice for main pathways of K(+) and Na(+) uptake by roots. Front. Plant Sci. 7, 992. [DOI] [PMC free article] [PubMed] [Google Scholar]
- Parkhey, S. , Naithani, S.C. and Keshavkant, S. (2012) ROS production and lipid catabolism in desiccating Shorea robusta seeds during aging. Plant Physiol. Biochem. 57, 261–267. [DOI] [PubMed] [Google Scholar]
- Piao, H.L. , Xuan, Y.H. , Park, S.H. et al. (2010) OsCIPK31, a CBL‐interacting protein kinase is involved in germination and seedling growth under abiotic stress conditions in rice plants. Mol. Cells, 30, 19–27. [DOI] [PubMed] [Google Scholar]
- Prasad, S.R. , Bagali, P.G. , Hittalmani, S. and Shashidhar, H.E. (2000) Molecular mapping of quantitative trait loci associated with seedling tolerance to salt stress in rice (Oryza sativa L.). Curr. Sci. 78, 162–164. [Google Scholar]
- Puram, V.R.R. , Ontoy, J. , Linscombe, S. and Subudhi, P.K. (2017) Genetic dissection of seedling stage salinity tolerance in rice using introgression lines of a salt tolerant landrace Nona Bokra. J. Hered. 108, 658–670. [DOI] [PubMed] [Google Scholar]
- Ren, Z.H. , Gao, J.P. , Li, L.G. , Cai, X.L. , Huang, W. , Chao, D.Y. , Zhu, M.Z. , Wang, Z.Y. , Luan, S. and Lin, H.X. (2005) A rice quantitative trait locus for salt tolerance encodes a sodium transporter. Nat. Genet. 37, 1141–1146. [DOI] [PubMed] [Google Scholar]
- Rubio, F. , Santa‐Mara, G.E. and Rodrguez‐Navarro, A. (2000) Cloning of Arabidopsis and barley cDNAs encoding HAK potassium transporters in root and shoot cells. Plant Physiol. 109, 34–44. [Google Scholar]
- Ryu, H. and Cho, Y.G. (2015) Plant hormones in salt stress tolerance. J. Plant Biol. 58, 147–155. [Google Scholar]
- Sah, S.K. , Reddy, K.R. and Li, J. (2016) Abscisic acid and abiotic stress tolerance in crop plants. Front. Plant Sci. 7, 571. [DOI] [PMC free article] [PubMed] [Google Scholar]
- Shen, Y. , Shen, L. , Shen, Z. , Jing, W. , Ge, H. , Zhao, J. and Zhang, W. (2015) The potassium transporter OsHAK21 functions in the maintenance of ion homeostasis and tolerance to salt stress in rice. Plant, Cell Environ. 38, 2766–7279. [DOI] [PubMed] [Google Scholar]
- Takehisa, H. , Shimodate, T. , Fukuta, Y. , Ueda, T. , Yano, M. , Yamaya, T. , Kameya, T. and Sato, T. (2004) Identification of quantitative trait loci for plant growth of rice in paddy field flooded with salt water. Field. Crop. Res. 89, 85–95. [Google Scholar]
- Tester, M. and Davenport, R. (2003) Na+ tolerance and Na+ transport in higher plants. Ann. Bot. 91, 503–527. [DOI] [PMC free article] [PubMed] [Google Scholar]
- Verslues, P.E. , Batelli, G. , Grillo, S. , Agius, F. , Kim, Y.S. , Zhu, J. , Agarwal, M. , Katiyar‐Agarwal, S. and Zhu, J.K. (2007) Interaction of SOS2 with nucleoside diphosphate kinase 2 and catalases reveals a point of connection between salt stress and H2O2 signaling in Arabidopsis thaliana . Mol. Cell. Biol. 27, 7771–7780. [DOI] [PMC free article] [PubMed] [Google Scholar]
- Wang, Y. and Wu, W.H. (2013) Potassium transport and signaling in higher plants. Annu. Rev. Plant Biol. 64, 451–476. [DOI] [PubMed] [Google Scholar]
- Wang, Z.F. , Wang, J.F. , Bao, Y.M. , Wang, F.H. and Zhang, H.S. (2010) Quantitative trait loci analysis for rice seed vigor during the germination stage. J. Zhejiang Univ. Sci. B 11, 958–964. [DOI] [PMC free article] [PubMed] [Google Scholar]
- Wang, Z. , Wang, J. , Bao, Y. , Wu, Y. and Zhang, H. (2011) Quantitative trait loci controlling rice seed germination under salt stress. Euphytica, 178, 297–307. [Google Scholar]
- Wang, Z. , Chen, Z. , Cheng, J. , Lai, Y. , Wang, J. , Bao, Y. , Huang, J. and Zhang, H. (2012a) QTL analysis of Na+ and K+ concentrations in roots and shoots under different levels of NaCl stress in rice (Oryza sativa L.). PLoS ONE, 7, e51202. [DOI] [PMC free article] [PubMed] [Google Scholar]
- Wang, Z. , Cheng, J. , Chen, Z. , Huang, J. , Bao, Y. , Wang, J. and Zhang, H. (2012b) Identification of QTLs with main, epistatic and QTL × environment interaction effects for salt tolerance in rice seedlings under different salinity conditions. Theor. Appl. Genet. 125, 807–815. [DOI] [PubMed] [Google Scholar]
- Wu, S.J. , Ding, L. and Zhu, J.K. (1996) SOS1, a genetic locus essential for salt tolerance and potassium acquisition. Plant Cell, 8, 617–627. [DOI] [PMC free article] [PubMed] [Google Scholar]
- Xiong, L. and Yang, Y. (2003) Disease resistance and abiotic stress tolerance in rice are inversely modulated by an abscisic acid‐inducible mitogen activated protein kinase. Plant Cell, 15, 745–759. [DOI] [PMC free article] [PubMed] [Google Scholar]
- Xiong, L. , Schumaker, K.S. and Zhu, J.K. (2002) Cell signaling during cold, drought, and salt stress. Plant Cell, 14(Suppl), S165–S183. [DOI] [PMC free article] [PubMed] [Google Scholar]
- Yang, Z. , Gao, Q. , Sun, C. , Li, W. , Gu, S. and Xu, C. (2009) Molecular evolution and functional divergence of HAK potassium transporter gene family in rice (Oryza sativa L.). J. Genet. Genomics, 36, 161–172. [DOI] [PubMed] [Google Scholar]
- Yang, T. , Zhang, S. , Hu, Y. et al. (2014) The role of a potassium transporter OsHAK5 in potassium acquisition and transport from roots to shoots in rice at low potassium supply levels. Plant Physiol. 166, 945–959. [DOI] [PMC free article] [PubMed] [Google Scholar]
- Ye, N. , Zhu, G. , Liu, Y. , Zhang, A. , Li, Y. , Liu, R. , Shi, L. , Jia, L. and Zhang, J. (2012) Ascorbic acid and reactive oxygen species are involved in the inhibition of seed germination by abscisic acid in rice seeds. J. Exp. Bot. 63, 1809–1822. [DOI] [PMC free article] [PubMed] [Google Scholar]
- Yu, J. , Zao, W. , He, Q. , Kim, T.S. and Park, Y.J. (2017) Genome‐wide association study and gene set analysis for understanding candidate genes involved in salt tolerance at the rice seedling stage. Mol. Genet. Genomics, 292, 1391–1403. [DOI] [PubMed] [Google Scholar]
- Zhang, Z. , Zhang, J. , Chen, Y. , Li, R. , Wang, H. and Wei, J. (2012) Genome‐wide analysis and identification of HAK potassium transporter gene family in maize (Zea mays L.). Mol. Biol. Rep., 39, 8465–8473. [DOI] [PubMed] [Google Scholar]
- Zhu, J.K. (2002) Salt and drought stress signal transduction in plants. Annu. Rev. Plant Biol., 53, 247–273. [DOI] [PMC free article] [PubMed] [Google Scholar]
Associated Data
This section collects any data citations, data availability statements, or supplementary materials included in this article.
Supplementary Materials
Figure S1. QTL mapping for seed germination and seedling establishment under salinity stress.
Figure S2. Comparison of seed germination and seedling establishment between CSSL19(qSE3) and CSSL19(qse3) under salinity stress.
Figure S3. Comparison of seed germination and seedling establishment between NIL(qSE3) and IR26 under PEG and low temperature stresses.
Figure S4. Expression patterns of OsHAK21 in rice.
Figure S5. Comparison of agronomic traits between NIL(qSE3) and IR26.
Table S1. Candidate genes located between YQ35 and YQ38 for qSE3
Table S2. Information of 222 accessions used for haplotype analyses
Table S3. Primer pairs used for fine mapping in this study
Table S4. Primer pairs used for gene cloning and qRT‐PCR analyses in this study


