

Abstract
Background
The rheological properties of dermal drug delivery systems are of importance when designing new formulations. Viscosity not only affects features such as spreadability and skin feel, but may also affect the skin penetration of incorporated actives. Data on the latter aspect are controversial. Our objective was to elucidate the relation between viscosity and drug delivery performance of different model hydrogels assuming that enhanced microviscosity might delay drug release and penetration.
Materials and Methods
Hydrogels covering a broad viscosity range were prepared by adding either HPMC or HEC as gelling agents in different concentrations. To investigate the ability of the gels to deliver a model drug into the skin, sulphadiazine sodium was incorporated and its in vitro skin penetration was monitored using tape stripping/HPLC analysis and non‐invasive confocal Raman spectroscopy.
Results
The trends observed with the two different experimental setups were comparable. Drug penetration depths decreased slightly with increasing viscosity, suggesting slower drug release due to the increasingly dense gel networks. However, the total penetrated drug amounts were independent of the exact formulation viscosity.
Conclusion
Drug penetration was largely unaffected by hydrogel viscosity. Moderately enhanced viscosity is advisable when designing cellulose ether hydrogels to allow for convenient application.
Keywords: confocal raman spectroscopy, rheological properties, skin penetration, sulphadiazine sodium, tape stripping, viscosity
1. INTRODUCTION
The majority of dermal drug delivery vehicles exhibit viscoelastic flow properties to facilitate practical application and thus patient compliance. A reasonably high viscosity is beneficial for manual application of a formulation to the skin. However, it is still not clarified how increasing the viscosity from fluid to semi‐solid will affect drug release and skin penetration. The scientific reports on the impact of rheological formulation properties on skin penetration are controversial.
On the one hand, a relation between the viscosity of a dermal system and its ability to deliver a drug into the skin has been documented by numerous studies. Both direct and inverse correlations were reported. A negative impact of increased viscosity on drug release and skin permeation in vitro was found by several groups.1, 2, 3 It was hypothesised that drug diffusion was increasingly obstructed through increasing concentrations of the gelling agent and the resulting increased viscosity of the system.4 Thus, gels with higher viscosity exhibited slower drug release rates. In contrast to these findings, a positive correlation between increased viscosity and skin penetration was reported by Batheja et al.5 The authors reported improved skin permeation due to enhanced contact with the skin; the latter can be achieved by adding gelling agents to dermal preparations. High viscosity impedes the “run‐off” of the formulation; it thus remains on the application site for a longer time period, which prolongs the time available for diffusion of incorporated drugs.
On the other hand, various researchers reported no or only a subordinate impact of formulation viscosity on the observed drug delivery performance.6, 7 Previous work within our group investigated the role of strongly divergent viscosity of sucrose ester‐based emulsions of otherwise identical composition, but different droplet size.8 No correlation was found between viscosity and skin penetration in vitro or in vivo.
Considering these divergent results, it is apparent that the broad range of experimental setups might have contributed to the differences in penetration/permeation behaviour. A variety of different formulations was used, and various different test conditions were employed. Moreover, most of the described data were obtained as a by‐product of studies dealing with different questions regarding formulation development or drug delivery. Only few studies systematically investigate the role of formulation viscosity on skin penetration while using different experimental setups to confirm their findings.9, 10
Based on our experiences, we hypothesise that increased viscosity does not affect skin penetration of model drugs from O/W emulsions.8 The penetration behaviour of drugs from monophasic drug delivery systems gelled by polymers, such as hydrogels, is the next logical step to obtain a complete picture on the role of viscosity in dermal drug delivery. Thus, the aim of the present study was to specifically investigate the effect of modified dynamic viscosity on skin penetration of a model drug from hydrogels based on different cellulose ether‐based gelling agents.
To this end, simple hydrogels covering a broad range of viscosity values were developed using two common gelling agents, hydroxyethyl cellulose (HEC) and hydroxypropyl methylcellulose (HPMC). In vitro skin penetration studies were performed using two different experimental setups, the basic tape stripping technique in combination with HPLC analysis and non‐invasive confocal Raman spectroscopy (CRS). The employed model drug was sulphadiazine sodium (SDZ), an antibiotic drug suitable for analysis with both techniques. Two entirely different analytical techniques were used to obtain more information, specifically on the potential impact of the experimental setup on the results (eg infinite versus finite dose conditions).
2. MATERIALS AND METHODS
2.1. Materials
Sulphadiazine sodium (SDZ) and potassium sorbate were obtained from Sigma‐Aldrich. Hydroxyethyl cellulose (HEC) and hydroxypropyl methylcellulose (HPMC) were purchased from Herba Chemosan Apotheker‐AG. Methanol and glacial acetic acid were procured from Carl Roth GmbH + Co. KG. All further chemicals used were analytical reagent grade; they were used without further purification.
Pig ears were obtained from a local abattoir (EU‐Schlachthof Gantner) and stored at −18°C up to a maximum of 6 months. Corneofix® adhesive tapes with a square area of 4.0 cm2 used to remove the layers of the stratum corneum (SC) during tape stripping experiments were obtained from Courage + Khazaka electronic GmbH.
2.2. Formulations
The composition of the gel formulations was chosen in accordance with preliminary studies. The objective was to prepare stable hydrogels with different semi‐synthetic gelling agents. A range of formulations were designed to cover a broad range of dynamic viscosity values while at the same time maintaining sufficient fluidity to allow for easy spreading on the skin.
Two cellulose ether derivatives were chosen as gelling agents, HEC and HPMC. The composition of the gel formulations is given in Table 1. In total, six gel formulations were selected for systematic investigation, three of them containing HEC at concentrations from 2.5% to 7.5% (w/w) and the other three containing HPMC at concentrations from 1.0% to 3.0% (w/w). The incorporated model drug was SDZ; formulations investigated for their skin penetration potential by tape stripping were loaded with 1.0% (w/w) of the drug while formulations designated for penetration analysis by CRS were loaded with 10% (w/w) of the drug to ensure sufficient detection within the skin.11 In addition, aqueous drug solutions of the same drug concentrations were employed as control formulations without the use of gelling agents.
Table 1.
Composition of the investigated hydrogels in % (w/w) and abbreviations. Depending on whether the formulations were used for the CRS measurements or tape stripping experiments, the amount of incorporated sulphadiazine sodium varied
| Excipients | Formulation composition (% w/w) | |||||
|---|---|---|---|---|---|---|
| HEC 2.5% | HEC 5.0% | HEC 7.5% | HPMC 1.0% | HPMC 2.0% | HPMC 3.0% | |
| HEC | 2.5 | 5.0 | 7.5 | ‐ | ‐ | ‐ |
| HPMC | ‐ | ‐ | ‐ | 1.0 | 2.0 | 3.0 |
| SDZ | 1.0 or 10 | |||||
| Potassium sorbatea | 0.1 | |||||
| Distilled water to | 100 | |||||
Abbreviations: HEC, hydroxyethyl cellulose; HPMC, hydroxypropyl methylcellulose; SDZ, sulphadiazine sodium.
Added only to formulations intended for the stability study.
Hydrogels were prepared by slowly mixing the respective gelling agent into freshly distilled water at 60°C and allowing the system to swell for 30 minutes. The model drug SDZ and, where required, the preserving agent potassium sorbate were separately dissolved in distilled water at room temperature. The drug solution was then incorporated into the gel and the final formulation was transferred into a sealed glass container and stored at 4°C.
2.3. Hydrogel characterisation and stability monitoring
To obtain an overview of physicochemical properties and stability a range of representative preserved hydrogels with 10% (w/w) SDZ were analysed in triplicate (n = 3) for drug content, pH value and dynamic viscosity in regular intervals. The formulations were characterised immediately after preparation and monitored fortnightly until destabilisation for a maximum of 20 weeks. The hydrogels were also regularly checked macroscopically for the presence of structures visible to the eye to detect physical instability phenomena or microbial contamination.
2.3.1. Drug content and pH value
The drug content of SDZ‐loaded hydrogels was determined after preparation by HPLC to confirm successful drug incorporation. To this end, 10 mg of hydrogel was dissolved in 2 mL of methanol and shaken for 2.5 hours at room temperature. Afterwards, the solution was centrifuged at 19 000 g and analysed by HPLC (see Section 2.5). For every formulation, samples were taken at least in triplicate (n ≥ 3). The initial value measured after preparation was set as 100%. Long‐term stability was assessed by taking samples in regular intervals over 20 weeks.
The pH value of the formulations was analysed using a pH meter (Orion 420A; Bartelt) with an Orion ROSS micro pH electrode (8220BNWP).
2.3.2. Rheological measurements
Rheological characterisation of the hydrogels was performed on a MCR Modular Compact Rheometer 302 (Anton Paar) with a thermostatic control system. The formulations were loaded into the device equipped with a cone‐and‐plate measuring system (diameter: 25 mm; cone angle: 2°). The temperature was maintained at 32°C ± 0.2°C throughout all measurements to mimic skin surface temperature. Flow curves were recorded for all formulations. To describe the flow behaviour of the hydrogels, the dynamic viscosity η (in Pa∙s) was measured under increasing shear stress. A controlled shear rate ranging from 1 to 100 s−1 was employed.
The rheological properties of the formulations were measured after preparation and monitored fortnightly over a period of 20 weeks to document potential changes over time. All measurements were carried out in triplicate.
2.4. Tape stripping experiments
In vitro tape stripping experiments were performed on full‐thickness porcine ear skin to investigate the penetration of SDZ into the SC. Porcine skin was chosen as model system since it represents an acknowledged substitute for human skin.12, 13 It closely resembles human skin although specific differences such as higher permeability of porcine SC compared to human SC have to be taken into consideration.14
On the day of the experiment, pig ears were defrosted and the skin was carefully freed from hair with scissors. Intact, representative skin areas were selected. The transepidermal water loss (TEWL) of the skin was measured with the closed‐chamber device AquaFlux® (Biox Ltd., London, UK). This probe measures the water evaporating from the skin in g m−2 h−1; for in vitro experiments, it can be employed to confirm the integrity of the skin barrier function.15 The formulations containing 1.0% (w/w) SDZ were applied homogeneously onto marked skin areas at a concentration of 5 mg cm−2 with a saturated vinyl glove finger and were massaged into the skin for 60 seconds.
After 1 hour of incubation at room temperature, the samples were blotted dry with a soft tissue to remove potential residues of the applied formulations. Sequentially, thirty Corneofix® adhesive tape strips were placed on the marked area and removed in a continuous movement, as uniformly as possible. Tape strips were pressed onto the skin with a rolling movement of the thumb applying a constant force of 49 N (5 kg). The outline of the first strip was traced with a permanent marker to ensure analysis of the exact same skin area.
The corneocyte content of porcine SC removed with the individual adhesive films was quantified using the infrared densitometer SquameScan® 850A (Heiland Electronic GmbH) as previously described.16 SC thickness was calculated by removing tape strips until the measured pseudo‐absorption was below the detection limit of the densitometer.17 The total SC thickness results from the sum of the calculated amounts of SC on all tapes. A mean SC thickness of porcine ear skin of 14.12 ± 3.11 μm was determined in 24 individual experiments (n = 24).
After protein quantification by IR densitometry the tape strips were transferred into Eppendorf tubes and extracted with 2 mL of methanol. Subsequently, the samples were analysed for their SDZ content by HPLC. For each formulation, at least eight individual tape stripping experiments were performed (n ≥ 8).
2.5. HPLC analysis
SDZ quantification was performed by HPLC (PerkinElmer Inc.), using a Nucleosil 100‐5 C18 column (EC 250/4, Macherey‐Nagel) and a pre‐column (EC 4/3, Macherey‐Nagel). The column‐oven temperature was set to 30°C and the injection volume was 10 μL. The mobile phase consisted of distilled water, methanol and glacial acetic acid (750/249/1, v/v/v) isocratically eluted at 1.0 mL min−1. SDZ was detected by UV absorption at a wavelength of 270 nm and for data analysis TotalChrom Navigator 6.3.2 software (PerkinElmer Inc.) was used. Calibration curves from standard solutions of SDZ in methanol ranging from 0.058 to 120.0 μg mL−1 for quantification were linear with a coefficient of determination of R 2 = 1. Samples containing a higher content of SDZ were diluted. The limit of detection was 0.006 μg mL−1 and the limit of quantification was found to be 0.248 μg mL−1.
2.6. Confocal Raman spectroscopy (CRS)
The SDZ penetration into the skin was also investigated in CRS studies on porcine ear skin. For incubation, Franz‐type diffusion cells (PermeGear) were used. Representative skin areas were chosen; full‐thickness skin was removed from the cartilage with a scalpel, carefully freed from hair with scissors and attached between the donor and receptor compartment of the diffusion cells having a diffusion area of 0.95 cm2. The receptor compartment was filled with 2 mL of phosphate‐buffered saline pH 7.4 (PBS). To ensure infinite dose conditions, 0.5 mL of the formulations containing 10% (w/w) SDZ were applied to each skin sample. Subsequently, the donor chamber was occluded with Parafilm® to prevent evaporation. The cells were placed in a temperature‐controlled water bath at the skin temperature of 32 ± 0.2°C, and the receptor medium was stirred with magnetic bars.
After 16 hours of incubation time the skin samples were withdrawn from the diffusion cells, wiped with soft tissue soaked in PBS to remove any formulation residues and blotted dry with soft tissue. CRS experiments were carried out using a confocal Raman microspectrometer (gen2 Skin Composition Analyzer, River Diagnostics) with two incorporated lasers, operating at wavelengths of 785 nm for analysis of the skin fingerprint region (400‐2000 cm−1) and 671 nm for analysis of the high wavenumber region (2000‐4000 cm−1). Rapid and simple analysis of the skin can be performed with a spatial depth resolution of 5 μm. Data were collected by a CCD detector. For the measurements, the tissue was gently placed in contact with the fused silica window of the measurement stage of the spectrometer. To ensure an adequate contact and minimise sample damage, minimal pressure was applied.
Fingerprint spectra were recorded from 0 up to a depth of 40 μm in 2 μm increments with an exposure time of 5 seconds per step. For high wavenumber spectra, the acquisition time was 2 seconds per single spectrum. Four profiles were collected at random positions on each skin sample and averaged for further evaluation. At least six individual experiments for each formulation were performed (n ≥ 6).
Additionally, a Raman reference spectrum of the substance to be analysed, SDZ, was generated by dissolving the drug in distilled water and recording a spectrum of the solution in the fingerprint region using an exposure time of 5 seconds per frame. In addition, distilled water used as solvent was measured under the same conditions. For spectral analysis, a difference spectrum was created by subtracting the water spectrum, to remove the Raman intensity bands originating from it.
2.7. CRS data analysis
All spectra collected were analysed using SkinTools® software version 2.0, developed by River Diagnostics. The relative concentration of SDZ was calculated as described by Caspers et al.18 A non‐restricted multiple least‐squares fitting algorithm based on the endogenous skin components was used. This fit model was complemented by adding the previously generated difference reference spectrum of SDZ to the substance library. Each experimental skin spectrum was fitted to the reference spectra; thus, relative concentration profiles of the added component SDZ were obtained. In order to compensate for varying signal intensities, caused by the decrease in Raman signal with deeper probing into the tissue, all fit coefficients were normalised on the keratin signal. Keratin is the dominant protein of the epidermis and its concentration is assumed to stay relatively constant throughout the SC. A baseline correction was performed for all measurements to ensure consistent data evaluation. The lowest obtained value was considered background signal and thus subtracted from each individual data point.
The total penetration depth of SDZ was defined as the SC depth in which the relative concentration of SDZ reached 10% of the observed maximum value, given in per cent of total SC thickness as calculated from water concentration profiles on the same area. Each experiment was analysed separately and the calculated penetration depth was averaged for one formulation.
The thickness of the SC was determined through water concentration profiles.19, 20 Water profiles were generated by calculating the water content from the water to protein ratio.18 It has been reported that the water content across the SC gradually increases from the outside to the viable skin zones21 and stays approximately constant in the viable tissue. By dividing water profile curves into two sections and applying straight lines along the two different reaches, the SC thickness was calculated from the point of intersection of both lines.
2.8. Statistical analysis
Statistical analysis was performed using Microsoft Excel 2010 (Microsoft Corporation) and GraphPad Prism 3.00 (GraphPad Software). Statistical differences were determined using one‐way analysis of variance (ANOVA) followed by the post hoc Tukey test or using Student's t test. In case of repeated measurements, paired t tests were carried out. A P value of <0.05 was considered to indicate statistical significance.
3. RESULTS
3.1. Drug content and pH
An initial characterisation of the prepared hydrogels confirmed their suitability for the subsequent skin penetration studies. All gels exhibited homogeneous transparent appearance with no visible aggregates. The initially determined SDZ content ranged between 88% and 103% and remained in the same range for the whole observation period (data not shown).
The formulation parameters were collected over a maximum period of 20 weeks. In case of hydrogels prepared with HPMC, microbial contamination was visually observed after 12 weeks. Thus, stability monitoring was terminated and in the following, stability data only up to week 10 is given for the HPMC formulations. The hydrogels prepared with HEC remained macroscopically stable over the whole observation period of 20 weeks.
The pH value was determined in regular intervals to detect destabilisation of the formulations induced by potential chemical degradation. The pH values of the fresh formulations were found to be in a narrow range for both gelling agents, around 9.4 for HEC gels and 9.8 for HPMC gels. The behaviour during storage varied significantly depending on the gelling agent. All HEC formulations showed a statistically significant increase in pH over time, leading to values around 10 after 20 weeks. In contrast, the pH values of the HPMC‐based formulations showed a tendency to decrease; statistical significance between initial values and final values was observed only in case of HPMC 3.0% gels (P = 0.01, data not shown).
3.2. Rheological properties
Via flow curves, viscosity changes between shear rates of 1 and 100 s−1 were measured. All gel formulations showed pseudoplastic behaviour, that is decreasing viscosity with increasing shear rate.
The stability study revealed changes of the dynamic viscosity during the initial storage phase of 2 weeks. Thereafter, viscosity values remained largely constant for all formulations over the entire observation period. Figure 1 shows the change in the dynamic viscosity of the two exemplary formulations HEC 5% and HPMC 2% over time compared at a shear rate of 10 s−1. The dynamic viscosity of HEC 5% decreased from 12.53 ± 1.57 Pa·s directly after preparation to 9.49 ± 0.36 Pa∙s in week 2; thereafter, it remained almost constant reaching a value of 8.67 ± 0.15 Pa∙s in week 20. For HPMC 2%, the dynamic viscosity initially decreased from 6.64 ± 1.08 Pa∙s to 4.09 ± 0.39 Pa∙s, continuing with values between 4.20 and 4.62 Pa∙s.
Figure 1.
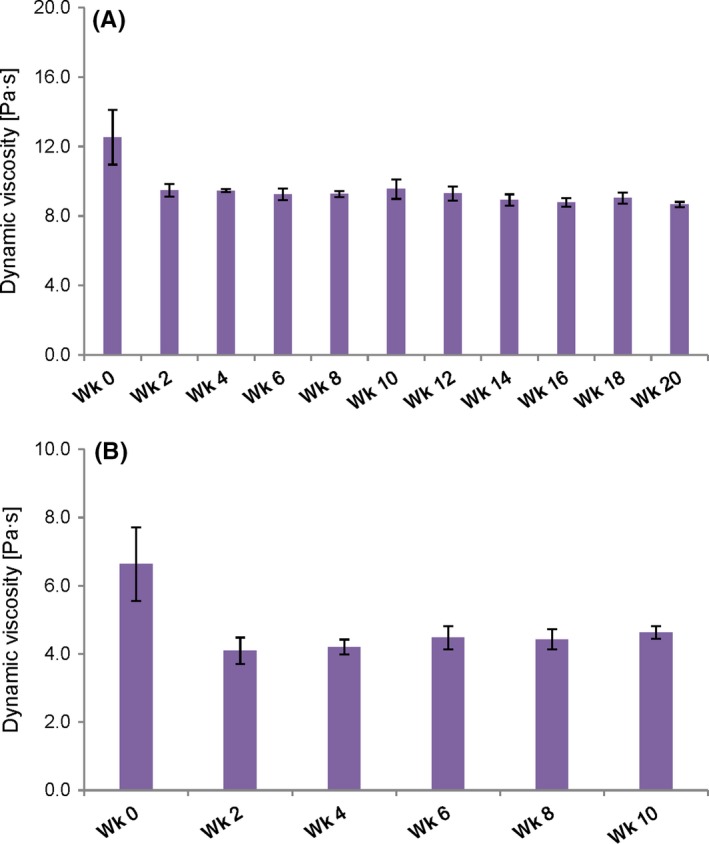
Changes in rheological properties of exemplary formulations over time: Dynamic viscosity of (A) HEC 5% and (B) HPMC 2%, compared at a shear rate of 10 s−1 at 32°C. Measurements were performed every 2 wk; the depicted values are means ± SD of three individual measurements for each formulation (n = 3) [Colour figure can be viewed at http://wileyonlinelibrary.com]
To determine the exact time frame in which these initial changes take place a selection of hydrogels was freshly prepared and their dynamic viscosity was measured daily; the initial change took place within 48 hours after preparation (data not shown). This short transition phase represents the time in which an equilibrium state of the final gel formulation is reached after production. From then on, no significant changes in dynamic viscosity were observed during the whole observation period. Thus, the data obtained after 2 weeks are treated as initial values for the following considerations.
Figure 2 shows the dynamic viscosity of fresh and stored formulations compared at a shear rate of 10 s−1. Overall, the hydrogels revealed no statistically significant changes in the viscosity when comparing the initial (week 2) and final (week 10 or 20) measurement, with P values between 0.06 and 0.42, indicating a satisfying stability. Only in case of HPMC 3%, a significant increase in viscosity was observed after 10 weeks (P = 0.02) which may be a sign for changes in the inner structure of the formulation.
Figure 2.
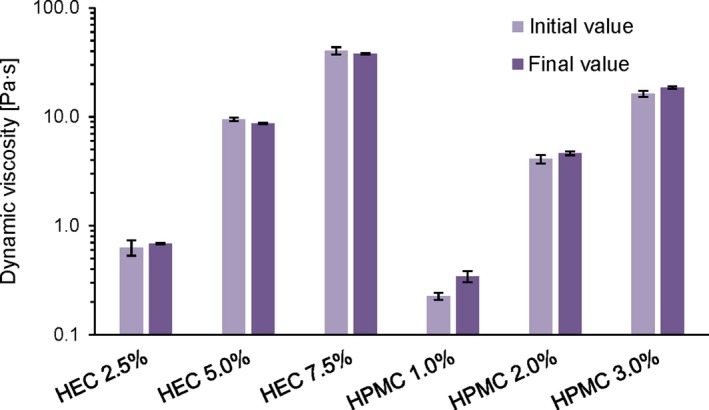
Effect of storage on emulsion viscosity: Comparison of the dynamic viscosity at a shear rate of 10 s−1 at 32°C. Values were determined on fresh emulsions (“initial value”, week 2) and at the end of the stability study (“final value”, corresponding to week 10 for HPMC gels and week 20 for HEC gels, respectively). The depicted values are means ± SD of three individual measurements for each formulation (n = 3) [Colour figure can be viewed at http://wileyonlinelibrary.com]
An overview of the dynamic viscosity for all six gel formulations is given in Table 2. As can be seen, the initial values at a shear rate of 10 s−1 ranged from 0.63 to 40.4 Pa∙s for the HEC gels and 0.23 to 16.3 Pa∙s for the HPMC gels, hence covering a wide viscosity range.
Table 2.
Dynamic viscosity (η) of the hydrogels determined at different times of measurement during the stability study. “Initial” corresponds to the value measured 2 wk after preparation and “Final” corresponds to the last measured value 10 wk (for HPMC hydrogels) and 20 wk (for HEC hydrogels) after preparation. The depicted values are means ± SD of three individual measurements for each formulation (n = 3)
| Formulation | η [Pa∙s] | |
|---|---|---|
| Initial | Final | |
| HEC 2.5% | 0.63 ± 0.10 | 0.69 ± 0.01 |
| HEC 5.0% | 9.49 ± 0.36 | 8.67 ± 0.15 |
| HEC 7.5% | 40.4 ± 3.11 | 38.1 ± 0.57 |
| HPMC 1.0% | 0.23 ± 0.02 | 0.34 ± 0.04 |
| HPMC 2.0% | 4.09 ± 0.39 | 4.62 ± 0.18 |
| HPMC 3.0% | 16.3 ± 1.05 | 18.6 ± 0.51 |
3.3. Tape stripping experiments
In order to compare the penetration ability of SDZ from the different hydrogels and the non‐gelled control formulation, the total drug amount recovered in the skin was calculated (Figure 3). The quantified amounts of SDZ were set into relation to the total amount applied. About 5 mg cm−2 of the formulations were applied to the skin samples; this means an initial quantity of SDZ of 50 μg cm−2 for the formulations due to their loading capacity of 1% (w/w).
Figure 3.
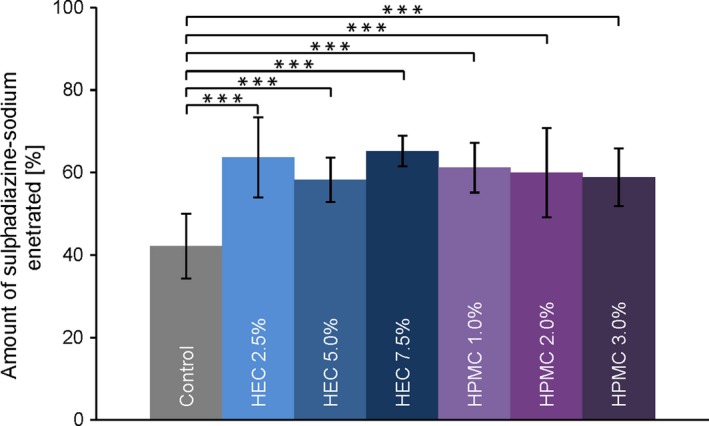
Concentration of sulphadiazine sodium recovered from the stratum corneum after tape stripping, displayed in % of applied dose. Data are presented as means ± SD of at least eight experiments (n ≥ 8). Significant differences were assessed by one‐way analysis of variance (ANOVA) followed by the post hoc Tukey test and are indicated by ***P < 0.001 [Colour figure can be viewed at http://wileyonlinelibrary.com]
The recovered amount was found highly comparable for all gel formulations, independent of type and concentration of the gelling agent used. After the application time of one hour, the summarised mean SDZ amount detected in the SC ranged from 58 ± 5% to 64 ± 4%. Only the SDZ amount penetrated from the control formulation was significantly lower than from the HEC or HPMC hydrogels (42 ± 8%, P < 0.001).
To visualise the characteristics of the observed skin penetration behaviour into the SC, two representative penetration profiles of SDZ from a hydrogel (HEC 2.5%) and the control are given in Figure 4. The distribution of the model drug at different SC depths can be seen.22 For both formulations, a large portion of the drug was located at the skin surface; a considerable difference in the recovered drug amount between the hydrogels and the control was evident for the first tape strip. No such difference regarding drug amount was observed for the following tapes.
Figure 4.
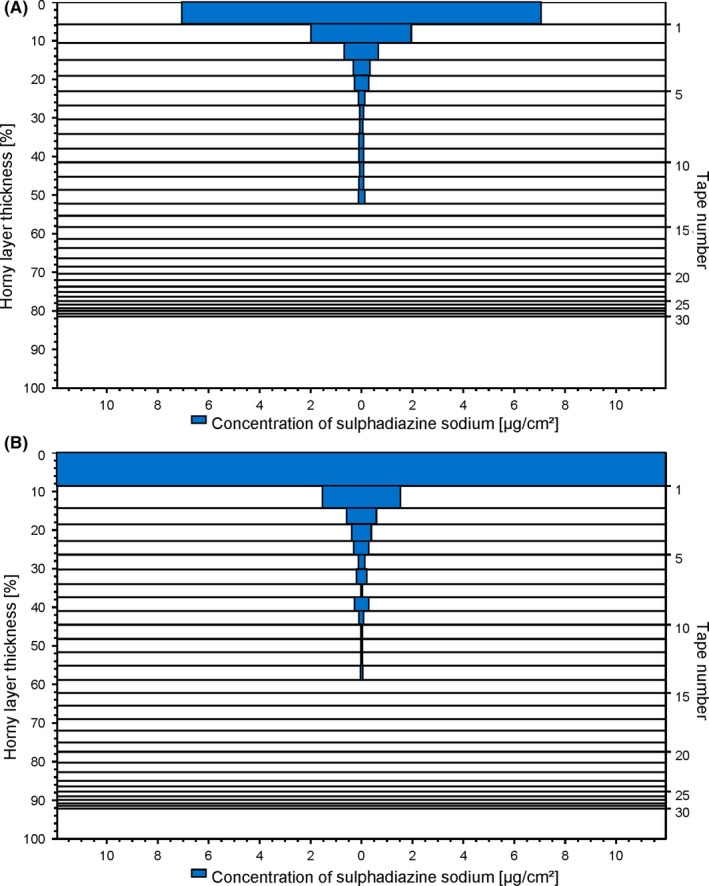
Representative skin penetration profiles of sulphadiazine sodium from (A) hydrogel HEC 2.5% and (B) a non‐gelled control. Each horizontal bar represents the amount of recovered drug on the respective strip; the distance between the lines corresponds to the respective amount of removed stratum corneum [Colour figure can be viewed at http://wileyonlinelibrary.com]
In Figure 5, the penetration depths of SDZ from the gel formations and the control formulation into porcine skin are compared. The highest penetration depth for SDZ was achieved from HPMC 1.0% with 78% ± 17% SC, while from HEC 7.5% it only penetrated the SC to an extent of 47% ± 14%. The findings observed after tape stripping and HPLC analysis revealed interesting general trends. When looking at either group of formulations, separated by gelling agent, an order from high to low total penetration depths with increasing gelling agent concentration can be observed. The attained penetration depth seemed indirectly proportional to the gelling agent concentration of the formulation.
Figure 5.
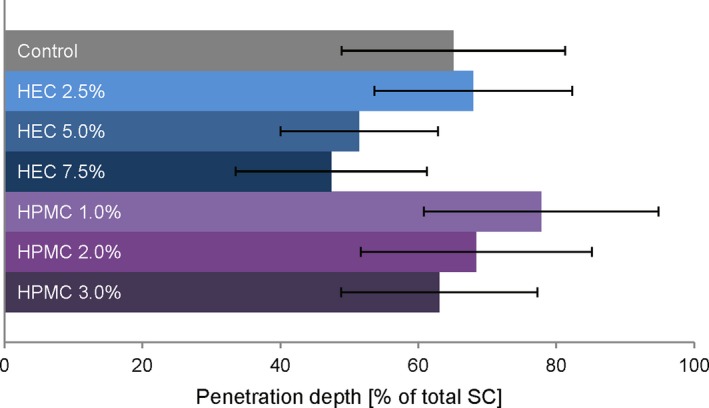
Penetration depths of sulphadiazine sodium from different gel formulations and a non‐gelled control into porcine stratum corneum observed after tape stripping. Data are presented as means ± SD of at least eight experiments (n ≥ 8) [Colour figure can be viewed at http://wileyonlinelibrary.com]
3.4. CRS penetration studies
The suitability of the CRS method for analysis of SDZ was confirmed (Figure 6). The SDZ reference spectrum showed characteristic bands which were detectable in spectra of SDZ‐treated skin. The two prominent bands at 1120 and 1600 cm−1 could be assigned to the SO2 symmetric stretching of the sulphonamide group and a ring stretching mode, respectively.23 Since penetration analysis was influenced by background signal of the skin and the intensity values did not approach zero in some cases, the background was subtracted to correct the baseline.
Figure 6.
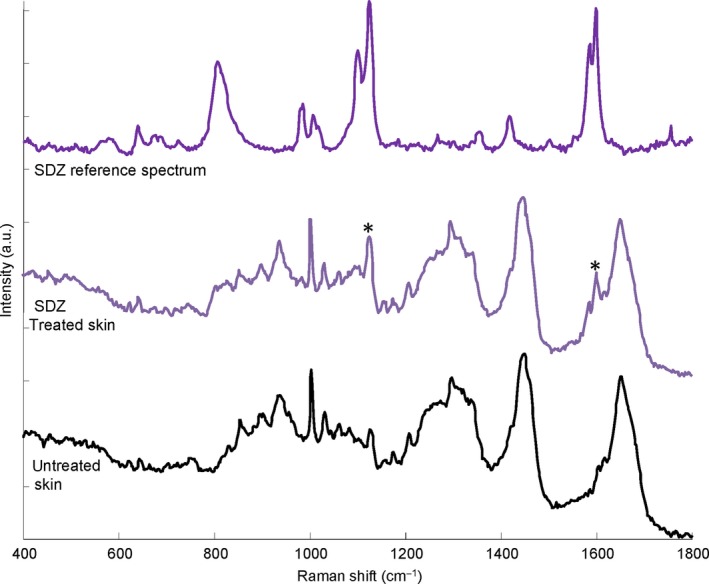
Representative Raman spectra of sulphadiazine solution after subtraction of the solvent spectrum (top), porcine skin treated with sulphadiazine sodium‐containing formulation (middle) and untreated control skin (bottom) in the 400–1800 cm−1 spectral interval. Characteristic substance peaks visible in the treated skin spectrum are marked with asterisks (*) [Colour figure can be viewed at http://wileyonlinelibrary.com]
In Figure 7, the calculated relative SDZ concentrations are plotted against the respective measurement depth to visualise the observed drug penetration behaviour from the different hydrogels against the control. For both HEC‐based hydrogels (Figure 7A) and HPMC‐based hydrogels (Figure 7B), a highly similar penetration behaviour was observed for SDZ irrespective of the type or concentration of the gelling agent (P > 0.05 at any skin depth). All penetration profiles showed an initially high substance concentration at the skin surface followed by a continuous decrease with skin depth until a baseline is reached.
Figure 7.
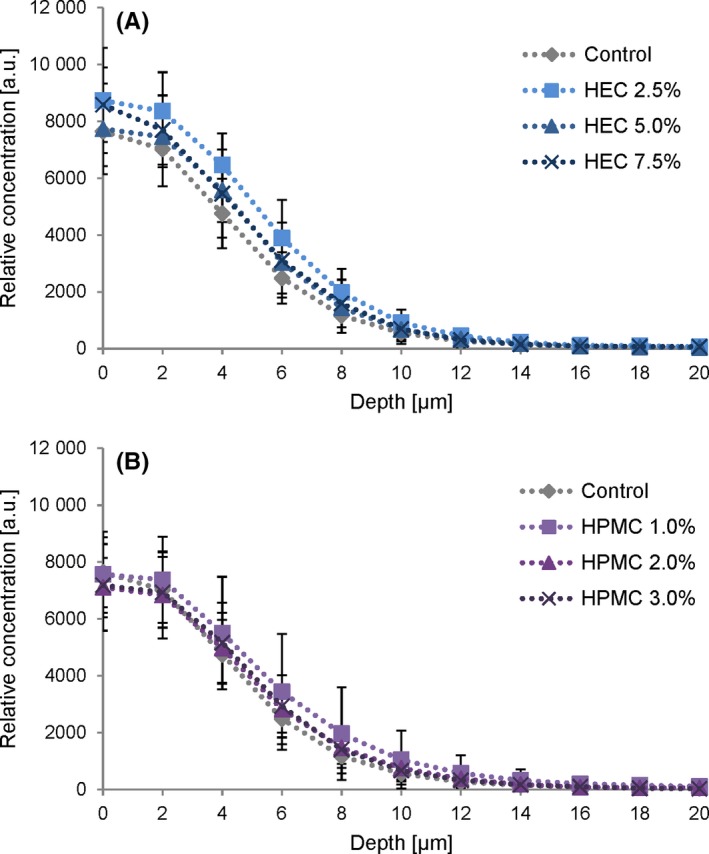
CRS concentration depth profiles of sulphadiazine sodium (SDZ) expressed in arbitrary units. (A) Penetration of SDZ from HEC gel formulations and (B) from HPMC gel formulations compared to the non‐gelled control. Profiles were calculated using a multivariate fitting procedure. Each curve represents mean values ± SD of at least six experiments (n ≥ 6) [Colour figure can be viewed at http://wileyonlinelibrary.com]
The total SDZ penetration depth observed by CRS analysis, that is the detection limit as described in Section 2.7, was found to be between 96% ± 19% of the total SC (for HEC 7.5%) and 113% ± 16% (for HPMC 1.0%). Figure 8 shows the calculated penetration depth of SDZ from all gel formulations and the control formulation as determined by CRS. The differences in the observed penetration depths between formulations did not reach statistical significance (P > 0.05). The overall trends reflected the findings observed in the tape stripping experiments, that is lower penetration depth with increasing gelling agent concentration for both HEC and HPMC.
Figure 8.
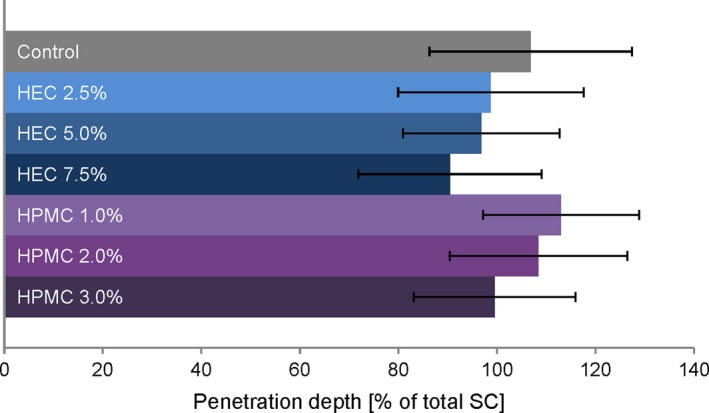
Maximum penetration depths of sulphadiazine sodium from different gel formulations and a non‐gelled control into porcine stratum corneum determined by CRS. Taking into account the maximum Raman intensity of each substance at the skin surface, the detection limit was set at a threshold of 10% of maximum values to determine penetration endpoints. Data are presented as means ± SD of at least six experiments (n ≥ 6) [Colour figure can be viewed at http://wileyonlinelibrary.com]
4. DISCUSSION
In the current work, gel formulations that cover a broad viscosity range were prepared to characterise their skin penetration behaviour. The developed formulations were thickened by adding two common pharmaceutical gelling agents, namely the cellulose ethers HEC and HPMC, in varying quantities. A selection of drug‐loaded hydrogels with SDZ, suitable for the envisioned comparative studies, could be produced. Their dynamic viscosity, studied at a shear rate of 10 s−1, ranged from about 0.2 to roughly 40 Pa∙s. Additionally, a non‐gelled control solution of the drug SDZ was investigated.
The physicochemical stability of the formulations was monitored in regular intervals. While the HPMC hydrogels showed signs of microbial contamination at week 12, the HEC hydrogels remained macroscopically stable. Changes in pH and viscosity seen in some formulations with progressing storage time indicate changes in their inner structure. Interestingly, for all hydrogels, an initial change in the dynamic viscosity took place in the first days after preparation. Presumably, this is owed to the time required for the formation of the final gel structure.
Incorporation of the model drug SDZ, which is both quantifiable by HPLC and Raman active, made it possible to investigate its penetration into the skin applying two commonly used methods with different experimental setups. The initial SDZ content was determined, verifying satisfactory incorporation. Regular evaluation of the SDZ content confirmed the chemical stability of the incorporated drug.
Tape stripping in combination with HPLC analysis allows for the quantitative analysis of the drug's skin penetration and the determination of its penetration depth. In each experiment, 30 tape strips were removed from the skin and analysed. The full quantity of SDZ collected from the skin was related to the total applied drug amount. Highly similar penetrated SDZ concentrations were observed in case of all gelled formulations, independent of their gelling agent concentration. This suggests that the specific viscosity of the investigated hydrogels had a subordinate effect on the skin penetration of incorporated SDZ. In contrast, significantly lower SDZ amounts were recovered from the skin in case of the fluid control. This is primarily due to large differences in SDZ concentration on the first adhesive tape taken from the skin, as is apparent when plotting the distribution of the model drug as function of the tape number. One explanation for this difference might be that even after thorough removal of the excess formulation, a certain portion remains on the skin surface. In case of the hydrogels, which are stickier than the fluid control solution, the amount of residue remaining on the skin surface is likely to be increased. A similar observation with an increased drug concentration on the first tape strip for the more viscous formulation was made in a previous study.8 In other words, diligent cleaning of the skin removes more drug in case of an aqueous drug solution which is subsequently not available for penetration and thus analysis.
In contrast to the very similar drug amounts observed in the tape stripping studies, the penetration depths observed for SDZ showed a different trend. Here, the gelling agent concentration seemed to have an influence on the total penetration depth of SDZ. Both for the hydrogels with HEC and HPMC, penetration depths were reduced as the viscosity of the gels increased. The diffusion of the model drug out of the formulation and into the skin might have been hindered by the high viscosity of the systems and thus resulted in a limited total penetration depth.24 In conclusion, drug distribution within the skin appeared to be affected by the viscosity of the vehicle.
Next, CRS penetration studies were performed. The Raman spectrum of pure SDZ exhibits characteristic bands that differ from the typical skin spectrum; these substance bands that are visible in the spectrum of treated skin enabled the tracking of SDZ inside the skin. CRS skin studies showed highly comparable penetration profiles for all investigated formulations, including the non‐gelled control. The relative amount of substance detected in the skin did not differ significantly in case of the different hydrogel formulations and the control, independent of the skin depth. This finding indicates that the general skin penetration behaviour of the model drug is unaffected by the concentration of gelling agent and thus the viscosity of the system, confirming the findings of the tape stripping studies.
Again, in contrast to the relative observed drug amounts, the SDZ penetration depth determined with CRS appeared to be dependent on the gelling agent concentration and thus viscosity of the formulations. Interestingly, reduced penetration depths with increasing concentrations were observed for both gelling agents using CRS. This is in agreement with the trends of the tape stripping results.
In regard to the observed penetration depths obtained with the two different experimental setups, namely tape stripping and CRS, different values were obtained. In case of tape stripping, penetration depths between 47% and 78% of total SC thickness were observed. In case of CRS, these values ranged between 90% and 113% of SC thickness. The noticeably higher penetration depths with CRS might be the consequence of the prolonged incubation time of 16 hours.
In summary, a direct comparison of the results obtained with the two techniques revealed different absolute drug penetration depths. However, similar trends could be observed despite the varied experimental setup. It is crucial to consider factors such as the applied amount of formulation, incubation time and handling of the skin samples when discussing the results. For the tape stripping experiments, a commonly used approach with finite dose application and short incubation time was chosen. This setup resembles in vivo conditions where usually only a limited amount of formulation is applied and briefly allowed to absorb. In contrast, CRS studies were performed according to a previously described protocol by Lunter.25 Overnight incubation under infinite dose conditions was chosen to ensure sufficient detection of the model drug by CRS. These differences in the experimental setup were reflected in the divergent findings regarding the determined skin penetration depth. In this context, the incubation time clearly is an important aspect to consider. Due to the prolonged residence time of the formulation on the skin, the time for the diffusion of the incorporated drug towards the skin surface and into the skin is prolonged too, allowing the drug to penetrate deeper into the skin. However, regardless of the incubation time applied, the order from high to low total penetration depths with increasing gelling agent concentration could still be observed.
Taken together, the viscosity of hydrogel formulations seems to play a subordinate role for the skin penetration of an incorporated model drug. The findings suggest a minor impairment of the drug's ability to diffuse out of the formulation into the skin with increasing viscosity, but the differences did not reach statistical significance. Thus, no clinically relevant effect of modified viscosity on the skin penetration of hydrophilic actives is expected when using the investigated gelling agent concentrations. Apart from that, a certain viscosity is considered to be beneficial in order to prevent the “run‐off” of the formulation and thus enhance its residence time on the skin.5 Thus, moderate viscosity is advisable when designing new formulations.
5. CONCLUSION
The skin penetration of a model drug from different hydrogels was independent of the exact dynamic viscosity of the formulations. We conclude that moderately enhanced hydrogel viscosity is advisable to allow for convenient dermal application while maintaining satisfying skin penetration.
ACKNOWLEDGEMENTS
The financial support of the research platform “Characterisation of Drug Delivery Systems on Skin and Investigation of Involved Mechanisms” is gratefully acknowledged.
Binder L, Mazál J, Petz R, Klang V, Valenta C. The role of viscosity on skin penetration from cellulose ether‐based hydrogels. Skin Res Technol. 2019;25:725‐734. 10.1111/srt.12709
REFERENCES
- 1. Shinde UA, Modani SH, Singh KH. Design and development of repaglinide microemulsion gel for transdermal delivery. AAPS PharmSciTech. 2018;19:315‐325. [DOI] [PubMed] [Google Scholar]
- 2. Aggarwal N, Goindi S, Khurana R. Formulation, characterization and evaluation of an optimized microemulsion formulation of griseofulvin for topical application. Colloids Surf B Biointerfaces. 2013;105:158‐166. [DOI] [PubMed] [Google Scholar]
- 3. El Laithy HM, El‐Shaboury KMF. The development of cutina lipogels and gel microemulsion for topical administration of fluconazole. AAPS PharmSciTech. 2002;3(4):77‐85. [DOI] [PMC free article] [PubMed] [Google Scholar]
- 4. Baumgartner S, Kristl J, Peppas NA. Network structure of cellulose ethers used in pharmaceutical applications. Pharm Res. 2002;19(8):1084‐1090. [DOI] [PubMed] [Google Scholar]
- 5. Batheja P, Sheihet L, Kohn J, Singer AJ, Michniak‐Kohn B. Topical drug delivery by a polymeric nanosphere gel: formulation optimization and in vitro and in vivo skin distribution studies. J Control Release. 2011;149(2):159‐167. [DOI] [PubMed] [Google Scholar]
- 6. Telò I, Del FE, Cantù L, et al. Gel‐like TPGS‐based microemulsions for imiquimod dermal delivery: role of mesostructure on the uptake and distribution into the skin. Mol Pharm. 2017;14(10):3281‐3289. [DOI] [PubMed] [Google Scholar]
- 7. Salerno C, Carlucci AM, Bregni C. Study of in vitro drug release and percutaneous absorption of fluconazole from topical dosage forms. AAPS PharmSciTech. 2010;11(2):986‐993. [DOI] [PMC free article] [PubMed] [Google Scholar]
- 8. Klang V, Schwarz JC, Matsko N, et al. Semi‐solid sucrose stearate‐based emulsions as dermal drug delivery systems. Pharmaceutics. 2011;3(2):275‐306. [DOI] [PMC free article] [PubMed] [Google Scholar]
- 9. Cross SE, Jiang R, Benson HAE, Roberts MS. Can increasing the viscosity of formulations be used to reduce the human skin penetration of the sunscreen oxybenzone? J Invest Dermatol. 2001;117(1):147‐150. [DOI] [PubMed] [Google Scholar]
- 10. Welin‐Berger K, Neelissen JAM, Bergenståhl B. The effect of rheological behaviour of a topical anaesthetic formulation on the release and permeation rates of the active compound. Eur J Pharm Sci. 2001;13(3):309‐318. [DOI] [PubMed] [Google Scholar]
- 11. Binder L, Kulovits EM, Petz R, et al. Penetration monitoring of drugs and additives by ATR‐FTIR spectroscopy/tape stripping and confocal Raman spectroscopy – a comparative study. Eur J Pharm Biopharm. 2018;130:214‐223. [DOI] [PubMed] [Google Scholar]
- 12. Jacobi U, Kaiser M, Toll R, Mangelsdorf S, Audring H, Otberg N. Porcine ear skin: an in vitro model for human skin. Skin Res Technol. 2007;13(1):19‐24. [DOI] [PubMed] [Google Scholar]
- 13. Schmook FP, Meingassner JG, Billich A. Comparison of human skin or epidermis models with human and animal skin in in‐vitro percutaneous absorption. Int J Pharm. 2001;215(1–2):51‐56. [DOI] [PubMed] [Google Scholar]
- 14. Choe C, Schleusener J, Lademann J, Darvin ME. Human skin in vivo has a higher skin barrier function than porcine skin ex vivo – comprehensive Raman microscopic study of the stratum corneum. J Biophotonics. 2018;11:e201700355. [DOI] [PubMed] [Google Scholar]
- 15. Darlenski R, Sassning S, Tsankov N, Fluhr JW. Non‐invasive in vivo methods for investigation of the skin barrier physical properties. Eur J Pharm Biopharm. 2009;72(2):295‐303. [DOI] [PubMed] [Google Scholar]
- 16. Klang V, Hoppel M, Valenta C. Infrared densitometry for in vitro tape stripping: quantification of porcine corneocytes In: Humbert P, Maibach H, Fanian F, Agache P, eds. Measuring the Skin. Cham: Springer International Publishing; 2016:1‐8. [Google Scholar]
- 17. Franzen L, Windbergs M, Hansen S. Assessment of near‐infrared densitometry for in situ determination of the total stratum corneum thickness on pig skin: influence of storage time. Skin Pharmacol Physiol. 2012;25(5):249‐256. [DOI] [PubMed] [Google Scholar]
- 18. Caspers PJ, Lucassen GW, Carter EA, Bruining HA, Puppels GJ. In vivo confocal Raman microspectroscopy of the skin: noninvasive determination of molecular concentration profiles. J Invest Dermatol. 2001;116(3):434‐442. [DOI] [PubMed] [Google Scholar]
- 19. Crowther JM, Sieg A, Blenkiron P, et al. Measuring the effects of topical moisturizers on changes in stratum corneum thickness, water gradients and hydration in vivo. Br J Dermatol. 2008;159(3):567‐577. [DOI] [PubMed] [Google Scholar]
- 20. Egawa M, Hirao T, Takahashi M. In vivo estimation of stratum corneum thickness from water concentration profiles obtained with raman spectroscopy. Acta Derm Venereol. 2007;87(1):4‐8. [DOI] [PubMed] [Google Scholar]
- 21. Warner RR, Myers MC, Taylor DA. Electron probe analysis of human skin: determination of the water concentration profile. J Invest Dermatol. 1988;90(2):218‐224. [DOI] [PubMed] [Google Scholar]
- 22. Lademann J, Meinke MC, Schanzer S, et al. In vivo methods for the analysis of the penetration of topically applied substances in and through the skin barrier. Int J Cosmet Sci. 2012;34:551‐559. [DOI] [PubMed] [Google Scholar]
- 23. Sutherland WS, Laserna JJ, Angebranndt MJ, Winefordner JD. Surface‐enhanced Raman analysis of sulfa drugs on colloidal silver dispersion. Anal Chem. 1990;62:689‐693. [DOI] [PubMed] [Google Scholar]
- 24. Leite‐Silva VR, De Almeida MM, Fradin A, Grice JE, Roberts MS. Delivery of drugs applied topically to the skin. Expert Rev Dermatol. 2012;7(4):383‐397. [Google Scholar]
- 25. Lunter DJ. Determination of skin penetration profiles by confocal Raman microspectroscopy: statistical evaluation of optimal microscope configuration. J Raman Spectrosc. 2017;48(2):152‐160. [Google Scholar]