

Abstract
Background
Canada’s population is aging, with nearly forty percent of Canadians aged 50 years or more. As the population ages, unique challenges related to health are becoming evident, including increasing rates of sexually transmitted and bloodborne infections. Understanding the epidemiology of HIV in older adults is important to guide prevention and control programs.
Objective
To assess trends in newly diagnosed cases of HIV in Canada among those aged 50 years and older (≥50 years) and those aged less than 50 (<50 years), and to compare their basic demographic characteristics and exposure categories for the period of 2008 to 2017.
Methods
National surveillance of HIV is conducted by the Public Health Agency of Canada through voluntary submission of data by provincial/territorial public health authorities. Descriptive analyses were conducted on reported cases of HIV between January 1, 2008, to December 31, 2017 to compare the demographic profiles and exposure category for the two age groups.
Results
Between 2008 and 2017, the proportion of newly diagnosed HIV cases among those ≥50 years increased from 15.1% to 22.8%. The HIV diagnosis rates for both older males and older females increased over time, with a relatively higher increase for females. A higher proportion of newly diagnosed HIV cases were male in the older group (81.2%) compared to the younger group (74.6%). Among both older and younger males, the most common exposure category for HIV was being gay, bisexual and other men who have sex with men (gbMSM), followed by heterosexual contact and injection drug use; however, the relative proportions varied by age with the gbMSM category being higher in the <50 group.
Conclusion
In Canada, over 20% of all newly diagnosed cases of HIV are now in people 50 years of age and older. HIV testing and prevention initiatives, historically aimed at younger populations, may not have the same impact for older populations. These data can be used to inform future public health actions designed to address HIV in older populations.
Keywords: HIV, surveillance, gay, bisexual, men who have sex with men, people who inject drugs, 50 years of age and older
Introduction
Globally, there were an estimated 36.9 million individuals living with HIV in 2017 (1), and more than 10% of the adult population living with HIV in low and middle-income countries is estimated to be 50 years of age or older (≥50 years) (2). In developed nations, those ≥50 years comprise an estimated 30% of adults living with HIV (3). Due to continued advances in HIV treatment, the number and proportion of people living with HIV at an older age is likely to continue to grow (4); it is predicted that the number of those ≥50 years living with HIV in low and middle-income will increase by 47% to 6.9 million by 2020 (5).
The proportion of Canada’s population aged ≥50 years has increased 12.7% in the past five years and is now nearly 40% (6). As Canadians grow older (and live longer), they face a number of challenges related to the maintenance and promotion of health. For older Canadians living with HIV, they also live with the possibility of accelerated aging, side effects of prolonged antiretroviral use (7) and higher rates of non-AIDS-related comorbidities such as diabetes, cancer and cardiovascular disease (4,8). Thus, the HIV epidemic poses serious concerns in older adults because of physical, mental and psychological issues that accompany both aging and HIV infection (9,10). With aging national and global populations, understanding the epidemiology of HIV in older adults is important to help guide awareness and prevention programs.
The objective of this analysis is to assess trends in newly diagnosed cases of HIV in Canada in populations ≥50 years of age and those younger than 50 years (<50 years), and to compare the basic demographic characteristics and exposure categories of these two populations for the period of 2008 to 2017.
Methods
The study used data from the national HIV/AIDS Surveillance System (HASS) maintained by the Public Health Agency of Canada (PHAC) (11). The HASS is a passive, case-based surveillance system that collates non-nominal data on persons newly diagnosed with HIV in Canada and submitted to PHAC by provincial and territorial public health authorities. Details on the surveillance methods have been described previously (11,12).
Data on age, sex and exposure categories were analyzed in cases of HIV reported between January 1, 2008 and December 31, 2017. Cases were stratified into two groups: one composed of those ≥50 years at diagnosis; and one composed of those <50 years at diagnosis. The exposure categories used in HIV surveillance are noted in Table 1 and are used in a hierarchy (11) to reflect the single most likely mode of transmission for HIV even if the case had multiple exposures categories.
Table 1. List of exposure categories and descriptions used in HIV national surveillance (11).
| Exposure Category | Reported type of exposure |
|---|---|
| Gay, bisexual and other men who have sex with men (gbMSM) | Male-to-male sexual contact |
| People who inject drugs (PWID) | Use of injection drugs |
| gbMSM-PWID | Male-to-male sex and the use of injection drugs |
| Heterosexual/endemica (Het-Endemic) |
A person born in a country where HIV is endemic who reports heterosexual sex |
| Heterosexual/risk (Het-Risk) |
Heterosexual sex with someone who is either HIV-infected or who is at increased risk of HIV infection (e.g. a person who injects drugs, a male who has male sex partners or a person from an HIV-endemic country) |
| Heterosexual/no identified risk (Het-NIR) |
Heterosexual sex, when heterosexual contact is the only risk factor reported and nothing is known about the HIV-related factors associated with the partner |
| Other | Perinatal exposure, occupational exposure or receipt of transfusion of blood or clotting factors, out of country, and any other exposure |
a The Public Health Agency of Canada defines countries where HIV is endemic as those countries where the prevalence of HIV among adults (age 15–49 years) is 1.0% or greater and one of the following criteria also applies: 50% or more of newly diagnosed HIV cases are attributed to heterosexual transmission; a male to female ratio of 2:1 or less among prevalent infections; or HIV prevalence greater than or equal to 2% among women receiving prenatal care
Quebec does not submit data on exposure category to PHAC so newly diagnosed cases from Quebec were excluded from analyses involving exposure category. Separate Chi-square tests were conducted to compare the distribution of exposure categories between the older and younger groups for both males and females. All rates were calculated using population denominators from the Annual Demographic Statistics, issued by Statistics Canada (13).
Results
There were 22,534 newly diagnosed cases of HIV between 2008 and 2017 and virtually all of the cases (99.8%) included data on age (n=22,486). Overall, 19.7% of these individuals (n=4,438) were ≥50 years of age, representing a 39.1% increase in the number of newly diagnosed cases of HIV in that group. The number of new HIV diagnoses for those ≥50 years of age increased from 15.1% in 2008 to 22.8% in 2017 (Figure 1). Similarly, the HIV diagnosis rate among this older age category increased from 3.5 per 100,000 population in 2008 to 3.9 per 100,000 population in 2017. The HIV diagnosis rate for the younger group was higher than for the older group, and fluctuated over this period, but decreased from 9.9 per 100,000 population in 2008 to 8.0 per 100,000 population in 2017.
Figure 1.
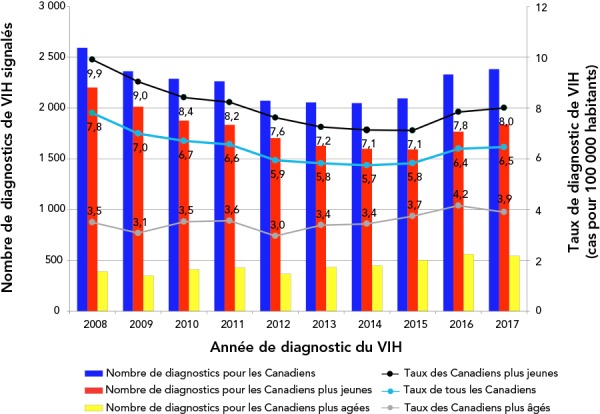
Reported numbers and rates (per 100,000 population) of HIV diagnoses in older (≥50 years), younger (<50 years) and all Canadians where age was reported, 2008–2017a
Population data source: Annual Demographic Statistics, Statistics Canada (13)
a Excludes cases with unknown age at HIV diagnosis
Age group and sex distribution
From 2008 to 2017, data on age and sex were available for 22,413 (99.4%) of the 22,534 newly diagnosed HIV cases. Of those, 81.2% were males in ≥50 years of age compared with 74.6% in males <50 years (data not shown). The corresponding rates of HIV diagnosis were higher in males than females in both age groups. The rate for both males and females ≥50 years of age increased over time, with the relative increase being higher among females (from 1.0 to 1.6 per 100,000 population for females and from 6.6 per 100,000 to 6.5 per 100,000 population for males). In those <50 years of age, rates for both males and females decreased over time, with the decrease among females being proportionately greater (from 5.6 per 100,000 population to 4.2 per 100,000 for females, and from 14.1 per 100, 000 population to 11.7 per 100,000 population for males) (Figure 2).
Figure 2.

Annual rates (per 100,000 population) of new HIV diagnoses by age category and sex, Canada, 2008–2017a,b
Abbreviations: ≥50, age 50 years and older; <50, younger than 50 years of age
a Population data source: Annual Demographic Statistics, Statistics Canada (13)
b Excludes cases where age at HIV diagnosis is unknown. Excludes cases where sex is transgender, transsexual, other, unknown or not reported
Exposure category distribution
From 2008 to 2017, there were 14,751 new HIV diagnoses with known age, sex and exposure category (65%). Since the gay, bisexual and other men who have sex with men (gbMSM) exposure category only applied to males, analysis of the exposure category variable was done separately by sex. Among both older and younger males, gbMSM was the most common exposure category, followed by heterosexual contact and the injection drug use exposure categories. There were more younger males in the gbMSM (62.4%) than in the older males (48.0%). Conversely, there were fewer males who identified the heterosexual contact category in the younger group (18.3%) than the older group (32.0%). The proportion attributed to the injection drug use category was similar in both groups: 14.4% among older males; and 12.5% among younger males (Table 2).
Table 2. Number and proportion of newly diagnosed HIV cases by age category, sex and exposure category—Canada (excluding Quebec), 2008–2017a–c.
| Exposure category | Males | Females | ||||||
|---|---|---|---|---|---|---|---|---|
| Younger than 50 years | 50 years and older | Younger than 50 years | 50 years and older | |||||
| n | % | n | % | n | % | n | % | |
| gbMSM | 5,723 | 62.4 | 957 | 48.0 | N/A | 0.0 | N/A | 0.0 |
| gbMSM/PWID | 348 | 3.8 | 47 | 2.4 | N/A | 0.0 | N/A | 0.0 |
| PWID | 1,150 | 12.5 | 288 | 14.4 | 898 | 29.0 | 78 | 16.0 |
| Othera | 277 | 3.0 | 63 | 3.2 | 244 | 7.9 | 44 | 9.0 |
| Heterosexual contact | 1,675 | 18.3 | 639 | 32.0 | 1,953 | 63.1 | 367 | 75.1 |
| Het-Endemic | 522 | 5.7 | 121 | 6.1 | 867 | 28.0 | 126 | 25.8 |
| Het-Risk | 464 | 5.1 | 240 | 12.0 | 620 | 20.0 | 129 | 26.4 |
| Het-NIR | 689 | 7.5 | 278 | 13.9 | 466 | 15.1 | 112 | 22.9 |
| Subtotalb | 9,173 | - | 1,994 | - | 3,095 | - | 489 | - |
| No identifiable risk | 403 | 3.0 | 152 | 4.2 | 143 | 3.1 | 27 | 3.2 |
| Exposure category unknown or not reported (“missing”) | 3,850 | 28.7 | 1,448 | 40.3 | 1,322 | 29.0 | 317 | 38.1 |
| Total | 13,426 | - | 3,594 | - | 4,560 | - | 833 | - |
Abbreviations: gbMSM, gay, bisexual and other men who have sex with men; Het-Endemic, heterosexual/endemic; Het-NIR, Heterosexual/no identifiable risk; Het-Risk, heterosexual/risk; N/A, not applicable; PWID; people who inject drugs; -, not applicable
a “Other” includes clotting, blood, occupational exposure, out of country, perinatal, blood/clotting exposures and other
b Includes only cases where age at HIV diagnosis, sex, and exposure category is known and reported
c Chi-square test was significant (p<0.0001) when comparing between age groups for older and younger males, and also for older and younger females
Among females, heterosexual contact was the most frequent exposure category was highest in both age groups, but was relatively higher in ≥50 years of age (75.1% versus 63.1%). Conversely, the proportion of cases within the people who inject drugs exposure category was relatively higher in <50 years (29.0% vs 16.0%). Within the heterosexual contact exposure category, the proportion attributed to persons born in HIV-endemic countries was similar for both age categories (25.8% ≥50 years; 28.0% <50 years) (Table 2). The distribution of HIV diagnoses across exposure categories was significantly different between younger and older populations for both males and females (Chi-square test; p<0.0001).
From 2008 to 2017, the exposure category distribution by age did not change considerably for males or females (data not shown). For example, for males, gbMSM continued to be the most frequent of exposure category over time, whereas heterosexual contact continued to be the most frequent exposure category in females.
Discussion
In Canada, over 20% of all newly diagnosed cases of HIV are now in people 50 years of age and older. The number of new HIV diagnoses in the older age group increased by 39.1% from 2008 to 2017; likewise, the rate of new HIV diagnoses over this time also increased. This trend is in contrast to the younger age category, which experienced an overall decrease in both the proportion and rate of new HIV diagnoses over the same period; these changes over time were seen in both males and females, although the relative changes were greater among females. The largest proportion of new diagnoses was reported among the gbMSM exposure category, accounting for almost half of older males and two thirds of younger males.
The increasing trend in HIV diagnoses among older adults has been observed in other countries as well. The 20% incidence falls between the UNAIDS global estimates of 10% (for low and middle-income countries) (2) and 30% (for developed countries) (3). In the United Kingdom, the number of new HIV infections decreased over the years; whereas, the number and proportion of new diagnoses in people ≥50 years of age continued to increase (14). Comparatively, a recent analysis of data from the European Surveillance System compared older people (aged ≥50 years) to younger people (aged 15–49 years) in 2014 and 2015. The average notification rate of new diagnoses in older adults increased, primarily, in the eastern European Union/European Economic Area countries. The analysis also found that people ≥50 years of age are more likely to acquire HIV via heterosexual contact and to present late (15). In contrast, in the United States, HIV diagnoses among people ≥50 years decreased by 7% between 2011 and 2015 (16). This trend was also observed in New York City, where the number of new HIV diagnoses from 2001 to 2017 decreased significantly overall and for those ≥50 years (17).
Increased HIV testing may explain part of the increase in HIV diagnoses in older Canadians. British Columbia saw an overall increase in the rate of HIV testing since 2011, and the testing rates for those ≥50 years increased from 2011 to 2016 (18). A large proportion of new diagnoses were reported among the gbMSM exposure category (almost half for older males and two thirds for younger males), which remains the primary driver of the HIV epidemic in Canada (12). In general, the gbMSM population continues to be disproportionately affected by HIV. In Ontario, the percent of tests increased in the gbMSM population from 17.7% in 2007 to 28.6% in 2016 (19). Testing may also include HIV-negative gbMSM, who are at higher risk, since testing is the first step in considering preventative approaches such as preexposure prophylaxis (20).
In addition to these testing initiatives, there are several other possible reasons for the increasing proportions and rates in those ≥50 years of age, including low rates of condom use among older individuals (21–23), a lack of prioritization of HIV prevention efforts in older adults (24) and a tendency to a relatively late diagnosis in this population (23), enabling forward transmission. In the United States, older people (≥50 years) are more likely to have late-stage HIV infection at the time of diagnosis, and therefore start treatment later (16). Older adults are likely to be diagnosed with HIV-related medical disorders later in the course of their illness compared with their younger counterparts (25). In Canada, diagnoses of females who are ≥50 years of age have increased since 2008 and heterosexual contact was the most frequently reported exposure category for this age group (as well as for the younger females).
This increase in HIV diagnoses in older females could be partly due to older women being less concerned with the risks of pregnancy and, therefore maybe more likely to engage in unprotected sex (22,26–28). The observed increase in annually reported HIV diagnoses may also be attributed in part to previous positive HIV diagnoses, where a person may be tested and reported as a new diagnosis more than once due to inter-provincial migration or migration into Canada after a HIV diagnosis outside of Canada. However, for the time being it is not possible to assess the impact of previous diagnosis by age group, as this information is not available. The increase of newly diagnosed cases of HIV in adults who are ≥50 years of age has important implications. Older adults have different demographics and risk factors than younger adults, and testing and prevention initiatives, which have historically been aimed at a younger population, may not have the same effectiveness for an older population. Targeting interventions to the distinct characteristics of this older population may be required. PHAC will continue to provide updates on the status of HIV in this population as these data can be used to inform future public health actions designed to address HIV in older populations.
Limitations
While surveillance data describe the diagnosed portion of the epidemic, national HIV estimates of prevalence and incidence provide an overall picture of the HIV epidemic in Canada, and include people with both diagnosed and undiagnosed HIV infection (29). Data on new diagnoses represent only those individuals who have been tested and diagnosed with HIV, and do not represent the full spectrum of all people who are living with HIV. In addition, these data do not provide information on the time that these individuals were infected. The analysis in this study was limited to variables with relatively complete data, such as age, sex and exposure category. Finally, these data may include a subset of individuals who were previously diagnosed with HIV in another province (or country). Other limitations to HASS have been described elsewhere (12).
Conclusion
In Canada over 20% of all newly diagnosed cases of HIV are now in people 50 years of age and older. National HIV testing and prevention initiatives historically aimed at younger populations may not have the same impact for older populations. These data can be used to inform future public health actions designed to address HIV in older populations.
Acknowledgements
The Public Health Agency of Canada would like to acknowledge all of the data providers from the provincial and territorial HIV/AIDS programs for their contribution and participation.
Conflict of interest: None.
Funding: This work was supported by the Public Health Agency of Canada.
References
- 1.Joint United Nations Programme on HIV/AIDS. UNAIDS Data 2018. UNAIDS; 2018. https://www.unaids.org/en/resources/documents/2018/unaids-data-2018 [PubMed]
- 2.Joint United Nations Programme on HIV/AIDS. HIV and aging – A special supplement to the UNAIDS report on the global AIDS epidemic UNAIDS; 2013. https://reliefweb.int/report/world/hiv-and-aging-special-supplement-unaids-report-global-aids-epidemic-2013
- 3.Joint United Nations Programme on HIV/AIDS. The GAP REPORT 2014: People aged 50 years and older. UNAIDS; 2014. https://www.unaids.org/sites/default/files/media_asset/12_Peopleaged50yearsandolder.pdf
- 4.Wing EJ. HIV and aging [PubMed]. Int J Infect Dis 2016. Dec;53:61–8. 10.1016/j.ijid.2016.10.004 [DOI] [PubMed] [Google Scholar]
- 5.Joint United Nations Programmed on HIV/AIDS. Get on the Fast-Track: The life cycle approach to HIV. UNAIDS: 2016. https://www.unaids.org/sites/default/files/media_asset/Get-on-the-Fast-Track_en.pdf
- 6.Statistics Canada. Age (in Single Years) and Average Age (127) and Sex (3) for the Population of Canada, Provinces and Territories, Census Metropolitan Areas and Census Agglomerations, 2016 and 2011 Censuses. Ottawa (ON): StatsCan; 2017. https://www12.statcan.gc.ca/census-recensement/2016/dp-pd/dt-td/Rp-eng.cfm?TABID=2&Lang=E&APATH=3&DETAIL=0&DIM=0&FL=A&FREE=0&GC=0&GID=1235625&GK=0&GRP=1&PID=109523&PRID=10&PTYPE=109445&S=0&SHOWALL=0&SUB=0&Temporal=2016&THEME=115&VID=0&VNAMEE=&VNAMEF=&D1=0&D2=0&D3=0&D4=0&D5=0&D6=0
- 7.Cahill S, Valadéz R. Growing older with HIV/AIDS: new public health challenges [PubMed]. Am J Public Health 2013. Mar;103(3):e7–15. 10.2105/AJPH.2012.301161 [DOI] [PMC free article] [PubMed] [Google Scholar]
- 8.Rodriguez-Penney AT, Iudicello JE, Riggs PK, Doyle K, Ellis RJ, Letendre SL, Grant I, Woods SP; HIV Neurobehavioral Research Program HNRP Group. Co-morbidities in persons infected with HIV: increased burden with older age and negative effects on health-related quality of life [PubMed]. AIDS Patient Care STDS 2013. Jan;27(1):5–16. 10.1089/apc.2012.0329 [DOI] [PMC free article] [PubMed] [Google Scholar]
- 9.önen NF, Overton ET, Seyfried W, Stumm ER, Snell M, Mondy K, Tebas P. Aging and HIV infection: a comparison between older HIV-infected persons and the general population [PubMed]. HIV Clin Trials 2010. Mar-Apr;11(2):100–9. 10.1310/hct1102-100 [DOI] [PubMed] [Google Scholar]
- 10.Guaraldi G, Zona S, Brothers TD, Carli F, Stentarelli C, Dolci G, Santoro A, Beghetto B, Menozzi M, Mussini C, Falutz J. Aging with HIV vs. HIV seroconversion at older age: a diverse population with distinct comorbidity profiles [PubMed]. PLoS One 2015. Apr;10(4):e0118531. 10.1371/journal.pone.0118531 [DOI] [PMC free article] [PubMed] [Google Scholar]
- 11.Public Health Agency of Canada. HIV and AIDS in Canada: Surveillance Report to December 31, 2014. Ottawa (ON): PHAC; 2015. https://www.canada.ca/en/public-health/services/publications/diseases-conditions/hiv-aids-canada-surveillance-report-december-31-2014.html
- 12.Haddad N, Li JS, Totten S, McGuire M. HIV in Canada-Surveillance Report, 2017 [PubMed]. Can Commun Dis Rep 2018. Dec;44(12):348–56. 10.14745/ccdr.v44i12a03 [DOI] [PubMed] [Google Scholar]
- 13.Statistics Canada. Annual Demographic Estimates: Canada, Provinces and Territories. 2017. Ottawa (ON): StatsCan; 2018. https://www150.statcan.gc.ca/n1/en/catalogue/91-215-X
- 14.Youssef E, Wright J, Delpech V, Davies K, Brown A, Cooper V, Sachikonye M, de Visser R. Factors associated with testing for HIV in people aged ≥50 years: a qualitative study [PubMed]. BMC Public Health 2018. Oct;18(1):1204. 10.1186/s12889-018-6118-x [DOI] [PMC free article] [PubMed] [Google Scholar]
- 15.Tavoschi L, Gomes Dias J, Pharris A; EU/EEA HIV Surveillance Network. New HIV diagnoses among adults aged 50 years or older in 31 European countries, 2004-15: an analysis of surveillance data [PubMed]. Lancet HIV 2017. Nov;4(11):e514–21. 10.1016/S2352-3018(17)30155-8 [DOI] [PubMed] [Google Scholar]
- 16.Centers for Disease Control and Prevention. HIV Among People Aged 50 and Older. Atlanta (GA): CDC; 2016. https://www.cdc.gov/hiv/group/age/olderamericans/index.html
- 17.New York City Department of Health and Mental Hygiene. HIV Surveillance Annual Report, 2017. Queens (NY): NYC Health; 2018. https://www1.nyc.gov/assets/doh/downloads/pdf/dires/hiv-surveillance-annualreport-2017.pdf
- 18.British Columbia Centre for Excellence in HIV/AIDS. HIV Monitoring Quarterly Report for British Columbia - Fourth Quarter 2018. Vancouver (BC): BC-CfE; 2019. http://stophivaids.ca/qmr/2018-Q4/#/bc
- 19.Ontario HIV Epidemiology and Surveillance Initiative. HIV testing in Ontario, 2016. Toronto (ON): OHESI; 2018. http://ohesi.ca/documents/OHESI-HIV-testing-in-Ontario-in-2016.pdf
- 20.Flowers P, Estcourt C, Sonnenberg P, Burns F. HIV testing intervention development among men who have sex with men in the developed world [PubMed]. Sex Health 2017. Feb;14(1):80–8. 10.1071/SH16081 [DOI] [PubMed] [Google Scholar]
- 21.Schick V, Herbenick D, Reece M, Sanders SA, Dodge B, Middlestadt SE, Fortenberry JD. Sexual behaviors, condom use, and sexual health of Americans over 50: implications for sexual health promotion for older adults [PubMed]. J Sex Med 2010. Oct;7 Suppl 5:315–29. 10.1111/j.1743-6109.2010.02013.x [DOI] [PubMed] [Google Scholar]
- 22.Public Health Agency of Canada. Questions & Answers: Prevention of sexually transmitted and blood borne infections amoung older adults. Ottawa (ON): PHAC. https://www.canada.ca/en/public-health/services/infectious-diseases/sexual-health-sexually-transmitted-infections/reports-publications/questions-answers-adults.htm
- 23.Youssef E, Cooper V, Delpech V, Davies K, Wright J. Barriers and facilitators to HIV testing in people age 50 and above: a systematic review [PubMed]. Clin Med (Lond) 2017. Dec;17(6):508–20. 10.7861/clinmedicine.17-6-508 [DOI] [PMC free article] [PubMed] [Google Scholar]
- 24.Harris TG, Rabkin M, El-Sadr WM. Achieving the fourth 90: healthy aging for people living with HIV [PubMed]. AIDS 2018. Jul;32(12):1563–9. 10.1097/QAD.0000000000001870 [DOI] [PMC free article] [PubMed] [Google Scholar]
- 25.Pilowsky DJ, Wu LT. Sexual risk behaviors and HIV risk among Americans aged 50 years or older: a review [PubMed]. Subst Abuse Rehabil 2015. Apr;6:51–60. 10.2147/SAR.S78808 [DOI] [PMC free article] [PubMed] [Google Scholar]
- 26.Orel NA, Spence M, Steele J. Getting the message out to older adults: effective HIV health education risk reduction publications. J Appl Gerontol 2005;24(5):490–508. 10.1177/0733464805279155 [DOI] [Google Scholar]
- 27.Drew O, Sherrard J. Sexually transmitted infections in the older woman [PubMed]. Menopause Int 2008. Sep;14(3):134–5. 10.1258/mi.2008.008020 [DOI] [PubMed] [Google Scholar]
- 28.Negin J, Rozea A, Martiniuk AL. HIV behavioural interventions targeted towards older adults: a systematic review [PubMed]. BMC Public Health 2014. May;14:507. 10.1186/1471-2458-14-507 [DOI] [PMC free article] [PubMed] [Google Scholar]
- 29.Public Health Agency of Canada. Summary: Estimates of HIV incidence, prevalence and Canada’s progress on meeting the 90-90-90 HIV targets, 2016. Ottawa (ON): PHAC. https://www.canada.ca/en/public-health/services/publications/diseases-conditions/summary-estimates-hiv-incidence-prevalence-canadas-progress-90-90-90.html