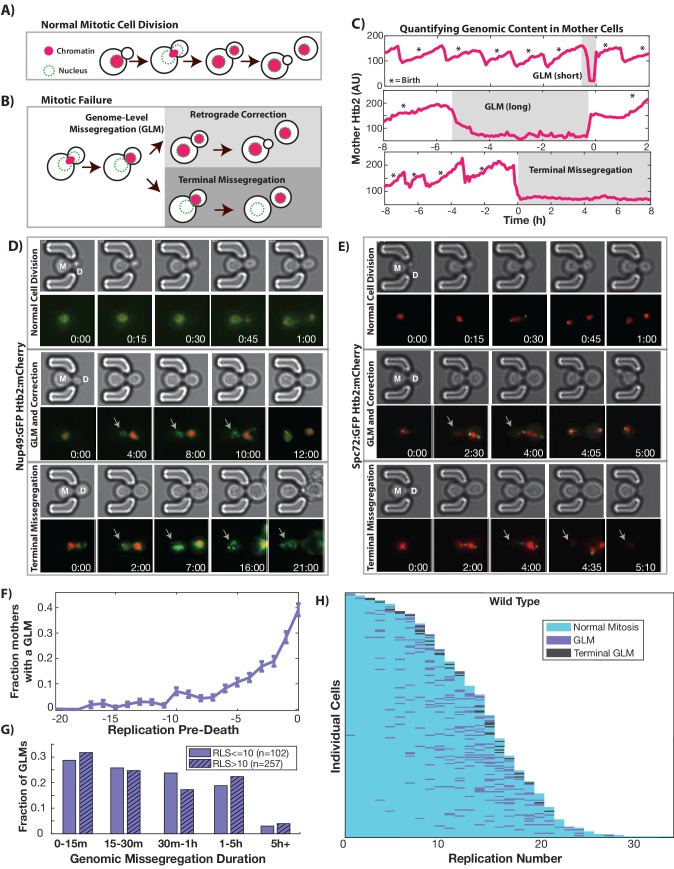
Figure 1. During replicative aging cells frequently undergo dramatic genomic missegregation events.
(A) Schematic showing the process of a normal cell division where chromatin (red) doubles during S-phase and is divided between mother and daughter during mitosis. (B) Aging cells frequently experience Genome Level Missegregation (GLM) events where most genomic material enters the daughter while the nuclear envelope appears in both cells. Usually this missegregation is corrected through retrograde transport of genomic material back into the mother cell (top), allowing mother cells to go on to divide and produce more daughters. If not corrected and cytokinesis occurs (bottom), this becomes a terminal event wherein mother cells replicatively senesce. (C) Representative single cell traces of mother Htb2 levels showing missegregation (shaded) and active retrograde correction events. GLMs can be resolved quickly (top) or resolution can take hours (middle). A GLM becomes terminal (bottom) if it is not corrected. (*) indicates the formation of new buds, and both cells where the GLM is corrected produce additional daughters. AU indicates arbitrary units. (D) Time-lapse dynamics showing a normal cell division (top, mother cell replicative age 6), a GLM that is corrected (middle, mother cell replicative age 14) and a terminal missegregation (bottom, mother cell replicative age 12) in cells co-expressing Htb2:mCherry and Nup49:GFP. During both GLMs the nuclear envelope is clearly visible in both mother (M) and daughter (D) cells. See Video 1. (E) Time-lapse dynamics showing a normal cell division (top, mother cell replicative age 12), a GLM that is corrected (middle, mother cell replicative age 13) and a terminal missegregation (bottom, mother cell replicative age 16) in cells expressing Htb2:mCherry and Spc72:GFP. Both spindle poles can be seen to enter the daughter (D) during these events, and during the correction event a spindle pole returns to the mother (M). In the terminal missegregation, the spindle pole fails to reenter the mother cell. See Video 2. Times are indicated in hours:mins from the start of the displayed time-lapse, not the start of the experiment. Arrows indicate mother cells which have lost DNA via a GLM. (F) Missegregation probabilities increase dramatically near the end of replicative lifespan. n = 410 mother cells examined, and error bars are SEM. (G) Many GLMs are corrected within an hour, but some events can last several hours, and the duration of events is not influenced by the replicative age of the mother cell (p>0.05, Student’s t-test). Terminal missegregation events were excluded from the analysis. (H) Survival curve showing the dynamics of individual wild-type mother cells. Each row is a separate mother cell, and the color indicates whether a cell experienced a normal cell cycle, GLM or terminal missegregation (n = 200 randomly selected cells).

