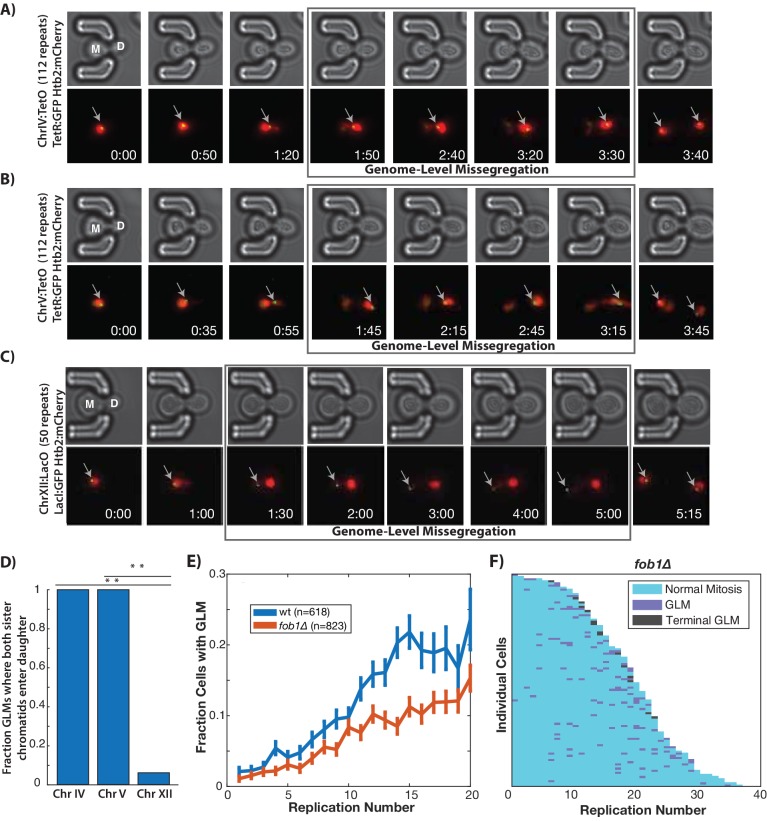
Figure 2. GLMs are linked to rDNA instability.
(A) Direct observation of Chr IV using TetR:GFP and TetO repeats on Chr IV. When the cell experiences a GLM, both chromatids of Chr IV move to the daughter along with the majority of the chromatin. Following correction and anaphase, a single green dot can be seen in both mother (M) and daughter (D) cells. Mother cell replicative age equals five at the beginning of this timelapse. GFP contains an NLS to increase the nuclear concentration, and is only localized to a dot at the site of the chromosome. (B) Direct observation of Chr V using TetR:GFP and TetO repeats on Chr V. When the cell experiences a GLM, both chromatids of Chr V move to the daughter along with the majority of the chromatin. Following the correction, a single green dot can be seen in both mother and daughter cells. Mother cell replicative age equals 19 at the beginning of this timelapse. (C) Direct observation of Chr XII using LacI:GFP and LacO repeats on Chr XII. Unlike the other chromosomes, when the cell experiences a missegregation event, both chromatids of Chr XII remain behind in the mother. Following correction, a single green dot can be seen in both mother and daughter cells. Mother cell replicative age equals eight at the beginning of this timelapse. The gray arrows mark the location of the labeled chromosomes. Times are indicated in hours:mins. (D) Quantification of the fraction of observed GLM events where each chromosome pair entered the daughter or remained in the mother (p<0.001 using bootstrapping with replacement). (E) Removal of FOB1 increases stability at the rDNA and reduces GLM rates, but fails to abolish an increase in GLMs during aging (curve shows mean and error bars are SEM, p<0.05 determined by Cochran Q-test). (F) Survival curve showing the GLM dynamics in individual fob1∆ mother cells. Each row is a separate mother cell, and the color indicates whether a cell experienced a normal cell cycle, GLM or terminal missegregation (n = 100 randomly selected cells).


