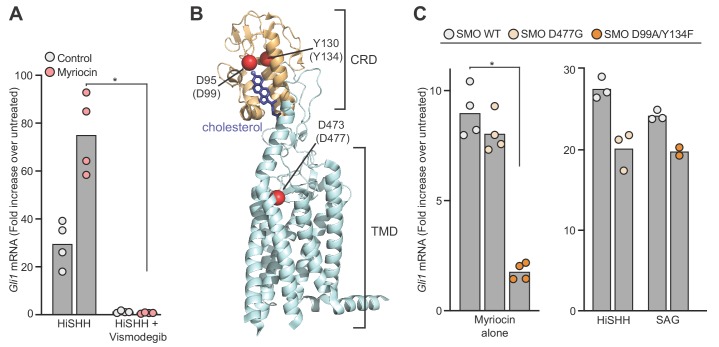
Figure 4. Sphingomyelin depletion potentiates hedgehog signaling at the level of Smoothened.
(A) HH signaling triggered by HiSHH (25 nM) in the presence or absence of Vismodegib (2.5 µM) in NIH/3T3 cells treated with myriocin. (B) Human SMO in complex with cholesterol (PDB 5L7D) highlighting two residues in the CRD (D95 and Y130) critical for cholesterol binding and a residue (D473) in the transmembrane domain (TMD) critical for binding to the agonist SAG. Numbering for mouse SMO, used in our studies, is denoted in parenthesis. (C) HH signaling triggered by myriocin alone in Smo-/- MEFs stably expressing the indicated variants of mouse SMO. A control experiment (right) shows that the SMO variants respond appropriately to either SAG (100 nM) or SHH (50 nM), demonstrating protein integrity. Note that the D477G and D99A/Y134F mutations abrogate responses to SAG and SHH, respectively (Luchetti et al., 2016). In (A) and (C), bars denote the mean value derived from the measurements shown (n = 4 for A, n = 2–4 in C). Statistical significance (p-value=0.0286 for both A and C) was determined by the Mann-Whitney test.


