

Abstract
The Na+K+2Cl− cotransporter-2 (Nkcc2, Slc12a1) is abundantly expressed in the kidney and its inhibition with the loop-diuretics bumetanide and furosemide has been linked to transient or permanent hyperglycemia in mice and humans. Notably, Slc12a1 is expressed at low levels in hypothalamic neurons and in insulin-secreting β-cells of the endocrine pancreas. The present study was designed to determine if global elimination of one of the Slc12a1 products, i.e., Nkcc2 variant a (Nkcc2a), the main splice version of Nkcc2 found in insulin-secreting β-cells, has an impact on the insulin and glucagon secretory responses and fuel homeostasis in vivo. We have used dynamic tests of glucose homeostasis in wild-type mice and mice lacking both alleles of Nkcc2a (Nkcc2aKO) and assessed their islet secretory responses in vitro. Under basal conditions, Nkcc2aKO mice have impaired glucose homeostasis characterized by increased blood glucose, intolerance to the sugar, delayed/blunted in vivo insulin and glucagon responses to glucose, and increased glycemic responses to the gluconeogenic substrate alanine. Further, we provide evidence of conserved quantitative secretory responses of Nkcc2aKO islets within a context of increased islet size related to hyperplastic/hypertrophic glucagon- and insulin-positive cells (α-cells and β-cells, respectively), normal total islet Cl− content, and reduced β-cell expression of the Cl− extruder Kcc2.
Keywords: glucagon, glucose homeostasis, insulin, Slc12a1/Nkcc2a, Slc12a5/Kcc2
INTRODUCTION
The family of solute carriers Slc12a includes seven genes encoding cation-chloride cotransporters (31). These are Na+K+2Cl− (Slc12a1 and Slc12a2), Na+Cl− (Slc12a3), and K+Cl– (Slc12a4, Slc12a5, Slc12a6, and Slc12a7) ion translocators involved in cell volume homeostasis, epithelial secretion, regulation of the intracellular Cl− concentration, GABA and glycine signaling (24), hydroelectrolytic balance (14) and in the modulation of insulin (20), vasopressin (42) and renin secretion (54, 55). Several of these Cl− transporters, e.g., Slc12a2 (Nkcc1) and Slc12a4 (Kcc1), are considered ubiquitously distributed whereas other members of the Slc12a family appear to display a relatively restricted expression pattern. For instance, Slc12a1 (Nkcc2) is abundantly expressed in the tubular cells of thick ascending loop of Henle (TAL) (6) whereas Slc12a5 (Kcc2) is highly expressed in most mature central neurons (37). However, comparatively low levels of these two cotransporters have also been found in different cell types. Insulin-secreting β-cells of the endocrine pancreas, for instance, express Nkcc2 (4) and three splice variants of Kcc2, one of them not found in neurons (44). In addition, low expression levels of Kcc2 and Nkcc2 have been found in chromaffin cells (84) and neurons of the supraoptic and paraventricular nuclei of the hypothalamus (42), respectively.
Three main spliced transcripts define Nkcc2 expression in the kidney, i.e., Nkcc2a, (Slc12a1 v1), Nkcc2b (Slc12a1 v3), and Nkcc2f (Slc12a1 v2). They are characterized by the inclusion of a unique exon coding for most of the predicted second transmembrane domain of the protein (13, 51, 62). The functional and clinical significance of the renal Nkcc2 is well established (14, 74), and elimination of all Nkcc2 variants in mice results in a severe and lethal dehydration phenotype (80). However, the functional role of extra-renal Nkcc2 remains poorly defined. Recent reports suggest that Nkcc2 may have physiological roles in global fuel homeostasis, particularly when considering that Nkcc2 is found in hypothalamic (42) and in insulin-secreting β-cells (4). In this respect, male mice homozygous for the nonlethal missense inactivating mutation I299F in the Slc12a1 gene (Nkcc2I299F) display borderline hypoglycemia after an overnight fasting while exhibiting low body weight, fat content, and a global phenotype suggestive of hypohydration (39, 40). However, contrary to the Nkcc2I299F model, mice lacking Nkcc2b or Nkcc2a are normo-reninemic at baseline and show a subtle kidney phenotype related to minimal decrease in urine osmolality under dehydrating conditions (54, 55).
In spite of the fact that under basal conditions Nkcc2a appears to play a minor or redundant role in kidney function (55), in a similar degree to that of Nkcc2a in β-cell insulin secretion (5), recent data have provided evidence for a hidden and potentially adaptive role of Nkcc2 in different cell types, which under normal conditions express almost undetectable levels of this cotransporter (4, 33, 76). For instance, Nkcc2 is marginally expressed in β-cells (4), but its expression increases in the absence of Nkcc1 or when these cells were chronically treated with the loop-diuretic bumetanide (BTD) (3). Similarly, endogenous Nkcc2 expression increases in cells chronically subjected to mild osmotic challenge (76). Along the same lines, chronic osmotic stress, a potent stimulus for hypothalamic arginine-vasopressin (AVP) secretion (11, 46) stimulates Nkcc2 expression and function in AVP-expressing neurons, which under normal conditions barely express Nkcc2 (33, 42). In addition, dehydration-dependent stimulation of AVP neurons, and secretion of AVP, are blocked by BTD and furosemide, respectively (42). Therefore, when considering the facts that AVP stimulates hepatic gluconeogenesis (83), insulin and glucagon secretion (22, 25, 56), a potential role for Nkcc2 in the modulation of fuel homeostasis emerges. Interestingly, the association between acute BTD and furosemide administration and impaired glucose homeostasis in mice has long been suggested (67–71). In humans, however, the chronic effects of this group of diuretics on carbohydrate metabolism have been variable (23, 28), observations potentially explained by the long-term adaptation and tolerance developed to chronic diuretic treatment in some patients (41). Therefore, it is conceivable that Nkcc2 may have a functional impact in global fuel homeostasis either directly by modulating islet physiology and/or indirectly through changes in the hydro-electrolytic balance and/or tissue glucose production.
Here, we present evidence suggesting that under basal conditions Nkcc2aKO mice are intolerant to glucose, a finding that correlates with increased blood glucose, plasma insulin, and glucagon. In addition, Nkcc2aKO mice display inadequate insulin and glucagon responses to administered glucose or fasting and increased glycemic responses to alanine suggestive of increased hepatic gluconeogenesis. Notably, primary islets lacking Nkcc2a exhibit conserved quantitative insulin secretion and normal islet total Cl− content, although within the context of increased β- and α-cell mass and reduced expression of the Cl− extruder Kcc2.
MATERIALS AND METHODS
Animals.
The studies involving mice were carried out in accordance with relevant guidelines and regulations and have been approved by the Institutional Animal Care and Use Committee (IACUC). Mice with homozygous deficiency in Nkcc2a were generated after mating heterozygous breeders kindly provided by Dr. Hayo Castrop (University of Regensburg) (55). Adult (8–10 wk old) wild-type and null mice (Nkcc2aWT and Nkcc2aKO, respectively) were used. The body weight (BW) of ~10-wk-old male mice was not different among genotypes (Nkcc2aWT: 26.0 ± 0.3 g, n = 23, and Nkcc2aKO: 27.6 ± 1.1 g n = 19, P = 0.2403). Similarly, the BW of female mice of both genotypes was comparable, i.e., Nkcc2aWT: 20.8 ± 0.2 g (n = 21) and Nkcc2aKO: 23.1 ± 0.7 g (n = 23), P = 0.0857. All animals had ad libitum access to water and normal chow (Teklad 22/5 no. 8640, 3.0 kcal/g) and were housed under 12:12-h light and dark cycles. Fasting was achieved by placing mice in clean cages without food but water starting either at 7–8 AM until 1–2 PM on the same day (morning fast, ~6 h) to minimize hormonal changes and sympathetic activity due to metabolic stress (7, 36, 48). Mice were genotyped by PCR using genomic DNA extracted from the tip of the mouse's tail.
Materials and immunochemicals.
General chemicals and stock solutions were from Sigma (St. Louis, MO). Collagenase was from Worthington Biochemical (Lakewood, NJ) or Sigma. Culture media low/high in glucose (RPMI/DMEM) were form Thermo Scientific (Rockford, IL). Antibodies against insulin were from Cell Marque/Sigma (Rocklin, CA). Mouse monoclonal IgG1 antibodies against glucagon (K79bB10) were from Abcam (Cambridge, MA). Rabbit anti-human Nkcc1 antibodies directed against residues 223RID HYR HTA AQL GEK LLR P241 were from Aviva Systems Biology (no. OABB01332) or Abcam (ab59791). The latter, directed against the NH2 terminus of human NKCC1 and validated against knockout tissues/cells (30, 43), was used for immunoblotting experiments. Antibodies against Kcc2 (no. 07-432) directed against residues 932–1043 of the rat Kcc2 were from EMD Millipore (Billerica, MA). These antibodies have also been validated against knockout tissues (19). β-Actin antibodies (JLA20) were from Developmental Studies Hybridoma Bank (University of Iowa). Secondary Cy3-, AF488-, DyLight405-, or horseradish peroxidase-conjugated antibodies were from Jackson ImmunoResearch Laboratories (West Grove, PA). Microscopy materials were from Electron Microscopy Sciences (Hatfield, PA).
Plasma insulin, glucagon, and AVP.
Insulinemia was determined in plasma samples obtained from fasted mice at 0 (basal), 5, 10, 15, 20, and 30 min after a single intraperitoneal injection of glucose (2.0 g/kg, stimulated), or randomly at 3:00 PM (fed). Blood was collected with the help of heparinized capillary tubes (Scientific Glass, Rockwood, TN), transferred to PCR tubes on ice, and centrifuged at 10,000 g. Plasma samples were stored at −80°C until use. Insulin concentration was determined by using a mouse ELISA kit (no. 10-1247-01; Mercodia, Winston-Salem, NC) following manufacturer's instructions. Plasma glucagon was determined at the Mouse Metabolic Phenotypic Center, University of Cincinnati. AVP was determined in plasma samples obtained from 6 h-fasted mice. We used a competitive ELISA (no. ADI-900-017A; Enzo Life Sciences, Farmingdale, NY) following the manufacturer's instructions.
Islet isolation and secretory response.
Islets for secretory studies were isolated from 10-wk-old male mice, cultured in RPMI1640 for 24–48 h before sorting according to their diameters. Fifteen islets equivalent were assayed for glucose-stimulated insulin secretion as described previously (44). Total islet insulin content was determined by ELISA (no. 10-1247-01; Mercodia) in acidified ethanol (75% ethanol/1.5% HCl) extracts obtained after islets were incubated overnight at –20°C. Total protein content of islets was estimated by using the Bradford method (Protein Assay Kit; ThermoFisher Science, Waltham, MA).
Intraperitoneal glucose, insulin, and alanine/pyruvate tolerance tests.
Glucose homeostasis in mice was evaluated in fasted mice as described previously (3, 5). Briefly, blood glucose was determined in a drop of whole blood by using a glucometer (FreeStyle-Lite, Abbott, IL) under basal conditions or serially after administration of 2.0 g/kg d-glucose (glucose tolerance test) or 0.75 U/kg of human recombinant insulin (HumulinR Eli Lilly, Indianapolis, IN; insulin tolerance test). Alanine and pyruvate tolerance tests were performed essentially as described previously (47, 53, 72, 77, 85). Briefly, 2.0 g/kg of alanine or pyruvate dissolved in sterile saline were injected (intraperitoneally) to fasted mice. Blood glucose was determined from blood samples taken at 15, 30, 60, and 120 min.
Immunofluorescence microscopy and morphometrics.
Mice were transcardially perfused for tissue histology using saline and freshly prepared 4% p-formaldehyde. The α- and β-cells of the islets in pancreas sections were immunolabeled with antibodies against glucagon and insulin, respectively, and against Nkcc1 or Kcc2 coupled to fluorophore-conjugated secondary antibodies as described previously (44). When DyLight405-conjugated antibodies were used to visualize insulin-positive β-cells, images were taken in grayscale instead of blue color to increase contrast against red- and green-stained antigens. Immunostained islets or endocrine cell areas (µm2), α- and β-cell density (number of cells/islet area), and background corrected fluorescence intensity were computed using NIH ImageJ software (v1.48r, https://imagej.nih.gov/ij/) (1) on digital pictures taken at medium or high magnification (×400 to ×600, calibrated scale: 4.7–6.3 pixels/µm, respectively) using oil immersion objectives (×60; Olympus Epi Fluorescence Spot Scope) with a color camera as reported (5). Cell volume was estimated from individual cross-sectional cell diameters corresponding to insulin- or glucagon-positive cells and assuming spherical shape. Three-dimensional surface plots of immunolabeled islets were obtained by using the Interactive 3D Surface Plot plugin of ImageJ (1).
Determination of total islet Cl− content.
The total intracellular content of Cl− in mouse islets was determined by using calibrated ion-selective electrodes (Orion-Thermo Scientific, Rockford, IL) as described previously (3). Net Cl− uptake in islets was calculated and expressed as nanomoles Cl− per μg of total protein. BTD-sensitive Cl− uptake was defined as the difference between Cl− accumulated under isotonic conditions to that obtained in the presence of BTD 5 min.
Reverse transcription and polymerase chain reaction.
Total RNA for reverse transcription and polymerase chain reaction (RT-PCR) experiments was obtained from freshly isolated mouse islets as described previously (44). To minimize cross contamination, total RNA from mouse kidneys were purchased from Zyagen (San Diego, CA) and processed after all experiments involving islets were finished. RT-PCR was performed essentially as described previously (4). The sets of primers used to amplify Nkcc2 and Gapdh control transcripts were as follows (5′ to 3′): TGC TCT TCA TTC GCC TCT CCT GGA TTG TAG and CCT ATG TAG GCG ACG GTG GTG ATG AAA ATG (Nkcc2 sense and antisense, respectively, 700 bp amplicon) and GTG AAG GTC GGA GTC AAC GGA TTT and CAC AGT CTT CTG GGT GGC AGT GAT (Gapdh sense and antisense, respectively, 555 bp amplicon). RT-PCR products were resolved on 2% agarose gels stained with ethidium bromide. Gels were visualized in an ultraviolet transiluminator and directly photographed by using the ChemiDoc MP Imaging System with Image Laboratory Software (Bio-Rad, Berkeley, CA). The digital images obtained by using this imaging system were inverted for clarity, cropped to exclude gel edges or empty/nonrelevant lanes and directly used without further digital modification.
Western blot analysis.
Proteins extracts from primary mouse islets were obtained as described previously (75). Briefly, 75 µg of whole lysates were loaded onto precasted 4–12% Bis-Tris Plus gels (Blot; Invitrogen/ThermoFisher Science). Electrophoresis was performed at 100 V and the gel was blotted onto PDVF membranes 9 min at room temperature by using the iBlot-2 Gel Transfer Device (Invitrogen). After transference, membranes were cut into two pieces using the ~70 kDa protein marker as a reference. The top and bottom portions of the membrane were simultaneously blocked in Superblock buffer (no. 37537; ThermoFisher Science) for 1 h at room temperature and subsequently incubated 24–48h at 4°C with gentle rocking in the presence of primary antibodies (Nkcc1 1:1,000; Kcc2 1:250; or β-actin 1:4,000). Membranes were developed with proper secondary horseradish peroxidase-antibodies. We used ChemiDoc MP Imaging System with Image Laboratory Software (Bio-Rad) to detect antigen-antibody reactions directly on PVDF membranes. High-resolution grayscale digital images taken by using this imaging system were cropped to exclude irrelevant lanes and directly used without further digital modification.
Statistical analysis.
Data are expressed as means ± SE. The difference between the means of two populations was determined using Student’s two-tailed t test after a preliminary F test to determine homogeneity of within-group variances. Tukey’s honestly significant difference post hoc test was used to identify individual group differences. We also used the Mann-Whitney test and Tukey’s two-way ANOVA for multiple groups. The trapezoidal method was used to calculate the area under the curve of tolerance tests (AUC in mM/min). A P < 0.05 was considered significant.
RESULTS
Increased blood glucose, plasma insulin, glucagon, and glucose responses to exogenous alanine in Nkcc2aKO mice.
As shown in Fig. 1, A–C, blood glucose, plasma insulin and glucagon in 6 h-fasted male and female Nkcc2aKO mice were significantly higher than those of Nkcc2aWT. To determine whether these changes exist within the context of increased plasma AVP, the hormone was measured in 6 h-fasted mice. As expected for normohydrated Nkcc2aKO mice (55), plasma AVP in 6 h-fasted mice did not significantly differ among genotypes or sexes [male Nkcc2aWT: 1.49 ± 0.43 pmol/L and Nkcc2aKO: 0.97 ± 0.12 pmol/L, P = 0.257; female Nkcc2aWT: 0.74 ± 0.20 pmol/L and Nkcc2aKO: 0.95 ± 0.23 pmol/mL, P = 0.942 (n = 7–8)], as shown in Fig. 1D. Since short-term fasting does not increase glucagon-mediated hepatic glucose production in normal mice (9), we next interrogated hepatic gluconeogenesis as a potential source of increased basal blood glucose in 6 h-fasted Nkcc2aKO mice. To this end, blood glucose responses to a single dose of alanine (2 g/kg) were determined in mice of both genotypes and sexes. We chose alanine tolerance tests to indirectly assess hepatic gluconeogenesis because this amino acid is almost exclusively converted to glucose in the liver (2, 49, 50, 53, 72, 79) and 6 h-fasted normal mice do not show glycemic responses to acutely administered alanine (53, 72). As shown in Fig. 1E, the acute glucose responses of Nkcc2aKO mice to exogenous alanine are significantly increased when compared against Nkcc2aWT mice, which had the expected flat glycemic responses (53, 72). Therefore, these data can be interpreted as suggestive of increased hepatic gluconeogenesis in 6 h-fasted Nkcc2aKO mice.
Fig. 1.

Nkcc2aKO mice exhibit increased basal blood glucose, plasma insulin, and hepatic gluconeogenesis. A–D: box and whisker plots representing fasting (6 h) values of blood glucose (A), plasma insulin (B), glucagon (C), and arginine-vasopressin (AVP; D) obtained in male and female mice of each genotype (Nkcc2aKO and Nkcc2aWT). Shown are the means (horizontal bars), the number of determinations (open or closed circles), the distribution of values (upper and lower quartiles, box), the lowest and highest values (whiskers), and the statistical significance of the noted means (*P < 0.01). The mean ± SE values of fasting blood glucose (mM), plasma insulin (pmol/L), and glucagon (pg/ml) are shown at the bottom of each graph. E: serial blood glucose responses of 6 h-fasted Nkcc2aWT and Nkcc2aKO mice (closed and open circles, respectively) to injected alanine (2 g/kg, *P < 0.05). The mean changes in glucose levels 15 min after alanine administration were: male Nkcc2aWT: –0.86 ± 0.27 mM (n = 10) and Nkcc2aKO: 1.54 ± 0.68* mM (n = 13), *P < 0.05; female Nkcc2aWT: –0.04 ± 0.49 mM (n = 10) and Nkcc2aKO: 1.72 ± 0.59* mM (n = 15), *P < 0.05]. F: shown are blood glucose responses at 0, 15, and 30 min after intraperitoneal administration of alanine (2 g/kg) to 16 h-fasted male and female Nkcc2aWT and Nkcc2aKO mice (closed and open circles, respectively) (*P < 0.05). The mean changes in glucose levels 30 min after alanine administration were as follows: male Nkcc2aWT: 1.94 ± 0.21 mM (n = 16) and Nkcc2aKO: 2.76 ± 0.36* mM (n = 10), *P < 0.05; female Nkcc2aWT: 0.99 ± 0.31 mM (n = 12) and Nkcc2aKO: 1.95 ± 0.28* mM (n = 12), *P < 0.05]. G and H: pyruvate tolerance tests in 16 h-fasted mice. Blood glucose responses to intraperitoneal administration of pyruvate (2 g/kg) in males (A) and females (B) of the Nkcc2aWT and Nkcc2aKO genotypes (closed and open circles, respectively) (n = 5–10) are shown.
To add support to the previous suggestion, alanine tolerance tests were performed in Nkcc2aKO mice fasted 16 h, a time point wherein stock hepatic glycogen has exhausted (53, 72). Consistently, as shown in Fig. 1E, 16 h-fasted Nkcc2aKO mice also exhibited higher glucose responses to alanine when compared with Nkcc2aWT, and male's responses were more pronounced than those of females. Since extra-hepatic (renal/intestinal) glucose production becomes increasingly important upon prolonged fasting (10, 49, 50, 53, 72), we explored if the elevated glycemic response of 16 h-fasted Nkcc2aKO mice to alanine associates with increased extrahepatic gluconeogenesis. To this end, blood glucose responses to pyruvate, a substrate converted to glucose in all gluconeogenic tissues (liver, kidney, and small intestines) (49, 50, 79), were determined in 16 h-fasted Nkcc2aWT and Nkcc2aKO mice of both sexes. As shown in Fig. 1, F and G, and contrary to alanine responses, the 16 h-fasted Nkcc2aKO mice responses to pyruvate were unexpectedly similar from those of Nkcc2aWT mice. Therefore, when the responses of Nkcc2aKO mice to alanine and pyruvate are considered together, the latter results are suggestive of reduced extrahepatic gluconeogenesis.
To determine whether the previous results are related to impaired glucagon or insulin responses to fasting, plasma glucagon was determined in fed and 6 h- and 16 h-fasted Nkcc2aWT and Nkcc2aKO mice. As shown in Fig. 2A, Nkcc2aWT mice did mount a glucagon response to prolonged fasting, as expected (9), whereas Nkcc2aKO mice did not. Notably, plasma glucagon in 16 h-fasted Nkcc2aKO mice remained as high as that found in the fed state or after 6 h of fasting. Similarly, plasma insulin remained significantly higher in 16 h-fasted Nkcc2aKO mice (Fig. 2B), in spite of them reaching the lowest blood glucose, which was indistinguishable from those of Nkcc2aWT mice (Fig. 2C). Accordingly, the plasma glucagon:insulin molar ratio of 16 h-fasted Nkcc2aKO was significantly decreased relative to that of Nkcc2aWT mice (Fig. 2D). When taken together, these data suggest a link between increased hepatic gluconeogenesis, constitutively high plasma glucagon, and potential hepatic resistance to insulin in Nkcc2aKO mice. In addition, the apparent decrease in extrahepatic gluconeogenesis observed in 16 h-fasted Nkcc2aKO mice may be related to insulin-dependent reduction of renal gluconeogenesis (26, 27, 57, 72, 81).
Fig. 2.

Nkcc2aKO mice exhibit increased plasma glucagon and impaired glucagon responses to fasting. A and B: plasma glucagon (A) and insulin (B) in fed, 6 h-, and 16 h-fasted Nkcc2aWT and Nkcc2aKO mice of both sexes (glucagon, n = 5–8; insulin, n = 6–11). C: box and whisker plots representing values of blood glucose from 16 h-fasted male and female mice of each genotype (Nkcc2aKO and Nkcc2aWT, *P < 0.05). D: glucagon-to-insulin molar ratios (pmol/L) of male (left) and female (right) Nkcc2aWT and Nkcc2aKO mice in the fed state (n = 10) or after 6 h (n = 7–13) and 16 h (n = 7–11) fasting period (*P < 0.05).
Nkcc2aKO mice are intolerant to glucose and exhibit impaired acute insulin responses to glucose.
Since glucagon appears not to have a direct role in renal gluconeogenesis (78) whereas insulin and glucose do (26, 27, 57, 72, 81), we next determine if Nkcc2aKO mice are intolerant to glucose. As shown in Figs. 3, A and B, glucose clearance in male and female Nkcc2aKO mice was significantly reduced when compared with that of Nkcc2aWT, as demonstrated by their increased AUCs (Fig. 3C, P < 0.05). In fact, the glucose intolerance of 6 h-fasted Nkcc2aKO mice coexists with increased basal plasma insulin (Fig. 1B) and apparently improved overall tissue sensitivity to insulin, as shown in Fig. 3D. Similarly, 16 h-fasted Nkcc2aKO mice showed impaired glucose tolerance, as shown in Fig. 4, A and B, remained hyperinsulinemic (Fig. 2C) and sensitive to insulin (Fig. 4C). To determine if the impaired glucose tolerance observed in 6 h-fasted Nkcc2aKO mice relates to changes in the acute insulin response to glucose in vivo, plasma insulin was serially determined after a single intraperitoneal dose of glucose (2 g/kg). As shown in Fig. 5A, acute plasma insulin responses to glucose were blunted/delayed in Nkcc2aKO mice relative to those of Nkcc2aWT. Remarkably, the average increase in plasma insulin recorded in Nkcc2aWT males and females 15 min postglucose challenge was ~4- and ~7-fold that of basal, respectively. However, those values were ~1.5- and ~2.4-fold for Nkcc2aKO males and females, respectively.
Fig. 3.

Nkcc2aKO mice are glucose intolerant. A and B: intraperitoneal glucose tolerance tests (GTT) performed in 6 h-fasted male (A) and female (B) mice of both genotypes: Nkcc2aWT (closed circles, *P < 0.05, n = 10–15) and Nkcc2aKO (open circles, *P < 0.05, n = 10–15). C: areas under the curve (AUCs) of each GTT performed in 6 h-fasted mice of each sex and genotype. AUCs are expressed as blood glucose (in mM) cleared from blood in 120 min (*P < 0.05). D: glucose responses to intraperitoneal injection of insulin in 6 h-fasted Nkcc2aWT and Nkcc2aKO mice of both sexes (*P < 0.05, n = 10–15).
Fig. 4.
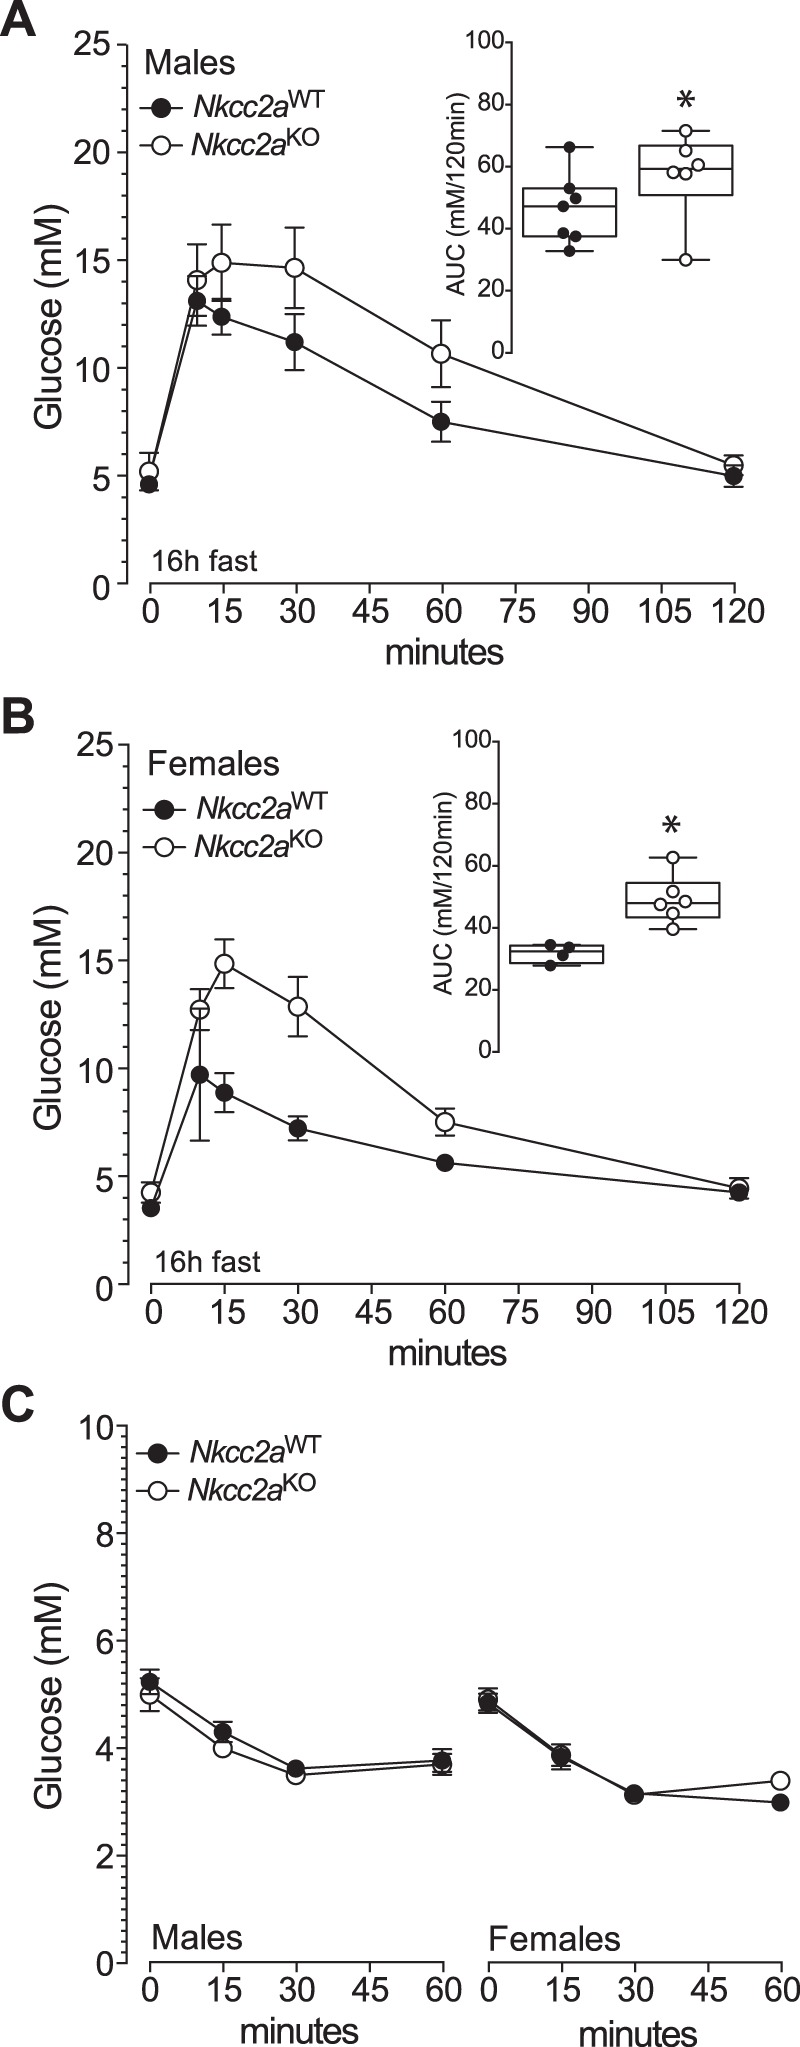
Glucose and insulin tolerance tests in 16 h-fasted Nkcc2aWT and Nkcc2aKO mice. A and B: blood glucose responses recorded at the indicated time points after intraperitoneal administration of glucose (2 g/kg) to 16 h-fasted males (A) and females (B) of the Nkcc2aWT and Nkcc2aKO genotypes (closed and open circles, respectively). Also shown are the areas under each curve (AUC; insets; *P < 0.05, n = 6 or 7). C: hypoglycemic responses of 16 h-fasted Nkcc2aWT and Nkcc2aKO mice of both sexes.
Fig. 5.

Nkcc2aKO mice exhibit delayed and blunted insulin responses in vivo. A: plasma insulin (pmol/L) responses to injected glucose (2 g/kg) in 6 h-fasted male and female mice (n = 10–15) of both genotypes (Nkcc2aWT and Nkcc2aKO, closed and open circles, respectively, *P < 0.05). B and C: static glucose-stimulated insulin secretion experiments (n = 3). In vitro islet insulin secretory response to noninsulinotropic and insulinotropic glucose (3.3 and 16.7 mM, respectively). Results are expressed relative to islet insulin content (B) or total protein (C). The islet insulin content per µg of islet protein was: Nkcc2aKO: 27.5 ± 3.1 pmol/µg protein and Nkcc2aWT: 29.5 ± 1.9 pmol/µg protein (P = 0.626). D: total Cl– uptake of Nkcc2aWT and Nkcc2aKO islets (closed and open bars, respectively) was determined 5 min after incubation in isotonic (ISO) media containing physiological concentrations of Cl− (120 mM) alone or in the presence of bumetanide (BTD; 10 µM). Results are expressed as nmol Cl− per µg protein (n = 5).
The absence of whole body insulin resistance inferred from insulin tolerance tests, in the face of impaired glucose tolerance and qualitatively abnormal insulin responses in vivo, suggests impaired islet insulin secretion in Nkcc2aKO mice. To ascertain if that was the case, we determined the overall secretory response of their islets in vitro. As shown in Fig. 5, B and C, the islet insulin responses to noninsulinotropic (3.3 mM) and insulinotropic (16.7 mM) glucose did not significantly differ among genotypes, even when data were expressed relative to total islet insulin content (Fig. 5B) or islet total protein content (Fig. 5C). We next determined if the conserved secretory response of Nkcc2aKO islets is related to changes total Cl− content. As shown in Fig. 5D, ~40% of the maximal uptake of Cl− ions in Nkcc2aWT and Nkcc2aKO islets is BTD-sensitive, suggesting a minimal role for Nkcc2a in the regulation of total islet Cl− content. To determine if Nkcc2aKO islets express compensatory increased protein levels of the Cl− loader Slc12a2 (Nkcc1) or compensatory expression of Nkcc2b and/or Nkcc2f transcripts, we performed immunoblotting and RT-PCR experiments. The results shown in Fig. 6, A and B, demonstrate that Nkcc2aKO and Nkcc2aWT islets express comparable protein levels of Nkcc1, whereas those of Fig. 6, D and E, show undetectable Nkcc2 transcript expression in Nkcc2aKO islets. When taken together, these data suggest that the glucose intolerance observed in Nkcc2aKO mice does not relate to a quantitative impairment of islet secretory responses in vitro or to whole animal tissue resistance to insulin.
Fig. 6.

Nkcc2 transcript and Nkcc1 protein expression in islets of Nkcc2aWT and Nkcc2aKO mice. A: original immunoblotting of protein extracts (75 µg/lane) obtained from freshly purified islets from Nkcc2aWT and Nkcc2aKO mice (n = 3 each). Nkcc1 and β-actin protein of expected approximate apparent molecular mass (Nkcc1: ~140 kDa and β-actin: ~45 kDa) were detected, as indicated. The dashed line represents where the membrane was cut. B: semiquantitative densitometry analysis of Nkcc1 levels relative to β-actin (n = 6). C: schematic representation of Nkcc2a, Nkcc2b, and Nkcc2f transcripts along with accession numbers. The full-length coding regions and their corresponding exons are indicated as white and gray arrowed boxes, respectively. The exons defining Nkcc2a, Nkcc2b, and Nkcc2f variants are noted. In D and E, the relative positions of the sense and antisense Nkcc2 primers used in RT-PCR experiments are indicated as opposite arrowheads. D: representative RT-PCR experiments demonstrating transcript expression of Nkcc2 in freshly isolated primary islets obtained from Nkcc2aWT mice but not in those from Nkcc2aKO. Shown are amplicons of expected lengths for Nkcc2a (700 bp). As positive and negative controls, RT-PCRs were directed by using Gapdh primers (555 bp) with or without total RNA. E: Nkcc2 transcript expression in kidney obtained from Nkcc2aWT and Nkcc2aKO mice.
Reduced islet expression of Kcc2 in Nkcc2aKO mice.
We have recently shown that the endocrine cells of the islet express the isotonically functional Cl− extruder Slc12a5 (Kcc2) and that pharmacological inhibition of this cotransporter increases basal and stimulated insulin secretion in vitro (44). Therefore, we turned our attention to this cotransporter to assess and extend the possibility of islet compensatory or adaptive mechanisms related to β-cell Cl− homeostasis. To this end, we performed immunofluorescence analysis of islets and pancreas sections of Nkcc2aWT and Nkcc2aKO mice to determine the expression pattern of Kcc2. As shown in Fig. 7, no evident changes in immunoreactive Nkcc1 were detected in islets of both genotypes, consistent with immunoblotting data (Fig. 6, A and B). However, immunoreactive Kcc2 appeared decreased in the Nkcc2aKO islets (compare Fig. 7, C and G, against Fig. 7, K and O). To extend these observations, Nkcc2aKO and Nkcc2aWT pancreas slides immunolabeled against Kcc2, insulin, and glucagon were subjected to confocal immunomicroscopy imaging analysis followed by semiquantitation. As shown in Fig. 8A, immunoreactive Kcc2 expression in Nkcc2aWT islets (Fig. 8A, top) appears increased when compared with Nkcc2aKO (Fig. 8A, bottom). In fact, the total immunofluorescence density elicited by Kcc2/insulin/glucagon coimmunostaining in these islets was less abundant in Nkcc2aKO than that of Nkcc2aWT (Fig. 8B), as suggested by the semiquantitative analysis performed in triple-labeled pancreas slides [Nkcc2aWT: 0.0363 ± 0.0006 pixels/µm2 (n = 51) versus Nkcc2aKO: 0.0102 ± 0.0015 pixels/µm2 (n = 95), P < 0.001], as shown in Fig. 8C. To further validate these data, immunoblotting analysis was performed using protein extracts from purified primary islets obtained from Nkcc2aWT and Nkcc2aKO mice. As shown in Fig. 8, D and E, Kcc2 protein expression is significantly reduced in islets lacking Nkcc2a. Therefore, when taken together, the data presented so far suggest that the conserved secretory response and normal total Cl− content observed in islets lacking Nkcc2a are associated, at least in part, with adaptive downregulation of Kcc2.
Fig. 7.

Pancreatic islets of Nkcc2aWT and Nkcc2aKO mice express Nkcc1 and Kcc2. Representative immunofluorescence microscopy images of Nkcc2aWT (A–H) and Nkcc2aKO (I–P) pancreas sections immunolabeled against Nkcc1 (A), insulin (Ins; B, F, J, and N), Kcc2 (C, G, K, and O), and glucagon (Glc; E and M) using Cy3-, AF488-, or DyLight405-labeled secondary antibodies [red (Kcc2), green (Nkcc1 and glucagon), and white (insulin), respectively]. Superimposed overlays are shown in D, H, L, and P. Scale bars, 25 µm.
Fig. 8.

Pancreatic islets of Nkcc2aKO mice express reduced levels of Kcc2. A: representative confocal images of pancreas tissue sections obtained from Nkcc2aWT and Nkcc2aKO mice (top and bottom, respectively) colabeled against Kcc2 (red), insulin (white), and glucagon (green). Overlay combinations of these images are also shown for Nkcc2aWT and Nkcc2aKO sections. Scale bars, 25 µm. B: 3D surface plots of triple-labeled pancreatic islets shown in A. Data were obtained by computing total pixel density of the respective superimposed pictures by using the Interactive 3D Surface Plot plugin of ImageJ (https://imagej.nih.gov/ij/). Scale bars, 25 µm. C: semiquantitation of immunoreactive Kcc2 (IR Kcc2) expressed in islets of the Nkcc2aWT (n = 51) and Nkcc2aKO (n = 95) genotypes. Results are expressed as pixels per µm2 of islet area and were obtained from at least 5 slides obtained from 3 different mice (*P < 0.001). D: original immunoblot of protein extracts (75 µg/lane) corresponding to primary islets obtained from Nkcc2aWT and Nkcc2aKO mice (n = 3 each). Kcc2 and β-actin protein of expected approximate apparent molecular mass (Kcc2: ~120 kDa, β-actin: ~45 kDa) were detected, as indicated. The dashed line represents where the membrane was cut. E: semiquantitative densitometry analysis of Kcc2 expression relative to β-actin (n = 3, *P < 0.001).
Increased islet size in Nkcc2aKO mice.
In addition to reduced Kcc2 expression, confocal immunomicroscopy imaging also revealed morphologically abnormal β- and α-cells in islets lacking Nkcc2a (Fig. 8A, compare insulin- and glucagon-positive cells of both genotypes). To quantify this observation, morphometric analysis was carried out using confocal images of pancreas tissues colabeled with insulin and glucagon antibodies. As shown in Fig. 9, A and B, the mean islet area (Fig. 9A) and insulin (β)- or glucagon (α)-positive cell densities (Fig. 9B) were significantly increased in Nkcc2aKO mice relative to Nkcc2aWT (n = 26–34, P < 0.001). In addition, the estimated mean β- and α-cell volumes were significantly increased in Nkcc2aKO islets relative to those of Nkcc2aWT (0.72 ± 0.02 versus 0.52 ± 0.01 pL, P < 0.01, and 0.29 ± 0.01 versus 0.24 ± 0.02 pL P = 0.0137). These findings are illustrated in representative confocal microscopy images of Nkcc2aWT and Nkcc2aKO islets immunolabeled against insulin and glucagon (Fig. 9D). Therefore, these data suggest that Nkcc2aKO mice exhibit increased islet size related to hyperplastic and hypertrophic endocrine cell units.
Fig. 9.

Increased islet area, α- and β-cell mass in pancreas sections of Nkcc2aKO mice. A–C: Shown are the islet (n = 20, each genotype) surface areas expressed in µm2 (A, means ± SE, *P < 0.05), α- and β-cell number per islet (B, means ± SE, *P < 0.05), and estimated α- and β-cell volume expressed in pL (C, means ± SE, *P < 0.05) computed on high-resolution immunofluorescence microscopy images obtained from 10 to 15 pancreas sections (n = 3 mice, each genotype). D: representative confocal immunofluorescence microscopy images of pancreas obtained from Nkcc2aWT and Nkcc2aKO mice (top and bottom, respectively). Scale bars, 25 µm.
DISCUSSION
We have previously suggested that Nkcc2a has a potential adaptive role in insulin secretion (3, 5). Similarly, adaptive Nkcc2 upregulation in AVP neurons has been linked to AVP secretion in rats subjected to chronic osmotic stress (33, 42). Since dehydration stimulates secretion of AVP (11) and this hormone increases hepatic gluconeogenesis, blood glucose, insulin, and glucagon secretion (22, 56, 83), we initially hypothesized that the increase in basal glycaemia, plasma insulin, glucagon, and hepatic gluconeogenesis observed in 6 h-fasted Nkcc2aKO mice (Figs. 1 and 2) is due, at least in part, to increased AVP. However, the latter does not appear to be the case; plasma AVP in 6 h-fasted mice of both genotypes and sexes was very low and close to the detection limit of the assay and thus unlikely to stimulate islet hormone secretion (25) or hepatic gluconeogenesis (32). In addition, contrary to the phenotypes imposed by global elimination or specific point mutants affecting all variants of Nkcc2 (39, 80), Nkcc2aKO mice do not display a renal phenotype consistent with chronic volume depletion or hypo-hydration (55). In fact, Nkcc2aKO mice exhibit normal kidney function, insignificant changes in plasma renin or aldosterone concentrations, and relatively conserved osmoregulatory responses to water deprivation (55). Even though these latter results were linked to compensatory upregulation of Nkcc2b in the kidney (55), it is important to mention that Nkcc2aKO mice expressed undetectable Nkcc2b or Nkcc2f in their islets (Fig. 6, D and E) indicating that the targeted Slc12a1 allele does not produce compensatory Nkcc2b or Nkcc2f transcripts, at least in the mouse islet. Therefore, the increased hepatic gluconeogenesis, blood glucose, plasma insulin, and glucagon observed in 6 h-fasted Nkcc2aKO mice may not be directly related to chronically elevated plasma AVP. However, whether Nkcc2-expressing AVP neurons impinge on hypothalamic neurons known to control energy homeostasis, including feeding behavior (59), remains an interesting possibility.
In the fasted state the liver provides most, but not all (26), of circulating glucose to maintain normoglycemia, being that hepatic glycogenolysis and gluconeogenesis considered the most important sources of endogenous glucose (60). In addition, these two metabolic pathways are finely controlled by an elaborated array of hormones including insulin and glucagon as well as glucose per se (60). Indeed, in normal individuals fasted overnight, glycogenolysis and gluconeogenesis can be fully inhibited by a small raise in plasma insulin (8) whereas small increases in blood glucose in 6 h-fasted rats do not affect gluconeogenesis but inhibit glycogenolysis in an insulin-independent manner (66). In addition, acute increases in plasma glucagon stimulate glycogenolysis whereas chronically elevated glucagon gradually increases gluconeogenesis, resulting in the gradual restoration and preservation of euglycemia upon long fasting periods (16). Therefore, it is likely that the significantly elevated glycemic responses that 6 h- and 16 h-fasted Nkcc2aKO mice had to alanine (Fig. 1, E and F) are related, at least in part, to chronically elevated/dysregulated glucagon. In line with this reasoning, plasma glucagon in these mice remained consistently high, irrespective of their feeding or fasting state (Fig. 2A). Interestingly, the alanine responses of fasted female Nkcc2aKO mice were less pronounced than that of males (Fig. 1, E and F). These responses may be the result of sex-related differences in blood glucose and/or plasma insulin in 6 h-fasted mice, as both parameters were significantly lower in females than in males (Fig. 1, A and B). However, there were no significant sex-related differences in blood glucose or insulin in 16 h-fasted mice (Fig. 2, B and C). It is well accepted that the metabolic profile of females is in general more beneficial than that of males (38, 82). In fact, estrogens reduce tissue gluconeogenesis and 16 h-fasted normal female mice appear to have significantly reduced (~20%) glycemic responses to pyruvate when compared with those of males (85). Our results, however, suggest a marginal (~10%) reduction in the area under the curve of pyruvate tolerance tests of 16 h-fasted Nkcc2aWT female mice relative to that of males (Nkcc2aWT: 5.2 ± 0.3 versus 5.6 ± 0.4 mM/min, Fig. 1, G and H). This apparent difference between our results and those of Yan et al. (85) could be related to the different genetic background of mice used in these two studies (C57BL/6J versus mixed C57BL/6J-129/Sv; Ref. 85). In any case, the pyruvate tolerance tests performed in 16 h-fasted Nkcc2aKO mice were indistinguishable from those of Nkcc2aWT (Fig. 1, G and H). Yet, Nkcc2aKO mice of both sexes showed increased glycemic responses to alanine (Fig. 1E). Although these results appear counterintuitive, it is worthwhile to mention that alanine is a major gluconeogenic precursor in the liver (49, 50, 53, 72, 79) but minimally in intestines or kidneys (18, 50, 60). Therefore, when the glycemic responses of 16 h-fasted Nkcc2aKO mice to alanine and pyruvate are considered together, it is reasonable to suggest that mice lacking Nkcc2a have reduced renal but increased hepatic gluconeogenesis.
Even though more experiments are required to pinpoint a potential role of Nkcc2a in renal gluconeogenesis, it has been suggested that glucagon does not affect this metabolic pathway in normal subjects, at least when glutamine was used as a gluconeogenic substrate (78). However, glucagon appears to drive renal gluconeogenesis in normal fasted mice (53). This latter effect of glucagon may be small and/or indirect; functional glucagon receptors have not been found in the proximal tubule (12), where renal gluconeogenesis is considered to occur (29, 73). Unlike glucagon, however, insulin does reduce gluconeogenesis in the proximal tubule either directly or indirectly through modulation of gluconeogenic substrate availability (26, 27). In fact, insulin-mediated signaling as well as glucose have been recently demonstrated to suppress renal gluconeogenesis (57, 72, 81). Therefore, the impaired kidney gluconeogenesis inferred from alanine and pyruvate tolerance tests in mice lacking Nkcc2a may be related, at least in part, to impaired insulin signaling and/or impaired glucose/amino acid transport in the proximal tubule. At this point, however, it is important to stress that the previous interpretation must be considered within the limitations of assessing gluconeogenesis in vivo by using alanine and pyruvate tolerance tests as surrogate of that pathway, instead of tracers (reviewed in Ref. 17). For instance, 1) neither injected pyruvate nor alanine are exclusively used as substrates for gluconeogenesis (17) and both stimulate glucagon secretion (34, 52) but not that of insulin (35, 52); 2) hepatic and renal gluconeogenesis are regulated by many hormones with different sensitivities (61) by gluconeogenic enzyme modulation and by differential substrate availability (60); 3) the metabolic and hormonal profiles of mice change dramatically with fasting (15) making it difficult to extrapolate in vivo metabolic findings under different fasting conditions; and 4) fasting potently activates the sympathetic nervous system (45), which directly modulates hepatic glucose production (63, 64). Therefore, these variables need to be taken into consideration as they may contribute to the complex metabolic phenotype observed in Nkcc2aKO mice.
Interestingly 6 h-fasted Nkcc2aKO mice had qualitatively impaired plasma insulin responses to glucose (Fig. 5A), were intolerant to the sugar (Fig. 3, A–C) even after prolonged fasting (Fig. 4, A and B), but remained sensitive to insulin irrespective of fasting (Figs. 3D and 4C). These findings may not necessarily result from the absence of Nkcc2a in β-cells of the islet; this transporter is abundantly expressed in the TAL (58) and much lower levels of Nkcc2 were found in the hypothalamus (33, 42). Although it is not known which splice variant of Nkcc2 is expressed in hypothalamic neurons, deletion of Nkcc2a in the kidney may impinge distinctive adaptive effects on other tissues and in overall glucose homeostasis. In line with this suggestion, morphometric analyses of pancreas slides of Nkcc2aKO mice showed increased islet size related to hyperplastic/hypertrophic endocrine cells (Fig. 9). Although reduced sensitivity of tissues to insulin may contribute to these potentially adaptive islet morphometric changes, it is important to mention that insulin tolerance tests as performed in our studies cannot discriminate tissue-specific sensitivities to the hormone. Therefore, further experiments are needed to demonstrate whether the liver, muscle, kidneys, and/or fat tissues in Nkcc2aKO mice are differentially sensitive to insulin under different fasting conditions.
A potential role of Nkcc2a in the islet secretory response, at least at the quantitative level, appears to be minor. In vivo, it was blunted/delayed in Nkcc2aKO mice (Fig. 5A). In vitro, the secretory response to glucose of islets lacking Nkcc2a was not significantly different from that of Nkcc2aWT islets (Fig. 5, B and C). Although it remains unknown if the first and/or second phases of insulin secretion are qualitatively affected in Nkcc2aKO islets or if the secretory profile of glucagon, their relatively normal insulin secretory responses and total Cl− content (Fig. 5D) are in line with the suggestion that Nkcc2a plays a negligible role in islet secretion or Cl− accumulation. However, that conclusion needs to be taken within the context of reduced levels of the Cl−extruder Kcc2 (Fig. 5) and apparently intact Nkcc1 expression levels (Fig. 6, A and B). Since inhibition of Kcc2 promotes insulin secretion in Nkcc1-expressing β-cells (44), together these results suggest a potentially adaptive role of Kcc2 in islet Cl− regulation. Direct measurements of Cl− fluxes are required to pinpoint the direct effects that Cl− loaders, extruders, and/or channels and their interplay may have in β-cell physiology.
Changes in the metabolism and/or clearance of insulin or a combination of both in response to fasting remain potential factors involved in the phenotype observed in Nkcc2aKO mice. Interestingly, 6 h-fasted mice with genetically disrupted insulin signaling in the proximal tubule exhibit enhanced gluconeogenesis (72). Therefore, reduced insulin clearance in the kidneys could result in reduced renal gluconeogenesis. Although Nkcc2aKO mice exhibit normal kidney function, as determined by the glomerular filtration rate (55), an altered renal insulin filtration rate in Nkcc2aKO mice appears unlikely. However, since plasma insulin cleared by renal glomerular filtration is completely degraded in the proximal convoluted tubule (21, 65), impaired renal insulin degradation in the tubules of Nkcc2aKO mice is expected to increase plasma insulin after. Partially in line with this reasoning, 6 h- and 16 h-fasted Nkcc2aKO mice exhibit increased steady-state plasma insulin (Figs. 1B and 2C). Even though the possibility of a potential role of renal Nkcc2a in insulin clearance and/or degradation awaits confirmation, the results presented here suggest that global elimination of Nkcc2a in mice, which lack a kidney phenotype related to hydro-electrolyte balance (55), results in a complex metabolic phenotype characterized by increased basal blood glucose, plasma insulin and glucagon. Further, these findings correlate with glucose intolerance, impaired insulin and glucagon responses to glucose, and increased hepatic gluconeogenesis, overall within the context of adaptive hyperplasia/hypertrophy of α- and β-cells.
GRANTS
This work was supported in part by US-Brazil Higher Education Consortia Program FIPSE/CAPES Exchange scholarships to R. Pacheco and E. Dias-Junior. We are grateful to the Proteome Analysis Laboratory (PAL, Department of Pharmacology and Toxicology, Wright State University, WSU) and the Mouse Metabolic Phenotyping Center (University of Cincinnati Medical Center, NIH National Institute of Diabetes and Digestive and Kidney Diseases Grant U24 DK059630). This research was supported initially in part by WSU Research Incentive Fund 226132, and later by funds from the American Diabetes Association and NIH Grants 1-17-IBS-258 and R21DK113446-01 (to M. Di Fulvio).
DISCLOSURES
No conflicts of interest, financial or otherwise, are declared by the authors.
AUTHOR CONTRIBUTIONS
L.K., M.M.A., S.K., and M.D.F. conceived and designed research; L.K., M.M.A., S.K., R.P., E.D.-J., and M.D.F. performed experiments; L.K., M.M.A., S.K., H.C., and M.D.F. analyzed data; L.K., M.M.A., S.K., H.C., and M.D.F. interpreted results of experiments; M.D.F. prepared figures; M.D.F. drafted manuscript; L.K., M.M.A., S.K., R.P., E.D.-J., H.C., and M.D.F. edited and revised manuscript; L.K., M.M.A., S.K., R.P., E.D.-J., H.C., and M.D.F. approved final version of manuscript.
ACKNOWLEDGMENTS
We are thankful to Yaksh Rathod for assistance with Nkcc1 immunoblotting experiments.
REFERENCES
- 1.Abramoff MD, Magalhães PJ, Ram SJ. Image processing using ImageJ. Biophoton Int 11: 36–42, 2004. [Google Scholar]
- 2.Alsahli M, Gerich JE. Renal glucose metabolism in normal physiological conditions and in diabetes. Diabetes Res Clin Pract 133: 1–9, 2017. doi: 10.1016/j.diabres.2017.07.033. [DOI] [PubMed] [Google Scholar]
- 3.Alshahrani S, Almutairi MM, Kursan S, Dias-Junior E, Almiahuob MM, Aguilar-Bryan L, Di Fulvio M. Increased Slc12a1 expression in β-cells and improved glucose disposal in Slc12a2 heterozygous mice. J Endocrinol 227: 153–165, 2015. doi: 10.1530/JOE-15-0327. [DOI] [PMC free article] [PubMed] [Google Scholar]
- 4.Alshahrani S, Alvarez-Leefmans FJ, Di Fulvio M. Expression of the Slc12a1 gene in pancreatic β-cells: molecular characterization and in silico analysis. Cell Physiol Biochem 30: 95–112, 2012. doi: 10.1159/000339050. [DOI] [PubMed] [Google Scholar]
- 5.Alshahrani S, Di Fulvio M. Enhanced insulin secretion and improved glucose tolerance in mice with homozygous inactivation of the Na+K+2Cl− co-transporter 1. J Endocrinol 215: 59–70, 2012. doi: 10.1530/JOE-12-0244. [DOI] [PubMed] [Google Scholar]
- 6.Arroyo JP, Kahle KT, Gamba G. The SLC12 family of electroneutral cation-coupled chloride cotransporters. Mol Aspects Med 34: 288–298, 2013. doi: 10.1016/j.mam.2012.05.002. [DOI] [PubMed] [Google Scholar]
- 7.Ayala JE, Samuel VT, Morton GJ, Obici S, Croniger CM, Shulman GI, Wasserman DH, McGuinness OP; NIH Mouse Metabolic Phenotyping Center Consortium . Standard operating procedures for describing and performing metabolic tests of glucose homeostasis in mice. Dis Model Mech 3: 525–534, 2010. doi: 10.1242/dmm.006239. [DOI] [PMC free article] [PubMed] [Google Scholar]
- 8.Basu R, Chandramouli V, Dicke B, Landau B, Rizza R. Obesity and type 2 diabetes impair insulin-induced suppression of glycogenolysis as well as gluconeogenesis. Diabetes 54: 1942–1948, 2005. doi: 10.2337/diabetes.54.7.1942. [DOI] [PubMed] [Google Scholar]
- 9.Berglund ED, Lee-Young RS, Lustig DG, Lynes SE, Donahue EP, Camacho RC, Meredith ME, Magnuson MA, Charron MJ, Wasserman DH. Hepatic energy state is regulated by glucagon receptor signaling in mice. J Clin Invest 119: 2412–2422, 2009. doi: 10.1172/JCI38650. [DOI] [PMC free article] [PubMed] [Google Scholar]
- 10.Björkman O, Felig P, Wahren J. The contrasting responses of splanchnic and renal glucose output to gluconeogenic substrates and to hypoglucagonemia in 60-h-fasted humans. Diabetes 29: 610–616, 1980. doi: 10.2337/diab.29.8.610. [DOI] [PubMed] [Google Scholar]
- 11.Bourque CW, Oliet SH, Richard D. Osmoreceptors, osmoreception, and osmoregulation. Front Neuroendocrinol 15: 231–274, 1994. doi: 10.1006/frne.1994.1010. [DOI] [PubMed] [Google Scholar]
- 12.Butlen D, Morel F. Glucagon receptors along the nephron: [125I]glucagon binding in rat tubules. Pflugers Arch 404: 348–353, 1985. doi: 10.1007/BF00585347. [DOI] [PubMed] [Google Scholar]
- 13.Carota I, Theilig F, Oppermann M, Kongsuphol P, Rosenauer A, Schreiber R, Jensen BL, Walter S, Kunzelmann K, Castrop H. Localization and functional characterization of the human NKCC2 isoforms. Acta Physiol (Oxf) 199: 327–338, 2010. doi: 10.1111/j.1748-1716.2010.02099.x. [DOI] [PubMed] [Google Scholar]
- 14.Castrop H, Schießl IM. Physiology and pathophysiology of the renal Na-K-2Cl cotransporter (NKCC2). Am J Physiol Renal Physiol 307: F991–F1002, 2014. doi: 10.1152/ajprenal.00432.2014. [DOI] [PubMed] [Google Scholar]
- 15.Champy MF, Selloum M, Piard L, Zeitler V, Caradec C, Chambon P, Auwerx J. Mouse functional genomics requires standardization of mouse handling and housing conditions. Mamm Genome 15: 768–783, 2004. doi: 10.1007/s00335-004-2393-1. [DOI] [PubMed] [Google Scholar]
- 16.Cherrington AD, Williams PE, Shulman GI, Lacy WW. Differential time course of glucagon’s effect on glycogenolysis and gluconeogenesis in the conscious dog. Diabetes 30: 180–187, 1981. doi: 10.2337/diab.30.3.180. [DOI] [PubMed] [Google Scholar]
- 17.Chung ST, Chacko SK, Sunehag AL, Haymond MW. Measurements of gluconeogenesis and glycogenolysis: a methodological review. Diabetes 64: 3996–4010, 2015. doi: 10.2337/db15-0640. [DOI] [PMC free article] [PubMed] [Google Scholar]
- 18.Croset M, Rajas F, Zitoun C, Hurot JM, Montano S, Mithieux G. Rat small intestine is an insulin-sensitive gluconeogenic organ. Diabetes 50: 740–746, 2001. doi: 10.2337/diabetes.50.4.740. [DOI] [PubMed] [Google Scholar]
- 19.Deidda G, Parrini M, Naskar S, Bozarth IF, Contestabile A, Cancedda L. Reversing excitatory GABAAR signaling restores synaptic plasticity and memory in a mouse model of Down syndrome. Nat Med 21: 318–326, 2015. doi: 10.1038/nm.3827. [DOI] [PubMed] [Google Scholar]
- 20.Di Fulvio M, Brown PD, and Aguilar-Bryan L. Chloride channels and transporters in β-cell physiology. The Islets of Langerhans, edited by Islam MS. New York: Springer-Verlag, 2014, p. 401–451. [Google Scholar]
- 21.Duckworth WC, Kitabchi AE. Insulin metabolism and degradation. Endocr Rev 2: 210–233, 1981. doi: 10.1210/edrv-2-2-210. [DOI] [PubMed] [Google Scholar]
- 22.Dunning BE, Moltz JH, Fawcett CP. Modulation of insulin and glucagon secretion from the perfused rat pancreas by the neurohypophysial hormones and by desamino-D-arginine vasopressin (DDAVP). Peptides 5: 871–875, 1984. doi: 10.1016/0196-9781(84)90109-8. [DOI] [PubMed] [Google Scholar]
- 23.Flamenbaum W, Friedman R. Pharmacology, therapeutic efficacy, and adverse effects of bumetanide, a new “loop” diuretic. Pharmacotherapy 2: 213–222, 1982. doi: 10.1002/j.1875-9114.1982.tb03188.x. [DOI] [PubMed] [Google Scholar]
- 24.Gamba G. Molecular physiology and pathophysiology of electroneutral cation-chloride cotransporters. Physiol Rev 85: 423–493, 2005. doi: 10.1152/physrev.00011.2004. [DOI] [PubMed] [Google Scholar]
- 25.Gao ZY, Gérard M, Henquin JC. Glucose- and concentration-dependence of vasopressin-induced hormone release by mouse pancreatic islets. Regul Pept 38: 89–98, 1992. doi: 10.1016/0167-0115(92)90075-6. [DOI] [PubMed] [Google Scholar]
- 26.Gerich JE. Role of the kidney in normal glucose homeostasis and in the hyperglycaemia of diabetes mellitus: therapeutic implications. Diabet Med 27: 136–142, 2010. doi: 10.1111/j.1464-5491.2009.02894.x. [DOI] [PMC free article] [PubMed] [Google Scholar]
- 27.Gerich JE, Meyer C, Woerle HJ, Stumvoll M. Renal gluconeogenesis: its importance in human glucose homeostasis. Diabetes Care 24: 382–391, 2001. doi: 10.2337/diacare.24.2.382. [DOI] [PubMed] [Google Scholar]
- 28.Giugliano D, Varricchio M, Cerciello T, Varano R, Saccomanno F, Giannetti G. Bumetanide and glucose tolerance in man. Farmaco Prat 35: 403–408, 1980. [PubMed] [Google Scholar]
- 29.Guder WG, Ross BD. Enzyme distribution along the nephron. Kidney Int 26: 101–111, 1984. doi: 10.1038/ki.1984.143. [DOI] [PubMed] [Google Scholar]
- 30.Haering C, Kanageswaran N, Bouvain P, Scholz P, Altmüller J, Becker C, Gisselmann G, Wäring-Bischof J, Hatt H. Ion transporter NKCC1, modulator of neurogenesis in murine olfactory neurons. J Biol Chem 290: 9767–9779, 2015. doi: 10.1074/jbc.M115.640656. [DOI] [PMC free article] [PubMed] [Google Scholar]
- 31.Hartmann AM, Tesch D, Nothwang HG, Bininda-Emonds OR. Evolution of the cation chloride cotransporter family: ancient origins, gene losses, and subfunctionalization through duplication. Mol Biol Evol 31: 434–447, 2014. doi: 10.1093/molbev/mst225. [DOI] [PubMed] [Google Scholar]
- 32.Hems DA, Whitton PD. Stimulation by vasopressin of glycogen breakdown and gluconeogenesis in the perfused rat liver. Biochem J 136: 705–709, 1973. doi: 10.1042/bj1360705. [DOI] [PMC free article] [PubMed] [Google Scholar]
- 33.Hindmarch C, Yao S, Beighton G, Paton J, Murphy D. A comprehensive description of the transcriptome of the hypothalamoneurohypophyseal system in euhydrated and dehydrated rats. Proc Natl Acad Sci USA 103: 1609–1614, 2006. doi: 10.1073/pnas.0507450103. [DOI] [PMC free article] [PubMed] [Google Scholar]
- 34.Ishihara H, Maechler P, Gjinovci A, Herrera PL, Wollheim CB. Islet beta-cell secretion determines glucagon release from neighbouring alpha-cells. Nat Cell Biol 5: 330–335, 2003. doi: 10.1038/ncb951. [DOI] [PubMed] [Google Scholar]
- 35.Ishihara H, Wang H, Drewes LR, Wollheim CB. Overexpression of monocarboxylate transporter and lactate dehydrogenase alters insulin secretory responses to pyruvate and lactate in beta cells. J Clin Invest 104: 1621–1629, 1999. doi: 10.1172/JCI7515. [DOI] [PMC free article] [PubMed] [Google Scholar]
- 36.Jensen TL, Kiersgaard MK, Sørensen DB, Mikkelsen LF. Fasting of mice: a review. Lab Anim 47: 225–240, 2013. doi: 10.1177/0023677213501659. [DOI] [PubMed] [Google Scholar]
- 37.Kaila K, Price TJ, Payne JA, Puskarjov M, Voipio J. Cation-chloride cotransporters in neuronal development, plasticity and disease. Nat Rev Neurosci 15: 637–654, 2014. doi: 10.1038/nrn3819. [DOI] [PMC free article] [PubMed] [Google Scholar]
- 38.Karp NA, Mason J, Beaudet AL, Benjamini Y, Bower L, Braun RE, Brown SDM, Chesler EJ, Dickinson ME, Flenniken AM, Fuchs H, Angelis MH, Gao X, Guo S, Greenaway S, Heller R, Herault Y, Justice MJ, Kurbatova N, Lelliott CJ, Lloyd KCK, Mallon AM, Mank JE, Masuya H, McKerlie C, Meehan TF, Mott RF, Murray SA, Parkinson H, Ramirez-Solis R, Santos L, Seavitt JR, Smedley D, Sorg T, Speak AO, Steel KP, Svenson KL, Wakana S, West D, Wells S, Westerberg H, Yaacoby S, White JK; International Mouse Phenotyping Consortium . Prevalence of sexual dimorphism in mammalian phenotypic traits. Nat Commun 8: 15475, 2017. doi: 10.1038/ncomms15475. [DOI] [PMC free article] [PubMed] [Google Scholar]
- 39.Kemter E, Rathkolb B, Bankir L, Schrewe A, Hans W, Landbrecht C, Klaften M, Ivandic B, Fuchs H, Gailus-Durner V, Hrabé de Angelis M, Wolf E, Wanke R, Aigner B. Mutation of the Na+-K+-2Cl− cotransporter NKCC2 in mice is associated with severe polyuria and a urea-selective concentrating defect without hyperreninemia. Am J Physiol Renal Physiol 298: F1405–F1415, 2010. doi: 10.1152/ajprenal.00522.2009. [DOI] [PubMed] [Google Scholar]
- 40.Kemter E, Rathkolb B, Becker L, Bolle I, Busch DH, Dalke C, Elvert R, Favor J, Graw J, Hans W, Ivandic B, Kalaydjiev S, Klopstock T, Rácz I, Rozman J, Schrewe A, Schulz H, Zimmer A, Fuchs H, Gailus-Durner V, Hrabe de Angelis M, Wolf E, Aigner B. Standardized, systemic phenotypic analysis of Slc12a1I299F mutant mice. J Biomed Sci 21: 68, 2014. doi: 10.1186/s12929-014-0068-0. [DOI] [PMC free article] [PubMed] [Google Scholar]
- 41.Kim GH. Long-term adaptation of renal ion transporters to chronic diuretic treatment. Am J Nephrol 24: 595–605, 2004. doi: 10.1159/000082314. [DOI] [PubMed] [Google Scholar]
- 42.Konopacka A, Qiu J, Yao ST, Greenwood MP, Greenwood M, Lancaster T, Inoue W, Mecawi AS, Vechiato FM, de Lima JB, Coletti R, Hoe SZ, Martin A, Lee J, Joseph M, Hindmarch C, Paton J, Antunes-Rodrigues J, Bains J, Murphy D. Osmoregulation requires brain expression of the renal Na-K-2Cl cotransporter NKCC2. J Neurosci 35: 5144–5155, 2015. doi: 10.1523/JNEUROSCI.4121-14.2015. [DOI] [PMC free article] [PubMed] [Google Scholar]
- 43.Koumangoye R, Omer S, Delpire E. Mistargeting of a truncated Na-K-2Cl cotransporter in epithelial cells. Am J Physiol Cell Physiol 315: C258–C276, 2018. doi: 10.1152/ajpcell.00130.2018. [DOI] [PMC free article] [PubMed] [Google Scholar]
- 44.Kursan S, McMillen TS, Beesetty P, Dias-Junior E, Almutairi MM, Sajib AA, Kozak JA, Aguilar-Bryan L, Di Fulvio M. The neuronal K+Cl− co-transporter 2 (Slc12a5) modulates insulin secretion. Sci Rep 7: 1732, 2017. doi: 10.1038/s41598-017-01814-0. [DOI] [PMC free article] [PubMed] [Google Scholar]
- 45.Landsberg L, Young JB. Fasting, feeding and regulation of the sympathetic nervous system. N Engl J Med 298: 1295–1301, 1978. doi: 10.1056/NEJM197806082982306. [DOI] [PubMed] [Google Scholar]
- 46.Ludwig M. Dendritic release of vasopressin and oxytocin. J Neuroendocrinol 10: 881–895, 1998. doi: 10.1046/j.1365-2826.1998.00279.x. [DOI] [PubMed] [Google Scholar]
- 47.McCommis KS, Chen Z, Fu X, McDonald WG, Colca JR, Kletzien RF, Burgess SC, Finck BN. Loss of mitochondrial pyruvate carrier 2 in the liver leads to defects in gluconeogenesis and compensation via pyruvate-alanine cycling. Cell Metab 22: 682–694, 2015. doi: 10.1016/j.cmet.2015.07.028. [DOI] [PMC free article] [PubMed] [Google Scholar]
- 48.McGuinness OP, Ayala JE, Laughlin MR, Wasserman DH. NIH experiment in centralized mouse phenotyping: the Vanderbilt experience and recommendations for evaluating glucose homeostasis in the mouse. Am J Physiol Endocrinol Metab 297: E849–E855, 2009. doi: 10.1152/ajpendo.90996.2008. [DOI] [PMC free article] [PubMed] [Google Scholar]
- 49.Meyer C, Stumvoll M, Dostou J, Welle S, Haymond M, Gerich J. Renal substrate exchange and gluconeogenesis in normal postabsorptive humans. Am J Physiol Endocrinol Metab 282: E428–E434, 2002. doi: 10.1152/ajpendo.00116.2001. [DOI] [PubMed] [Google Scholar]
- 50.Mithieux G, Rajas F, Gautier-Stein A. A novel role for glucose 6-phosphatase in the small intestine in the control of glucose homeostasis. J Biol Chem 279: 44231–44234, 2004. doi: 10.1074/jbc.R400011200. [DOI] [PubMed] [Google Scholar]
- 51.Mount DB, Baekgaard A, Hall AE, Plata C, Xu J, Beier DR, Gamba G, Hebert SC. Isoforms of the Na-K-2Cl cotransporter in murine TAL I. Molecular characterization and intrarenal localization. Am J Physiol Renal Physiol 276: F347–F358, 1999. doi: 10.1152/ajprenal.1999.276.3.F347. [DOI] [PubMed] [Google Scholar]
- 52.Müller WA, Faloona GR, Unger RH. The effect of alanine on glucagon secretion. J Clin Invest 50: 2215–2218, 1971. doi: 10.1172/JCI106716. [DOI] [PMC free article] [PubMed] [Google Scholar]
- 53.Mutel E, Gautier-Stein A, Abdul-Wahed A, Amigó-Correig M, Zitoun C, Stefanutti A, Houberdon I, Tourette JA, Mithieux G, Rajas F. Control of blood glucose in the absence of hepatic glucose production during prolonged fasting in mice: induction of renal and intestinal gluconeogenesis by glucagon. Diabetes 60: 3121–3131, 2011. doi: 10.2337/db11-0571. [DOI] [PMC free article] [PubMed] [Google Scholar]
- 54.Oppermann M, Mizel D, Huang G, Li C, Deng C, Theilig F, Bachmann S, Briggs J, Schnermann J, Castrop H. Macula densa control of renin secretion and preglomerular resistance in mice with selective deletion of the B isoform of the Na,K,2Cl co-transporter. J Am Soc Nephrol 17: 2143–2152, 2006. doi: 10.1681/ASN.2006040384. [DOI] [PubMed] [Google Scholar]
- 55.Oppermann M, Mizel D, Kim SM, Chen L, Faulhaber-Walter R, Huang Y, Li C, Deng C, Briggs J, Schnermann J, Castrop H. Renal function in mice with targeted disruption of the A isoform of the Na-K-2Cl co-transporter. J Am Soc Nephrol 18: 440–448, 2007. doi: 10.1681/ASN.2006091070. [DOI] [PubMed] [Google Scholar]
- 56.Oshikawa S, Tanoue A, Koshimizu TA, Kitagawa Y, Tsujimoto G. Vasopressin stimulates insulin release from islet cells through V1b receptors: a combined pharmacological/knockout approach. Mol Pharmacol 65: 623–629, 2004. doi: 10.1124/mol.65.3.623. [DOI] [PubMed] [Google Scholar]
- 57.Pandey G, Shankar K, Makhija E, Gaikwad A, Ecelbarger C, Mandhani A, Srivastava A, Tiwari S. Reduced insulin receptor expression enhances proximal tubule gluconeogenesis. J Cell Biochem 118: 276–285, 2017. doi: 10.1002/jcb.25632. [DOI] [PubMed] [Google Scholar]
- 58.Payne JA, Forbush B 3rd. Alternatively spliced isoforms of the putative renal Na-K-Cl cotransporter are differentially distributed within the rabbit kidney. Proc Natl Acad Sci USA 91: 4544–4548, 1994. doi: 10.1073/pnas.91.10.4544. [DOI] [PMC free article] [PubMed] [Google Scholar]
- 59.Pei H, Sutton AK, Burnett KH, Fuller PM, Olson DP. AVP neurons in the paraventricular nucleus of the hypothalamus regulate feeding. Mol Metab 3: 209–215, 2014. doi: 10.1016/j.molmet.2013.12.006. [DOI] [PMC free article] [PubMed] [Google Scholar]
- 60.Petersen MC, Vatner DF, Shulman GI. Regulation of hepatic glucose metabolism in health and disease. Nat Rev Endocrinol 13: 572–587, 2017. doi: 10.1038/nrendo.2017.80. [DOI] [PMC free article] [PubMed] [Google Scholar]
- 61.Pilkis SJ, el-Maghrabi MR, Claus TH. Hormonal regulation of hepatic gluconeogenesis and glycolysis. Annu Rev Biochem 57: 755–783, 1988. doi: 10.1146/annurev.bi.57.070188.003543. [DOI] [PubMed] [Google Scholar]
- 62.Plata C, Mount DB, Rubio V, Hebert SC, Gamba G. Isoforms of the Na-K-2Cl cotransporter in murine TAL II. Functional characterization and activation by cAMP. Am J Physiol 276: F359–F366, 1999. doi: 10.1152/ajprenal.1999.276.3.F359. [DOI] [PubMed] [Google Scholar]
- 63.Pocai A, Lam TK, Gutierrez-Juarez R, Obici S, Schwartz GJ, Bryan J, Aguilar-Bryan L, Rossetti L. Hypothalamic K(ATP) channels control hepatic glucose production. Nature 434: 1026–1031, 2005. doi: 10.1038/nature03439. [DOI] [PubMed] [Google Scholar]
- 64.Pocai A, Obici S, Schwartz GJ, Rossetti L. A brain-liver circuit regulates glucose homeostasis. Cell Metab 1: 53–61, 2005. doi: 10.1016/j.cmet.2004.11.001. [DOI] [PubMed] [Google Scholar]
- 65.Rabkin R, Ryan MP, Duckworth WC. The renal metabolism of insulin. Diabetologia 27: 351–357, 1984. doi: 10.1007/BF00304849. [DOI] [PubMed] [Google Scholar]
- 66.Rossetti L, Giaccari A, Barzilai N, Howard K, Sebel G, Hu M. Mechanism by which hyperglycemia inhibits hepatic glucose production in conscious rats. Implications for the pathophysiology of fasting hyperglycemia in diabetes. J Clin Invest 92: 1126–1134, 1993. doi: 10.1172/JCI116681. [DOI] [PMC free article] [PubMed] [Google Scholar]
- 67.Sandström PE. Bumetanide reduces insulin release by a direct effect on the pancreatic beta-cells. Eur J Pharmacol 187: 377–383, 1990. doi: 10.1016/0014-2999(90)90365-D. [DOI] [PubMed] [Google Scholar]
- 68.Sandström PE. Evidence for diabetogenic action of bumetanide in mice. Eur J Pharmacol 150: 35–41, 1988. doi: 10.1016/0014-2999(88)90747-9. [DOI] [PubMed] [Google Scholar]
- 69.Sandström PE, Sehlin J. Furosemide causes acute and long-term hyperglycaemia and reduces glucose tolerance in mice. Acta Physiol Scand 132: 75–81, 1988. doi: 10.1111/j.1748-1716.1988.tb08300.x. [DOI] [PubMed] [Google Scholar]
- 70.Sandström PE, Sehlin J. Furosemide reduces insulin release by inhibition of Cl− and Ca2+ fluxes in beta-cells. Am J Physiol Endocrinol Metab 255: E591–E596, 1988. doi: 10.1152/ajpendo.1988.255.5.E591. [DOI] [PubMed] [Google Scholar]
- 71.Sandström PE, Sehlin J. Furosemide-induced glucose intolerance in mice is associated with reduced insulin secretion. Eur J Pharmacol 147: 403–409, 1988. doi: 10.1016/0014-2999(88)90175-6. [DOI] [PubMed] [Google Scholar]
- 72.Sasaki M, Sasako T, Kubota N, Sakurai Y, Takamoto I, Kubota T, Inagi R, Seki G, Goto M, Ueki K, Nangaku M, Jomori T, Kadowaki T. Dual regulation of gluconeogenesis by insulin and glucose in the proximal tubules of the kidney. Diabetes 66: 2339–2350, 2017. doi: 10.2337/db16-1602. [DOI] [PubMed] [Google Scholar]
- 73.Schoolwerth AC, Smith BC, Culpepper RM. Renal gluconeogenesis. Miner Electrolyte Metab 14: 347–361, 1988. [PubMed] [Google Scholar]
- 74.Simon DB, Karet FE, Hamdan JM, DiPietro A, Sanjad SA, Lifton RP. Bartter’s syndrome, hypokalaemic alkalosis with hypercalciuria, is caused by mutations in the Na-K-2Cl cotransporter NKCC2. Nat Genet 13: 183–188, 1996. doi: 10.1038/ng0696-183. [DOI] [PubMed] [Google Scholar]
- 75.Singh R, Almutairi MM, Pacheco-Andrade R, Almiahuob MY, Di Fulvio M. Impact of hybrid and complex N-glycans on cell surface targeting of the endogenous chloride cotransporter Slc12a2. Int J Cell Biol 2015: 505294, 2015. doi: 10.1155/2015/505294. [DOI] [PMC free article] [PubMed] [Google Scholar]
- 76.Singh R, Kursan S, Almiahoub MY, Almutairi MM, Garzón-Muvdi T, Alvarez-Leefmans FJ, Di Fulvio M. Plasma membrane targeting of endogenous NKCC2 in COS7 cells bypasses functional Golgi cisternae and complex N-glycosylation. Front Cell Dev Biol 4: 150, 2017. doi: 10.3389/fcell.2016.00150. [DOI] [PMC free article] [PubMed] [Google Scholar]
- 77.Soto M, Orliaguet L, Reyzer ML, Manier ML, Caprioli RM, Kahn CR. Pyruvate induces torpor in obese mice. Proc Natl Acad Sci USA 115: 810–815, 2018. doi: 10.1073/pnas.1717507115. [DOI] [PMC free article] [PubMed] [Google Scholar]
- 78.Stumvoll M, Meyer C, Kreider M, Perriello G, Gerich J. Effects of glucagon on renal and hepatic glutamine gluconeogenesis in normal postabsorptive humans. Metabolism 47: 1227–1232, 1998. doi: 10.1016/S0026-0495(98)90328-6. [DOI] [PubMed] [Google Scholar]
- 79.Stumvoll M, Meyer C, Perriello G, Kreider M, Welle S, Gerich J. Human kidney and liver gluconeogenesis: evidence for organ substrate selectivity. Am J Physiol Endocrinol Metab 274: E817–E826, 1998. doi: 10.1152/ajpendo.1998.274.5.E817. [DOI] [PubMed] [Google Scholar]
- 80.Takahashi N, Chernavvsky DR, Gomez RA, Igarashi P, Gitelman HJ, Smithies O. Uncompensated polyuria in a mouse model of Bartter’s syndrome. Proc Natl Acad Sci USA 97: 5434–5439, 2000. doi: 10.1073/pnas.090091297. [DOI] [PMC free article] [PubMed] [Google Scholar]
- 81.Tiwari S, Singh RS, Li L, Tsukerman S, Godbole M, Pandey G, Ecelbarger CM. Deletion of the insulin receptor in the proximal tubule promotes hyperglycemia. J Am Soc Nephrol 24: 1209–1214, 2013. doi: 10.1681/ASN.2012060628. [DOI] [PMC free article] [PubMed] [Google Scholar]
- 82.Varlamov O, Bethea CL, Roberts CT Jr. Sex-specific differences in lipid and glucose metabolism. Front Endocrinol (Lausanne) 5: 241, 2015. doi: 10.3389/fendo.2014.00241. [DOI] [PMC free article] [PubMed] [Google Scholar]
- 83.Whitton PD, Rodrigues LM, Hems DA. Stimulation by vasopressin, angiotensin and oxytocin of gluconeogenesis in hepatocyte suspensions. Biochem J 176: 893–898, 1978. doi: 10.1042/bj1760893. [DOI] [PMC free article] [PubMed] [Google Scholar]
- 84.Xie Z, Currie KP, Cahill AL, Fox AP. Role of Cl− co-transporters in the excitation produced by GABAA receptors in juvenile bovine adrenal chromaffin cells. J Neurophysiol 90: 3828–3837, 2003. doi: 10.1152/jn.00617.2003. [DOI] [PubMed] [Google Scholar]
- 85.Yan H, Yang W, Zhou F, Li X, Pan Q, Shen Z, Han G, Newell-Fugate A, Tian Y, Majeti R, Liu W, Xu Y, Wu C, Allred K, Allred C, Sun Y, Guo S. Estrogen improves insulin sensitivity and suppresses gluconeogenesis via the transcription factor Foxo1. Diabetes 68: 291–304, 2019. doi: 10.2337/db18-1875-P. [DOI] [PMC free article] [PubMed] [Google Scholar]